-
Paper Information
- Next Paper
- Paper Submission
-
Journal Information
- About This Journal
- Editorial Board
- Current Issue
- Archive
- Author Guidelines
- Contact Us
American Journal of Economics
p-ISSN: 2166-4951 e-ISSN: 2166-496X
2020; 10(1): 29-36
doi:10.5923/j.economics.20201001.05

Impact of Economic Parameters of China and Pakistan with Return on Assets and Tobin’s Q Using Statistical Techniques
Shabana Yasmeen1, 2, Yasmin Zahra Jafri1, Ghulam Murtaza3, Summiya Malik4, Zahra Khanum1, Sayed Fareed Ullah1
1Department of Statistics, University of Balochistan Quetta, Pakistan
2Agriculture Research Institute Mastung, Pakistan
3Department of Disaster Management and Development Studies University of Balochistan, Quetta, Pakistan
4Agriculture Research Institute of Quetta, Pakistan
Correspondence to: Shabana Yasmeen, Department of Statistics, University of Balochistan Quetta, Pakistan.
| Email: |  |
Copyright © 2020 The Author(s). Published by Scientific & Academic Publishing.
This work is licensed under the Creative Commons Attribution International License (CC BY).
http://creativecommons.org/licenses/by/4.0/

The study was proposed to test the relationship between firm performance with size, growth, tax, and business risk. Considering the sample of 60 listed companies from Pakistan and China for a period of seven years spanning from 2007-2013 thereby making 420 observations. Random and Fixed effect panel regression was run based on Hausman specification test on pooled and country-wise data. Tobin’s Q and return on assets (ROA) were taken as dependent variables as indicators of firm performance. The data was tested for multicollinearty and its absence was concluded. However, Breusch-Pagan and Wooldridge tests confirmed presence for Heteroscedasticity and autocorrelation, respectively. Thus the regressions were run with the option of Newey-West standard errors. The study has found ROA has greater average for Chinese companies, which indicate that Pakistani companies have low accounting performance as compared to Chinese firms. Results also show that China has higher growth rate. The panel data regression elucidated that size, growth opportunity and business risk have significant positive effect over firm performance in both countries’ firms. On the other hand, tax had negative effect over performance but the relationship was not statistically significant.
Keywords: Firm performance, Return on Asset, Panel data, China, Pakistan
Cite this paper: Shabana Yasmeen, Yasmin Zahra Jafri, Ghulam Murtaza, Summiya Malik, Zahra Khanum, Sayed Fareed Ullah, Impact of Economic Parameters of China and Pakistan with Return on Assets and Tobin’s Q Using Statistical Techniques, American Journal of Economics, Vol. 10 No. 1, 2020, pp. 29-36. doi: 10.5923/j.economics.20201001.05.
Article Outline
1. Introduction
- This study refers to examine performance of industrial units of Pakistan and China, relevant to different sectors, and also compares the results of both countries to check the relationship in firm growth, its size, paid taxes and business risk with overall industrial performance of industries. Pakistan contributes all economic establishments of 90%, With 25% of export earnings and 30% of GDP, The growth of Pakistan in general and, especially in manufacturing sectors reminded more than average and less than very in the recent past, The period from 1960 to 2012 the GDP annual average growth rate is 4.47% only, while manufacture sector with growth rate was approximately 6.3%. Conversely in this identical period mostly ‘regional economies rapidly grew with high percentages’ and China with phenomenal GDP leading with 9.1% of growth rate. While conferring to IMF, China rank 67th per capita income by GDP (nominal) and 73rd by GDP, Purchasing power parity (PPP) per capita 2018. China has projected 23 trillion Dollar cost of natural possessions, 90% of which rare earth metals and coal. In emerging markets like Pakistan, corporate governance plays a vital role as a part of the public policy. Due to Pakistan China economic corridor, a huge revival has been witnessed in the automobile assemblers in Pakistan; which makes this sector worthy to study. China has potential to globally take over the American economy in next few years and in Pakistan also numerous mega projects will be implemented due to incoming features by China. Significantly Pakistan and China have recently agreed for implementation of Pakistan China Economic Corridor (CPEC) projects, which can be termed as a local economic incorporation elsewhere in the topographical route; it signifies the internal official arrangements and macroeconomic management between Pakistan and China.
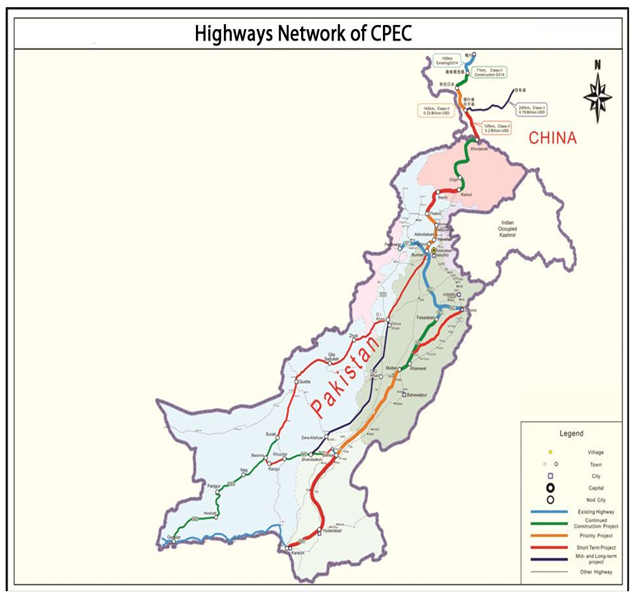 | Figure 1. Map of Pakistan and China showing CPEC route |
2. Literature Review
- In following section we explore and discus correlated literature which are concerned with the association among performance of firm and size, tax, growth and risk, details of response variables.Many researchers enlighten capital structure importance, which also is investigated that in what way a company is funded with principal reputation. If a wrong mixed of finance is selected that would create lot of problems for managers and firms. Some researchers showed that tax advantage which cause decrease in firm’s performance and increase in leverage. [7] Worked on Turkish banking sector and found positive and significant results of capital structure with size, GDP growth and industry leverage. [8] Investigated that firms with high tendency to modernize are the largest, with great technical power and market segments. [9] Studied Pakistan automobile sector for, 2008-2012 for period. They investigated that leverage are significant and negative relationship with liquidity and profitability, while leverage has positive but insignificant with earning variability.[10] Used pooled regression model to explored sector of cement in Pakistan, and found inverse relationship between firm size and leverage. [11] Listed on Karachi stock exchange of Pakistan in 2013, examined textile sector, and showed that size and profitability have negative trends found significant relationship with leverage. [12] Concluded that association between firm performance indicators (PM and ROE) and corporate governance mechanism in automobile assemblers in Pakistan, They also examined importance of company governance in Pakistan by t-test and multiple regression models.[13] Examined the stock exchange Karachi using registered non-financial firms of Pakistan in period of 2004-2012 and found negative correlation between Leverage and profitability. [14] In Japan concluded that research units are only developed, through the data subject’s limitation. On various countries leading a practical study including Jordan Egypt, Bahrain, Qatar, Kuwait, Morocco, UAE, Tunisia, Oman, and to see sights of the “effect of structure ownership on the firm routine”. [15] Found that return on equity of firms get a negative relationship with effect of ownership insider, and with influence of block ownership holder get on Tobin’s Q positive effect. Examining firms on the stock exchange listed in Vietnam in duration of their performance grounded on their OS (ownership structure), [16] get between ownership and firm performance a non-linear relationship. [17] Investigated that, the crisis of energy has a great effect on performance of firm listed in Pakistan, though (CPEC) China Pakistan economic corridor is probably to solve the energy crises. Food registered firms could have raised capability for production. [18] examined the association among firm performance and CG (corporate governance) based on Pakistan listed 10 firms, did not find a straight relationship among the three corporate governance structures such as including board composition, board size based and audit committee composition depending on the two of variables of performance which are ROA (Return on asset) and NPR (net profit ratio). [19] measured the business environment constraints on the firm performance and he showed the few business constraints effected performance. Other factors such as education, health care matter more than difference in the business environment for firm performance. [20] Suggested that relationship between managerial ownership and firm performance of listed Turkish firms for the period 2004 to 2008. They used panel data analysis that conclude that significant relationship between managerial ownership and firm performance with respect to Tobin’s Q. [21] examined the financial performance of the companies with foreign ownership listed on the Istanbul stock exchange using panel data analysis with the sample of 205 non-financial firms for the period 2005 to 2007 and their results conclude that foreign ownership improves firm financial performances in Turkey.
3. Materials and Methods
3.1. Population and Sampling
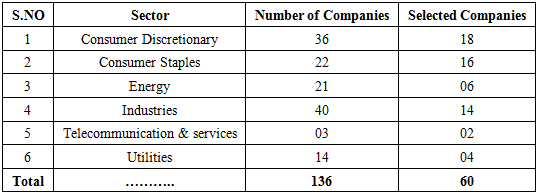
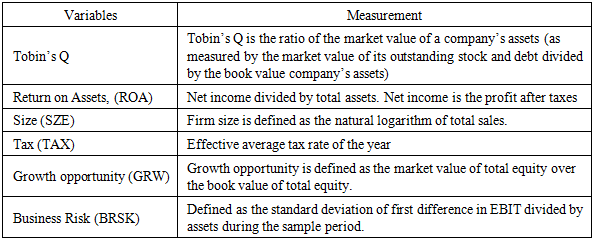
- Our samples consist of data of 60 companies, 30 each from Pakistan and China. These sample firms are comprised of six different sectors (Consumer discretionary, consumer staple, Energy, T & S and utilities, see table 1). These firms are observed from the period of 2007 to 2013, thus comprising of a penal data of 420 observations. The firms in each country are selected using the criteria of the highest market capitalization and the availability of respective firm data over the sample period of 7 years. Data for firm specific variables, country-specific variables and leverage are collected from Capital IQ by Standard & Poor’s. In our study the response variables is firm performance and we have considered its two indicators namely return on Assets (ROA) and Tobin’s Q. (table 2). The book value of total debt and equity of market value is diving by total asset to obtain Tobin’s Q. While independent variable are size of firm and tax paid by firm to government, growth opportunity and Business Risk of the firm. The list of dependent and independent variables taken under consideration for this study is in the following table 2. For this study the selected number of registered companies are 60 from Pakistan and China which are arranged in different 6 sectors mentioned earlier. That will be studied in time period of 2007-2013. The selection of firms is represented in table 1 below:
|
3.2. Empirical Model and Proxies Variables
- We have used two measures of firm performance namely, Tobin’s Q and ROA, and this Tobin’s Q is considered as major indicator of performance of a company. In this paper Tobin’s Q shows the performance of market measurement of firms. And Return on asset is showing measures of accounting performance. The purpose to examining more than one substitution for performance in this work is to know whether the explanatory variable enlightened the measures of performance running on the same level or not. Most of the researchers take ROA as measure of performance for accounting and Tobin’s Q as market performance measures. For example, [22] used return on asset which calculated as ratio of net profit to total assets. [23] and [24] investigated that firm’s size may influence that’s its performance, the firms which are large in size have no capacity and capability. Since in this study try to regulator the variation in firm’s operating situation as well as the viable of size in model.The association between performance as a dependent variable and four independent variables was tested by following models:
 | (1) |
 | (2) |
|
3.3. Testing of Hypothesis
- Firm size is defined as the natural logarithm of total sales. The hypothesis for firm size that, it is positively associated with performance of firm, as bankruptcy costs decrease with size. Therefore, it is predictable that size of firm has positive association with performance. Size influence significance and positive trend result on (ROA) firm performance. So first Hypothesis can be written as:H1: Firm size is expected to have positive impact on performance of firm.Occasions of growth are measured by Growth of sales. It is estimated that firms which have great opportunities of growth have performance ratio high, the growth opportunities are expected to have positive affect performance of firm as growth companies are capable to make income from shares. Therefore second hypothesis can be written as: H2: Firm’s performance has negative relation with TaxA standard deviation of cash flow gives us a measure of business risk of firms which have advanced variation in functioning returns are considered to consume greater return. Therefor the third hypothesis can be tested as:H3: Firm’s performance increase by growth opportunityWe always have the influence of Tax on firm’s performance. As the profitability decreases the effective tax rate became higher. And this accrues only that situation when there is a high share of non-detectable expenses or we can say a big firm achieve a higher taxable income in a tax burden. Based on all these discussion, thus our fourth hypothesis is stated as:H4: Corporate performance has positive relation with riskRegression model takes the form of random effect models for unstable panel data. And these random effect models well suited in this set of data, Thus it is necessary to regulate the effect of the Industrial sectors on firm performance and the fixed effect model, does not permit to control the effect of the industrial sectors because industrial models do not change with passage of time, That’s why not being described in the fixed effect models.
4. Result and Discussion
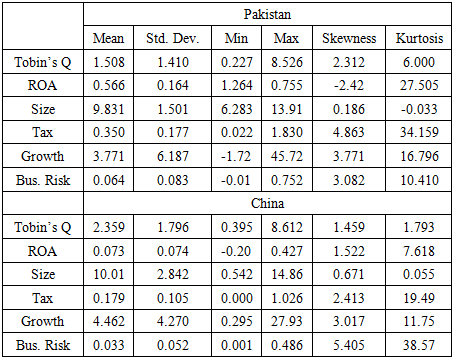
- The result of the model estimation with each performance measured and all samples of observation for the period of 2007-2013 are shown in table 3 with descriptive statistics. The average return on assets for the sample as a whole is 5.6% while the Tobin’s Q is about 15.08% of Pakistan and similarly the average value ROA and Tobin’s Q for companies of China is 7.3% and 23.59%, respectively. This indicates that Pakistani companies have low accounting performance as compared to Chinese companies. As China is a developed country, therefore, 44.6% growth rate is highest value as compare to Pakistan, 37.7%. In both tables of Pakistan and China the low standard deviation for the variables ROA, tax and business risk, highlights the point that variables are less risky in their applications in the current study.
|
4.1. Testing for Multicollinearity
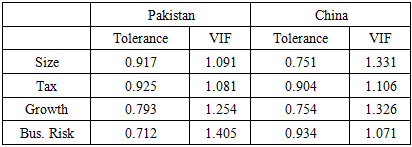
- The variance inflation factor (VIF) and Tolerance statistics were used to test Multicollinearty. If the V.I.F is greater than 10 (VIF˃10) or Tolerance statistics less than 0.10 indicates trouble with Multicollinearty. Table 3 shows the data for both Pakistan and China comparative results that all the independent variables are having weak multicollinearty which indicate approximately that there is no multicollinearty between independent variables elucidated by the response variable. Results indicates in table 4, all the independent variables had V.I.F less than 10 and tolerance statistic greater than 0.10. The study, therefore, concludes that there is no problem of multicollinearty.
|
4.2. Testing for Heteroscedasticity and Autocorrelation
- The Breusch-Pagan test was constructed to test for Heteroscedasticity in the regression models for both subsets of Pakistan and China with ROA and Tobin’s Q as indicators of firm performance. The null hypothesis is that residuals are homoscedastic. The test results of Breusch-Pagan test are presented in table 5. It revealed that with a p-value below 0.05 for both the models with Tobin’s Q, and ROA; the significant chi-squares confirm the presence of Heteroscedasticity in the data.
|
|
4.3. Factors of Firm Performance
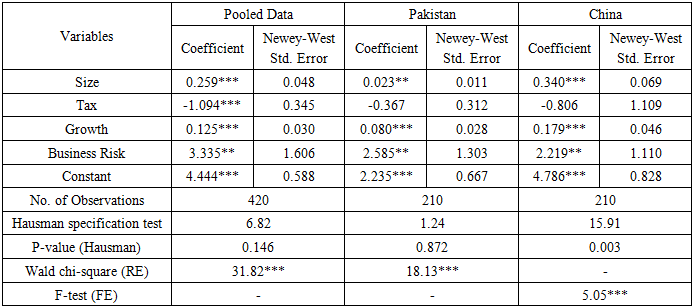
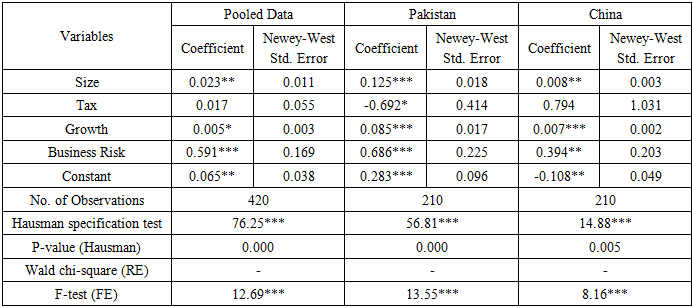
- After having solution for controlling for Heteroscedasticity and autocorrelation, next we have run the panel regression by choosing among fixed effect (FE) model and random effect (RE) model. This selection was done by applying Hausman specification test. The null hypothesis under the test is that the random effect is appropriate. In case of Tobins’s Q, Hausman specification test was accepted in favor of random effect (RE) over fixed effect (FE) for pooled as well as Pakistan data. On the other hand, Hausman specification test confirmed the superiority of FE model over RE model for all regressions having ROA as dependent variable and also for China in case of Tobin’s Q model.Table 7 and table 8 represent findings of micro-level firm specific factors affecting firm performance (taken as Tobin’s Q and ROA, respectively). The regression has been run on pooled observations as well as country-specific observations. The results of Hausman specification test to choose between RE and FE, its p-value, Wald chi-square for RE and value of F-test for FE are also reported. Comparing the results of pooled and country specific models from tables 7 and 8, it is observed that, no matter the performance has been assessed by Tobin’s Q or ROA, size has significant positive affect on firm performance throughout. Therefore, we accept our first hypothesis i.e. H1: Size has positive influence on firm performance.
|
5. Conclusions
- The study was proposed to test the relationship between firm performance with size, growth, tax, and business risk. Considering the sample of 60 listed companies from Pakistan and China for a period of seven years spanning from 2007-2013. The study has found ROA has greater average for Chinese companies, which indicate that Pakistani companies have low accounting performance as compared to Chinese firms. Results also show that China has higher growth rate. Random and Fixed effect panel regression was run based on Hausman specification test on pooled and country-wise observations. Tobin’s Q and return on assets (ROA) were taken as dependent variables as indicators of firm performance. The data was tested for multicollinearty and its absence was concluded. But Breusch-Pagan test and Wooldridge test for Heteroscedasticity and autocorrelation, respectively, confirmed their presence. Thus the regressions were run with the option of Newey-West standard errors. The panel data regression elucidated that size, growth opportunity and business risk showed significant positive effect over firm performance in both countries Pakistan and China. On the other hand, tax had negative effect over performance but the relationship was non-significant.
References
| [1] | Modigliani, F., & Miller, M. H., 1959, The cost of capital, corporation finance, and the theory of investment, The American Economic Review, 49(4), 655-669. |
| [2] | Tuan, N., Nhan, N., Giang, P., & Ngoc, N., 2016, The effects of innovation on firm performance of supporting industries in Hanoi, Vietnam, Journal of Industrial Engineering and Management, 9(2), 413-431. |
| [3] | Al Amri, M., & Al Ani, M., 2015, The determinants of capital structure: an empirical study of Omani listed industrial companies, Business: Theory and Practice, 16, 159. |
| [4] | Vijayakumar, A., Tamizhselvan, P., 2010, Corporate size and profitability-an empirical analysis, College Sadhana – Journal for Bloomers of Research, 3(1), 44-53. |
| [5] | Hall, B. H., 1987, The relationship between firm size and firm growth in the US manufacturing sector, Journal of Industrial Economics, 35(4), 583. |
| [6] | Cameron, K., 1986, A Study of Organizational Effective-ness and its Predictors, Management Science, 32(1), 87-112. http://dx.doi.org/10.1287/mnsc.32.1.87. |
| [7] | Baltacı, N., & Ayaydın, H., 2014, Firm, country and macroeconomic determinants of capital structure: Evidence from Turkish banking sector, EMAJ: Emerging Markets Journal, 3(3), 47-58. |
| [8] | Brown, F., & Guzmán, A., 2014, Innovation and productivity across Mexican manufacturing firms, Journal of technology management & innovation, 9(4), 36-52. |
| [9] | Masnoon, M., & Saeed, A., 2014, Capital Structure Determinants of KSE Listed Automobile Companies, European Scientific Journal, 10(13), 451-461. |
| [10] | Khan, I., Jan, S. U., & Khan, M., 2015, Determinant of capital structure: An empirical study of cement sector of Pakistan, Asian Journal of Management Sciences & Education, 4(3), 50-60. |
| [11] | Ahmad, Y., & Zaman, G., 2013, Determinants of capital structure: A case for the Pakistani textile composite sector, Abasyn Journal of Social Sciences, 6(1), 91-10. |
| [12] | Ansari, B., Gul, K., & Ahmad, N., 2017, corporate governance and firm performance: Automobile assemblers listed in Pakistan stock exchange (PSX). Journal of Business Strategies, 11(2), 125-140. |
| [13] | Qadri, S. Q. S. U., 2015, An Empirically study of determinants of capital structure of non-financial listed companies in KSE, International Journal of African and Asian Studies, 12, 50-55. |
| [14] | Dekle, R., Kawakami, A., Kiyotaki, N., & Miyagawa, T., 2015, Product dynamics and aggregate shocks: evidence from Japanese product and firm level data. USC-INET Research Paper. |
| [15] | Ahmed, N., & Hadi, O. A., 2017, Impact of ownership structure on firm performance in the Mena region: An empirical study, Accounting and Finance Research, 6(3), 105-115. |
| [16] | Phung, D. N., & Mishra, A. V., 2016, Ownership structure and firm performance: Evidence from Vietnamese listed firms, Australian Economic Papers, 55(1), 63-98. |
| [17] | Mahmood, W., A. Bashir, 2017, Energy management modernization and economic growth: An analysis of CPEC based energy projects and energy crisis in Pakistan. |
| [18] | Azhar, K. A., & Mahmood, W., April 2018, Relationship of corporate governance and firm performance: Investigation from textile sector of Pakistan. In 31st IBIMA Conference (pp. 25-26). |
| [19] | Commander, S. and J. Svejnar, 2011, Business environment, exports and firm performance, The review of Economics and Statistics, 93(1): 309-337. |
| [20] | Unlu, U., Bayrakdaroglu, A., and Samiloglu, F., 2011, Managerial ownership and corporate value: Evidence from ISE. Ankara University SBF Journal, 66(2), pp.201-214. |
| [21] | Gurbuz, A.O. and Aybars, A., 2010, The impact of foreign ownership on firm performance, evidence from an emerging market: Turkey, American Journal of Economics and Business Administration, 2(4), pp.350-359. |
| [22] | Zeitun, R., & Tian, G. G., 2014, Capital structure and corporate performance: Evidence from Jordan, Australasian Accounting Business & Finance Journal, Forthcoming, 1(4), 40-61. |
| [23] | Ramaswamy, K., 2001, Organizational ownership, competitive intensity, and firm performance: An empirical study of the Indian manufacturing sector, Strategic Management Journal, 22(10), 989-998. |
| [24] | Ebaid, El-Sayed, 2009, The impact of capital-structure choice on firm performance: empirical evidence from Egypt, The Journal of Risk Finance, 10(5), 477-487. |
| [25] | Wooldridge, J. M, 2010, Econometric Analysis of Cross Section and Panel Data, Cambridge, MA: MIT Press. |
| [26] | Frank, M., & Goyal, V., 2009, Capital structure decisions: Which factors are reliably important? Financial Management, 38(1), 1-37. |
| [27] | Jermias, J., 2008, the relative influence of competitive intensity and business strategy on the relationship between financial leverage and performance, British Accounting Review, 40(1), 71-86. |
| [28] | Lee, J., 2009, Does size matter in firm performance? Evidence from U.S public firms, International Journal of Economics and Business, 16(2), 189-203. |
| [29] | Voulgaris, F., & Lemonakis, C., 2014, Competitiveness and profitability: The case of chemicals, pharmaceuticals and plastics, The Journal of Economic Asymmetries, 11, 46-57. |
| [30] | Hutchinson, M., & Gul, F. A., 2004, Investment opportunity set, corporate governance practices and firm performance‖, Journal of Corporate Finance, 10(4), 595-614. |
| [31] | Ramadan, A. H., Chen, J. J., Al-Khadash, H., & Atmeh, M., 2012, Mediating role of debt level on the relationship between determinants of capital structure and firms’ financial performance, International Research Journal of Applied Finance, 3 (1), 65-92. |
| [32] | Ross, S. A., 2005, Capital structure and the cost of capital. Journal of Applied Finance, 15(1), 5-24. |
| [33] | Qurat-ul-Ain, 2019, Determinants of Capital Structure and Firm Performance: Evidence from Asia. PhD Dissertation, School of Management, Asian Institute of Technology, Thailand. |
 Abstract
 Reference
 Full-Text PDF
 Full-text HTML