-
Paper Information
- Paper Submission
-
Journal Information
- About This Journal
- Editorial Board
- Current Issue
- Archive
- Author Guidelines
- Contact Us
American Journal of Economics
p-ISSN: 2166-4951 e-ISSN: 2166-496X
2019; 9(5): 232-241
doi:10.5923/j.economics.20190905.02

Impact of Trade Liberalization and Policies for Sustainable Management of Natural Resources (A Case Study on Uganda’s Agricultural Sector)
 Abstract
 Reference
 Full-Text PDF
 Full-text HTML
Settimba Muhamadi, Qiao Yue
School of Economics, Shandong University, Jinan, PR China
Correspondence to: Settimba Muhamadi, School of Economics, Shandong University, Jinan, PR China.
| Email: |  |
Copyright © 2019 The Author(s). Published by Scientific & Academic Publishing.
This work is licensed under the Creative Commons Attribution International License (CC BY).
http://creativecommons.org/licenses/by/4.0/

This paper summarizes and extends the importance of natural resources with sustainable management on Agriculture that has shown the main growth of different crops, fruits and natural resources that help in overcoming economic situations of the country. In summary, the relationship between FDI and growth is not well predicted thus, mixed conclusions can be drawn from the fact that studies are conducted on panels hence being specific on different countries. Over the last two decades, the effect of FDI on economic growth has increased in developing countries, particularly in Africa that develops examining of the impact of FDI on the Agriculture and economic growth of most countries from 1993 to 2017 using the random effects, fixed effects and GMM method. Empirical results show that FDI has no positive effect on economic growth across different countries but in recent years have had a positively significant effect on the economic growth of most member states and the impact of FDI on the economic growth of largest countries in terms of GDP and per capita GDP is positive. In landlocked countries, the effect of FDI on economic growth is positively insignificant thus making study analysis become more important especially when basing on FDI effects within most African states which study qualifies necessary to researchers especially on the effects of FDI on the economic growth of African states so this explains research on FDI relations and the economic growth of different countries.
Keywords: Trade liberalization policies, Sustainable Management, Natural Resources, Agriculture
Cite this paper: Settimba Muhamadi, Qiao Yue, Impact of Trade Liberalization and Policies for Sustainable Management of Natural Resources (A Case Study on Uganda’s Agricultural Sector), American Journal of Economics, Vol. 9 No. 5, 2019, pp. 232-241. doi: 10.5923/j.economics.20190905.02.
Article Outline
1. Introduction
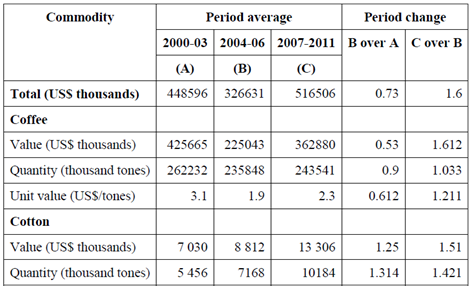
- Agriculture is a fundamental instrument for sustainable development and poverty reduction, and its growth can be a powerful means for reducing inequalities. The World Development Report found that growth originating in the agricultural sector is two to four times as effective as growth originating in the non-agricultural sector hence increasing incomes of income distribution as Brown et al., (1992). Not being a surprise for Agricultural growth in many developing countries that fail to sustain a rapid transition out of poverty without raising productivity in mainly the agricultural sector hence the way to raise urban productivity unless the non-agricultural economy is growing. This is not a surprise that agricultural growth also has a much more result on hunger than general economic growth does, due to that factor many countries fail to sustain a rapid transition historical record is very clear on the important role that agriculture itself plays in stimulating growth in the non- agricultural economy in the short and medium run (Beverton, R.J &., 1957).Uganda’s food exports in comparison to food imports which explains the net food deficit between 2005 and 2015, Food imports constituted 77%-87% of the total agricultural imports over the years (Bur fisher, 2002).This high proportion of food value is attributed to the increased investment in food processing industries that use refined sugar and the rising urban population that mainly consumes wheat and rice. Food exports has a percentage of total agricultural exports were in 2005-2013 a change was seen but 2008-2015 a slight drop was proved (Economics, 1997). The overall contribution of food exports to total Farming produce with continued exportation of food items for little value added. Having experienced a total review on all produce we manifest a strong growth trend as it increases in production. Uganda’s non-food agricultural imports consist of tallow and machinery, while non-food agricultural exports include cotton, tobacco, floricultural products, and hides and skins. Uganda’s agriculture sector still accounts for over 70 percent of its exports. These exports are mainly dominated by coffee, as shown in chart 1. Uganda ranks ninth in the world (accounting for 3 percent of the world’s coffee production) and is second in Africa to Côte d’Ivoire. Coffee provides employment to approximately nine million Ugandans, either directly or indirectly. Smallholder farmers produce 99 percent of total coffee output.
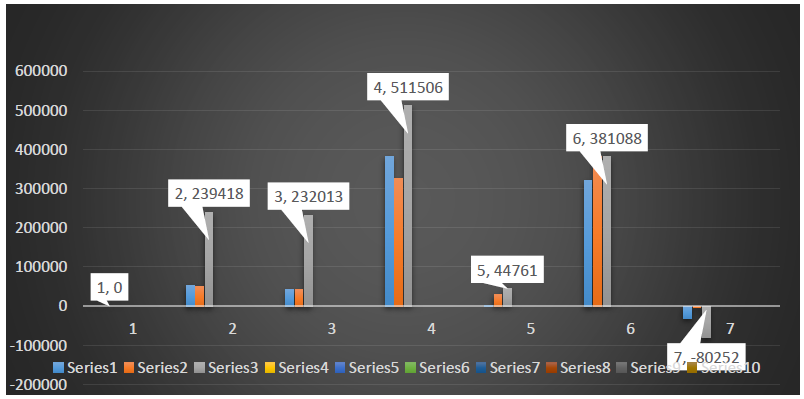 | Chart 1. Uganda’s agriculture and food trade position (Source: FAO Statistical Databases, FAOSTAT 2001) |
1.1. Market Access
- All Uganda’s agricultural products are equally valued, although the bound rates differ from one product to another (Graham, 1927-1928). The bindings are at ceiling rates of 80 percent for most agricultural products, except for 60 tariff lines, with bound rates varying between 40-70 percent, while non-agricultural products including photographic goods, rubber and certain machinery are bound between 40 and 80 percent. Tariffs are the main trade policy instrument used by the Ugandan government, based on the HS nomenclature that was adopted in 1993. An import license commission of 2 percent and a withholding tax of 4 percent are collected on all imports, which raise the average rates of import duty (Hamblyn, 1966). In addition, an excise duty of 10 percent is levied on almost all goods (imported or locally produced), with the exception of cigarettes, alcoholic beverages and soft drinks, which are charged 130 percent, 70 percent and 15 percent, respectively. Special protection exists for local sugar and textile industries. A value-added tax of 17 percent applies to most goods whether imported or domestically produced, with the exception of unprocessed agriculture products. Uganda has applied the customs valuation method based on transaction value since July 2000. The adoption of the transaction value led to the elimination of pre-shipment inspection requirements on imports. However, minimum import prices are maintained on used goods, vehicles, textiles, tiles, batteries and safety matches. The 2000/2001 applied tariff schedule has 5 161 lines at the HS six-digit level and three bands: zero, 7 percent and 15 percent, with all tariffs being ad valorem except on fuel. The simple average rate of Uganda’s 2000/2001 applied MFN tariff is 9 percent, with a standard deviation of 5.4 percent and coefficient of variation of 0.6, which depicts a moderate dispersion of tariff rates from one category of products to another (Kaufman, 1997). The modal rate (the rate occurring most frequently) is 7 percent and applies to 44.3 percent of all tariff lines, while the maximum rate of 15 percent applies to 39.3 percent of all tariff lines. The zero rate applies to 16.4 percent of all tariff lines.
1.2. Impacts of Agriculture on Uganda’s GDP
- The agricultural sector is dominant in Uganda's economy, the sector grows at an annual average of only 3.7 percent over 1990-99 compared to the far more impressive growth of the industrial and service sectors, the importance of agriculture in Uganda's economy outweighs all other sectors put together. The agricultural sector employs 82 percent of the workforce, accounts for 90 percent of export earnings, and provided 44 percent of GDP in 1999. Moreover, the farmers in Uganda's 2.5 million smallholdings and scattered large commercial farms provide the majority of their own and the rest of the country's staple food requirements. Uganda is able to rely on agriculture due to the country's excellent access to waterways, fertile soils (relative to many other African nations), its regular rainfall, although it does still suffer from intermittent droughts such as in 1993-94. Uganda's key 22 agricultural products can be divided into cash crops, food crops, and horticultural produce. The most important cash crops are coffee, tea, cotton, tobacco, and cocoa. Uganda is second only to Kenya as Africa's largest producer of tea, exporting US$17.06 million of tea in 1996 and $39 million by 1998. Unmanufactured tobacco exports provided US$9.5 million in 1998, over 25 percent more than in 1996. The export of cocoa beans hit a recent high in 1996 with US$1.07 million in export receipts, but this had declined to $0.87 million in 1998. The primary food crops, mainly for domestic consumption, include plantains, cassava, maize, millet, and sorghum.Oxford University Press, 1996 provided US$17.82 million of exports in 1998. This gain was in part negated as imports of cereals were $30.9 million in the same year. The more recent development of cultivating horticultural produce includes fresh flowers, chilies, vanilla, asparagus, and medicinal plants. At the beginning of 2001 it is unclear how well horticultural production will prosper but it does indicate the economy's potential diversity. The fact that vanilla production is the third largest in Africa, providing US$930,000 in export receipts in 1998 is a success in itself. As market operations become more concentrated and globalized, small farmers – and women in particular are increasingly excluded from the economy. Unable to lower transaction costs and remain competitive, small farmers in developing countries are often forced to abandon production.
1.3. Domestic Policies
- Incentives may force women to spend less time tending farm plots, on which food security is based and instead gain employment in the export-oriented sector. The effect of such policies is to burden women with the added responsibility, providing food for the household and continuing to do the unpaid work that it is taken for granted women will provide in the reproductive economy. As market successful export performance in agricultural economies where smallholder producers are predominant. Farmers who are unable to compete in this environment tend to abandon the land. Women in their capacity as small and subsistence farmers are among the least able to benefit from new market opportunities for agriculture. Operations become more concentrated and globalized, small farmers and women in particular are increasingly excluded from the economy. Unable to lower transaction costs and remain competitive, small farmers in developing countries are often forced to abandon production. When they abandon or sell their farms, further land concentration results, enabling commercial crop production to expand. Trade liberalization often exposes domestic markets to food imports while crowding out home grown food.
1.4. The Impacts of Commercialization
- On rural households is ambivalent: it promotes monetary income, but at the expense of important social and economic functions such as household food production, social activities, child care, education and leisure. Moreover, as agriculture becomes more market-oriented, rural households become increasingly dependent on monetary income to meet the basic food needs of the family. Job opportunities for Ugandans often come from off-farm employment rather than from within the agricultural sector with which they are familiar (Okedi, 1970). These jobs do not necessarily improve Ugandan’s income and standard of living, too often being characterized by low wages, lack of social protection and poor contractual conditions. A woman’s contribution to the family income may even decline in real terms, further lowering her bargaining potential within the household. In the main areas women farmers who are active in non-traditional agricultural exports are those better placed to enjoy some benefits, in the short term from export promotion (Gee, 1996). Women then tend to be worse placed than men to shield themselves from the negative effects and to take advantage of positive effects of trade expansion Country.
1.5. Uganda’s Economic Success
- As a result of the Structural Adjustment Programs (SAPs) pursued over the last decade. The main elements of these programs involved policies to promote investment, trade liberalization and privatization of public enterprises. These have resulted in rapid GDP growth, increased supply of goods on the domestic market and increases in exports. Fish exports have similarly risen reaching US $45 million in 1996, when coffee was second only to fish among the highest export earners for the country. However, despite these short-term successes there has been a lack of clarity on the full impact of SAPs policies on the sustainability of fisheries resources. The purpose of this study has therefore been to assess the impact of investment promotion, trade liberalization and privatization on fisheries utilization and sustainability with a view to generating policy. If trade liberalization were both easily measured and if there were many historical instances in which liberalization could be identified as the main economic shock,it might be simple to derive regulatory ideas unfortunately these conditions do not hold so there is little empirical evidence on this question hence turning into individual analysis on the question and finding through graphs for easy explanation of the components.The primary food cropsMainly for domestic consumption, include plantains, cassava, maize, millet, and sorghum. Total cereal production was 1.76 million metric tons in 1998, which provided US$17.82 million of exports in 1998. This gain was in part negated as imports of cereals were $30.9 million in the same year. The more recent development of cultivating horticultural produce includes fresh flowers, chilies, vanilla, asparagus, and medicinal plants. At the beginning of 2001 it is unclear how well horticultural production will prosper but it does indicate the economy's potential diversity. The fact that vanilla production is the third largest in Africa, providing US$930,000 in export receipts in 1998 is a success in itself. Northeast Uganda is dominated by pastoralist (cattle farming). Although agricultural production is apparent in some areas, this is normally a mixture known as "agro-pastoralists" (integrated cattle and crop farming). It should be noted that pastoralism is in decline due to the constant cattle raids by guerrilla groups such as the Lord's Resistance Army based in southern Sudan, as well as government and aid agency intervention which encourages the fencing off of land to discourage the traditional free-roaming of cattle.Recent Agricultural Developments in UgandaIt begins with the review of the national accounts, using the data from the Uganda Bureau of Statistics (UBOS). The analysis of the country-level developments is then disaggregated spatially, showing geographic differences as well as commonalities(Gee, 1996). From spatial differences the analysis further moves to assess the extent of diversification and specialization of Ugandan farmers and factors behind the decisions to diversify, specialize, and commercialize, using the data from the Uganda National Household Surveys (UNHS) which in a long run compares the performance of small vs. large farms and discusses pros and cons of supporting certain farm models for commercialization and inclusive growth/poverty reduction.National AccountsThe agriculture continues playing the important role in Ugandan economy, but its share has significantly declined over time. In the end of 1980s, the agriculture accounted for 51 percent of GDP, but in 2008 its share was 15.4 percent. The declining share of agriculture in the economy is not necessarily a bad thing if rural-urban migration stimulates manufacturing and services. But in Uganda, very little structural transformation has happened in recent two decades, pointing on the weak performance of potentially powerful agriculture rather than the success of non-agriculture. The share of manufacturing remained at the low percent of GDP, while the agricultural labor is still at around 70 percent of total labor force. Clearly, Uganda has not experienced many gains that regions in Eastern Europe, Asia and Latin America have gotten from structural transformation.Reasons to believe in Agricultural sector growth in UgandaDominated by the smallholders, has been better than reported in the national accounts.If it’s per capita agricultural production indeed lagged behind of that in neighboring countries the inflation in Uganda should have been much larger. Uganda has that the smallholder-based agriculture is very likely to have performed much better than believed greatly diversified its export structure away from coffee, and it actively trades not only with industrial cash crops but also with food staples, across the border, and also with the World Food Program, for which Uganda is the largest source of locally-procured maize in Africa. On the weakness of the official statistics in Uganda and in spite of the chronic under provision of public services to the sector. During 2001-08, the agricultural sector expenditure was only 4 percent of total expenditure, and most spending on infrastructure, especially roads and electricity, bypassed rural areas.Interplay between market participation and crop specialization in UgandaWhen farmers sell more of their produce, they first increase diversification of their production portfolio. Very few farmers begin immediately specialization for markets. This U-shape relationship implies that promoting certain technologies through NAADS, for example, would not necessarily result in the immediate specialization in that commodity. Farmers will keep having diversified portfolio until they get an adequate access to market, human capital, and factors of production to disconnect their production decisions from agricultural products and consumption. At the end, those with access to adequate assets and infrastructure and faced with appropriate incentives would engage actively in markets, while those who lack one or more of those three essential ingredients would largely not.Structural constraints to impede growthOver the medium term, potential output will be strained by the aging equipment in the production side of the economy, limited access to long-term financing from the domestic commercial banking sector, massive skills shortages, electricity deficits and narrowing effective domestic market. The inability of the government to secure ongoing foreign assistance for the country’s economic revival programs continues to be problematic, leaving little fiscal space beyond the operational commitments of the government. Mounting imbalances combined with rigid wage demands could also increase inflationary pressures in the economy, which could escalate even further depending on the timeframe of GDP growth exceeding potential output. Medium-term growth is therefore expected to remain mediocre, converging to around 1–3%, with the risk toward the downside. The Government of Uganda embarked on an investment promotion program in 1987.
2. Literature Review
- Uganda is a landlocked country bordered by Sudan, Kenya, the Democratic Republic of Congo, the United Republic of Tanzania and Rwanda. Uganda’s population has been growing at an average rate of 2.5 percent per annum, increasing from 18.6 million people in 2000 to 40.4 million in 2010 and projected at 29.4 million by the end of 2007. About 80 percent of the country’s total land area is arable, although it is estimated that only 30 percent is being productively utilized. The vegetation is mainly composed of savannah grasslands, woodlands, bush land and tropical rain forest, its substantial natural resources, including fertile soils, for regular rainfall, small deposits of copper, gold, and other minerals, and recently discovered oil. Uganda has never conducted a national minerals survey. Agriculture is the most important sector of the economy, employing over 80% of the work force. Coffee accounts for the bulk of export revenues. Since 1986, the government with the support of foreign countries and international agencies has acted to rehabilitate and stabilize the economy by undertaking currency reform, raising producer prices on export crops, increasing prices of petroleum products, and improving civil service wages. The policy changes are especially aimed at dampening inflation and boosting production and export earnings. More than 75 percent of the country has an equatorial climate that is modified by the high altitude. The southern part of the country receives between 1000 and 1500 mm of rainfall and has two rainy seasons annually, while the northern part has a single rainy season and receives between 600 and 1000 mm of rainfall per annum. The southern parts of Uganda mainly cultivate perennial crops that include coffee and green bananas, while livestock farming is practiced in the drier areas of northern and western Uganda.The agricultural sector is composed of both the monetary and non-monetary subsectors. Its share in GDP has declined from 64.1 percent in 2002 to 41.0 percent in 2011. The non-monetary subsector of agriculture has been the most affected declining from 39.9 percent of total GDP in 2002 to 22.7 percent in 2011 (De Melo, J. and Robinson, 1992). Nonetheless, the agricultural sector remains the backbone of Uganda’s economy as its main source of livelihood and employment for over 60 percent of the population. It contributes over 70 percent of Uganda’s export earnings and provides the bulk of the raw materials for most of the industries that are predominantly agro-based (Beaverton, R.J, 1995). Agricultural output primarily comes from about 3 million smallholder subsistence farmers who own an average farmland area of 2.5 ha. The agricultural sector is dominated by the production of food crops, but cash crops, livestock, fishery and forestry are also important.
2.1. Uganda Trade Policy
- Trade is viewed as an important stimulus to economic growth and trade policies should contribute to Uganda’s poverty reduction efforts, promotion of employment and diversification of exports. In the last 16 years, Uganda’s trade policy objectives have been pursued through continuing liberalization with increased involvement of the private sector, deregulation, privatization and participation in regional agreements, particularly the East African Community (EAC) consisting of Uganda, Kenya and the United Republic of Tanzania and COMESA. Other arrangements that Uganda is involved in include the Inter-Governmental Authority for Development (IGAD), which aims, inter alia, to foster economic cooperation and regional food security among member states. Uganda is also a signatory to the Contour Agreement, which accords 71 ACP countries preferential trade and links with the EU. It also benefits under AGOA of the United States that offers market access to some 1800 manufactured products from African countries without restrictions. The liberalization of agricultural marketing and subsequent abolition of price controls and export taxes reduced Uganda’s trade barriers. Such adjustments could contribute to full exploitation of Uganda’s comparative advantages and the attraction of foreign investment. On 29 September 1994, Uganda ratified the Marrakesh Agreement to become an original Member of the WTO, and thus it is now bound by all WTO Multilateral Agreements. Uganda is treated as an LDC within the WTO. It grants MFN treatment to all its trading partners and has made special efforts to establish appropriate machinery to implement the WTO agreements. Despite the difficulties involved in drafting and making notifications as required by the various agreements, Uganda continues to attempt fulfilling all the notification requirements on the basis of their frequency as for those Agreements relevant to agricultural trade.
2.2. Role of State Trading Enterprises
- As part of Uganda’s efforts to create favorable conditions for a market-driven economy, the monopoly of state agencies in the marketing of agricultural products was abolished. The government established regulatory bodies like the Uganda Coffee Development Authority and the Cotton Development Organization to ensure that farmers and exporters maintain quality standards of products and to provide technical backstopping. Uganda has continued with its privatization program and almost three quarters of all public enterprises have either been divested or liquidated. As of 31 July 2001, only 74 of the 148 public enterprises slated for divestiture had been sold and 34 had been either struck off the register of companies or liquidated. Thus, 40 public enterprises await either privatization or liquidation. The most recent privatizations were carried out in telecommunications services and hotels. Further privatizations continue, although some difficulties have been experienced with the process in banking services and electricity.By 2004, government anticipates that privatization will have been completed even in the transportation and utilities sectors (Graham, n.d.255pp). Current Government priorities are the reform of the water, rail and power subsectors, and an Infrastructure Country Framework. Report initiative is expected to contribute to the development of a more effective and timely utility reform and privatization. However, a considerable amount of work remains in terms of establishing regulatory agencies and implementing privatization transactions. The nature of divestiture has varied tremendously, including public auctions, closed bidding, sale of assets to former private owners, sale of assets to majority shareholders and sale of shares on the stock exchange. The proceeds have been used primarily to meet the termination benefits of workers, payment of debts and the direct costs of preparing the enterprises for privatization.
2.3. Contribution of Chinese companies on Fishing in Uganda
- Fisheries resources are among the most significant natural endowments of Uganda, according to experts. With about 20 percent of its surface area covered by water, Uganda has enormous fisheries resources potential for both capture fisheries and aquaculture production. Uganda's fisheries landscape includes the five large lakes which include Lake Victoria, Kyoga, Albert, Edward, George and Kalinga Channel, 160 minor lakes, rivers, swamps and floodplains all of which are critical habitats, breeding and nursery grounds for fish and suitable sites for fish farming. With a rapid population growth rate of 3.2 percent per annum, one of the highest in the world, fish farming may be the way to go for Uganda especially in the context of limited land for cultivation.China under its Forum on China Africa Cooperation (FOCAC) is helping the east African country boost its fish farming industry. The Asian country under the eight measures announced by President Hu Jintao during the 2006 FOCAC meeting held in Beijing, has set up a five-million U.S dollar fish farming demonstration center dubbed China-Uganda Friendship Agricultural Technological Demonstration Center. At the center located on the outskirts of the capital Kampala, local farmers are trained in modern ways of fish farming using simple and affordable technologies and provision fish hatcheries. Fish experts from across the east African region also visit the center to share knowledge on best practices of fish farming. The Chinese through their vast experience in fish farming over the years, have introduced simple technologies to boost fish production, for instance, cage farming, selective breeding, feeds that have nutrients to boost growth among others. They have also introduced Chinese fish species that can do well in Uganda's environment. As far as fish farming is concerned, it was made visible by this project and I can say this project has transformed the perception that people had about fish farming. People have been able to see fish grow from about 300 grams to about 2 kg in 12 months because of the way the Chinese do fish farming. Experts argued Uganda has the potential of earning huge sums of foreign exchange from fish farming with much more dedicated effort. According to statistics from the Department of Fisheries Resources Annual Report 2010/2011, the fisheries sub sector is estimated to contribute 12 percent to the agricultural GDP and 2.5 percent to the national GDP. Fish emerged as a non-traditional export commodity in the late 1980s (Diao, X. Roe, 2001), with export earnings increasing from 5.3 million U.S. dollars in 1991 to 83.3 million dollars in 2010. The main export market is the European Union and others including the Middle East, United States, Egypt and Southeast Asia. In addition to international exports, there is a dramatic increase in regional export markets to neighboring countries like Democratic Republic of Congo and South Sudan. Statistics from the department of fisheries indicated Uganda produces 450,000 tons of fish out of the required 650,000 tons. The current fish supply cannot satisfy the country's demand on top of the vast regional and international markets. With the coming in of the Chinese, fish production is expected to increase in Uganda (Dixit, A. and Stiglitz, 1997).This collaboration between the Chinese and their Ugandan counterpart has shown that aquaculture business can be viable, out of the 20,000 fish farmers in the country, if 50 acquire the necessary skills and technologies, they will act as model farmers to the rest in the Country (Agriculture, 1998). The entry of the Chinese into Uganda's aquaculture comes in handy in boosting fish production, working in conjunction with local experts, Chinese scientists impart skills on local farmers. The Chinese company Huaqiao Fenghuang Group that is running the demonstration center in conjunction with the Ugandan government has submitted its investment plan to the government (Kaufman, 1997). The over 172 million dollar investment plan if approved by the government, will come into force in 2014 at the end of the three- year project by the Chinese government. The company under its local name Uganda Huaqiao Fenghuang Fisheries Co. Ltd will set up a fish feed factory with capacity to produce 200,000 tons per annum, according to Bur fisher et al., (2001). Trade creation and trade diversion in the East African countries Free Trade Agreement’, the proposal, they also plan to set up a fish processing factory with a capacity of producing 20,000 tons of fish products per annum. Besides pond farming, several areas on Ugandan lakes are being mapped out for designation of cage farming (Dear dorff, 1998).The designated areas will be leased out to investors as a way of increasing fish production and also creation of employment.
3. Research Gap
- The Government of Uganda has been implementing economic reform since 1987 geared at restoring economic growth and development. The reforms centered on economic liberalization and privatization of public enterprises with the aim of promoting private sector participation in the development process. These reforms were amended and consolidated into an all-inclusive government development framework, the Poverty Eradication Action Plan (PEAP), in 1997 that was revised in 2000. The major goal of PEAP is to reduce the poverty level in Uganda from 35 percent in 2000 to less than 10 percent by the year 2017. According to PEAP, the following three conditions are necessary for broad-based economic growth: modernize the agricultural sector by taking into account its comparative advantage at home (Deardorff, 1998b). The modernization of the agricultural sector is one of the major areas of concern for the PEAP. Thus, the Plan for Modernization of Agriculture is aimed at modernizing the agricultural sector through the promotion of a “profitable, competitive, sustainable and dynamic agro-industrial sector. This is expected to contribute towards the improvement of incomes by raising farm productivity with increment in the share of agricultural production that is marketed and creating more on-farm and off-farm employment opportunities.
4. Study Objectives
- The aims and objectives of this thesis and the study are to demonstrate that Trade liberalization has its policies and can explain some of the managerial standards of natural resources. A brief background will be helpful in explaining the importance and motivation of the study, and the resources like coffee, fish, cotton etc. (Ogutu-ohwayo, n.d.) That led to this novel inquiry into the trade development of Uganda's economic importance of Natural resources providing a qualitative/theoretical analysis of Trade liberalization and management of natural resources. Analyzing Uganda's policies on the Agricultural sector through importation and exportation of commodities. Provide a suitable policy option from the Ugandan Government on the environment impact in Agriculture. Analyzing of Main trading partners of Uganda's Agricultural products through World Bank, EAC, COMESA, ECOWAS and many other world's main trading companies through IMF (Okedi, 1970).
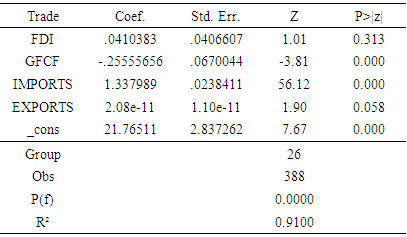
5. Methodology
- In the model as specified below the equation total agriculture investment of African countries is checked by applying Variable methods. Panel data of different sequence are conducted to check agriculture products and analysis in the country.
 | (1) |
 | (2) |
 | (3) |
 | (4) |
|
|
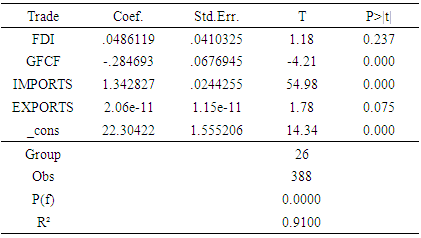
6. Conclusions
- As part of the study, empirically analyzed the effect of foreign direct investment on the economic growth of the many country member states between 1993 and 2017. The main objective of the paper was to verify the effects of FDI on Agriculture and economic growth due to liberalization. To do this, a number of random effects and fixed effects with different methods and tests were done. Which allows obtaining these different results for the many African countries. These results show us that FDI has a negative effect on the entire sample. Therefore, rejecting our hypothesis that FDI has a positive effect on the entire sample and maintains the alternative hypothesis. However, while observing other results in recent years, these show that FDI has had positive effects on the economic growth of most African countries.In recent years, the relationship between FDI and economic growth in the region is positive. It is through FDI that the holders of modern technology transfer modern technology to countries that do not have it. According to the results of different tests, variables such as gross fixed capital formation, production and openings are all positive and significant. When these variables have a potential impact on economic growth, governments realize that FDI can contribute to economic development and the need to attract it. The global market for this type of investment is highly competitive and developing countries in particular want this type of investment to accelerate their development efforts.Economic determinants are nonetheless crucial. As a source of investment capital, FDI stimulates employment and it is perceived as a means for African countries to acquire advanced technologies, new management methods and access to developed countries' markets. Following the many social and economic concerns of African states, most countries have sought to find a solution to their concerns.These concerns included youth unemployment, the high poverty rate and the crucial lack of technology which as a remedy to these problems at high levels, most countries called on the IMF and the World Bank to facilitate the entry of FDI that is likely to play an important role in economic development.The liberalization of Agriculture and economic value has led African countries to privatize most state-owned enterprises, introduce some measures that can promote the attraction of FDI in other forms such as tax exemptions to promote FDI. Since all countries have opened up their savings, there is likely to be an increase in FDI inflows from different countries. The IMF and World Bank program of privatizing public enterprises as one of the preconditions for attracting foreign direct investment into developing countries has failed and has often created new challenges for these developing countries.
|
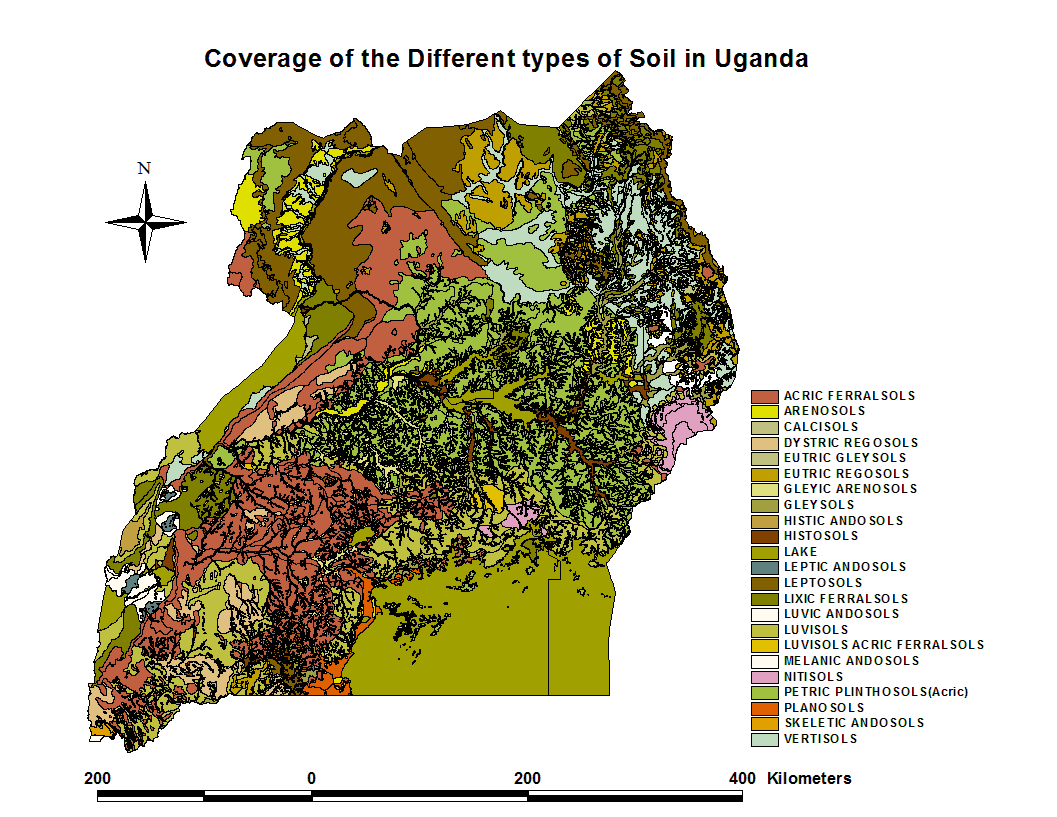 | Map 1. Uganda Map showing Agricultural fertile soils |
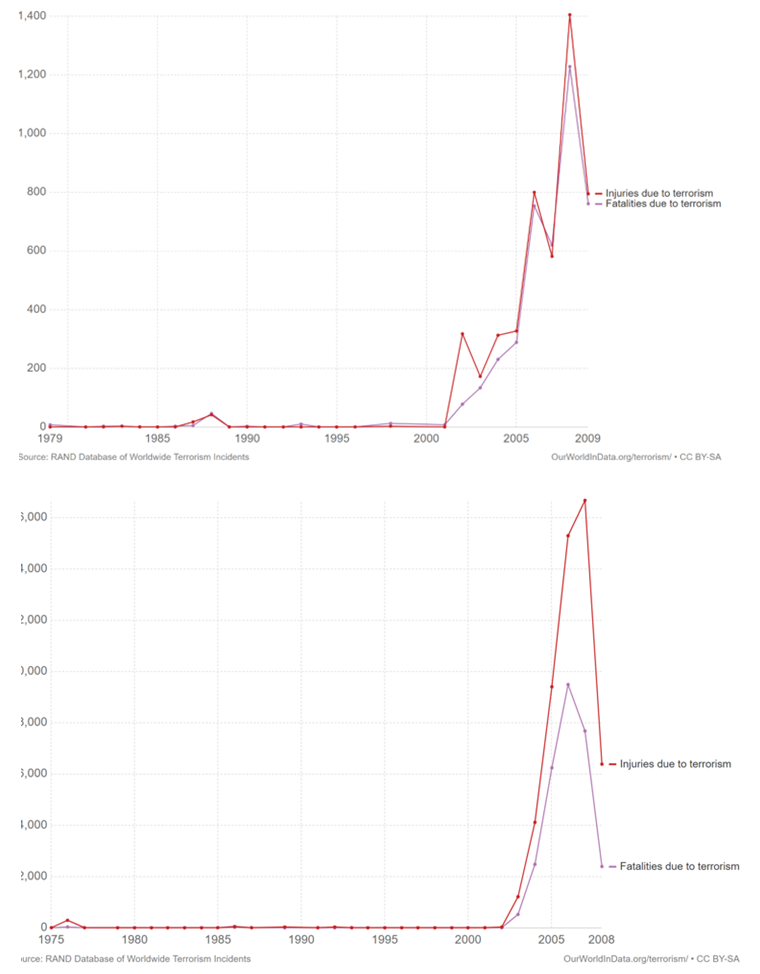 | Map 2 |