-
Paper Information
- Next Paper
- Paper Submission
-
Journal Information
- About This Journal
- Editorial Board
- Current Issue
- Archive
- Author Guidelines
- Contact Us
American Journal of Economics
p-ISSN: 2166-4951 e-ISSN: 2166-496X
2019; 9(3): 118-127
doi:10.5923/j.economics.20190903.04

The Determinants of Chinese OFDI Flow to Africa: Dynamic Panel Data Modelling with LSDV
 Abstract
 Reference
 Full-Text PDF
 Full-text HTML
Onesmo Stephen Chawala
School of Economics, Shanghai University, Shanghai, China
Correspondence to: Onesmo Stephen Chawala, School of Economics, Shanghai University, Shanghai, China.
| Email: |  |
Copyright © 2019 The Author(s). Published by Scientific & Academic Publishing.
This work is licensed under the Creative Commons Attribution International License (CC BY).
http://creativecommons.org/licenses/by/4.0/

This study sought to investigate the determinants of Chinese OFDI flow to African countries. We conducted panel data analysis for 36 countries covering the period between 2003 and 2017. We began by running a static Fixed Effects (FE) model and ended up with a dynamic model that was estimated using Least Squares Dummy Variables. It was found that, the Chinese OFDI flow to Africa are mainly due to natural resources, market size, agglomeration economies, infrastructure and Chinese FDI received in the past year. Also, it was found out that, host country institutional quality (especially control of Corruption and rule of law), economic instability (inflation) and trade openness have no influence on Chinese OFDI flow to Africa. Finally we provided policy recommendations for African governments.
Keywords: Africa, Chinese OFDI, Dynamic panel data model
Cite this paper: Onesmo Stephen Chawala, The Determinants of Chinese OFDI Flow to Africa: Dynamic Panel Data Modelling with LSDV, American Journal of Economics, Vol. 9 No. 3, 2019, pp. 118-127. doi: 10.5923/j.economics.20190903.04.
Article Outline
1. Introduction
- Historically the People’s Republic of China has not been investing overseas. However, in the last two decades China’s phenomenal growth rate of her economy has made the country rise to the world leadership status, and expansion of her investment to different parts of the world including Africa [1]. China’s Outward FDI was zero by the time it began to open up her economy in 1978, but she has been attracting FDI from practically the rest of the world to become among the most successful FDI destinations in the world by early 1990s. The country’s annual FDI outflow grew from virtually zero in 1979 to US$ 628 million in 1985, and to US$913 in 1991 and shot up to 4 billion in 1992 when their prominent leader, Deng Xiaoping, reaffirmed China’s commitment to its reform and open-door policy [2].By the end of 1996 China’s outward FDI stock was over US$ 18 billion, surpassing that of South Korea (US$ 13.8 billion) and Brazil (US$7.4 billion). However, from the late 1990s there has been a significant shift of this trend, a number of Chinese companies internationalized and began to invest abroad. For example, in 2010 investors looking for overseas deals and based in China and Hong Kong accounted for a tenth of global value, including take overs such as Zhejiang Geely Holding Group’s purchase of Ford Motors Volvo unit (Salidjanova, 2015). By 2014, China spearheaded the BRICS Development Bank, The Asia Infrastructure Investment Bank (AIIB) and the Silk Road Fund, entailing China’s growing influence in development finance [4]. According to China’s Ministry of commerce [5] China’s outward Foreign Direct Investment is largely concentrated in other Asian countries (particularly Hongkong) and, recently, investment has remarkably increased in Latin America and Africa. For the purpose of this study Chinese OFDI flow to Africa will be analyzed.
2. Brief Literature Review
- China’s increased interest to invest in Africa has increased so much in the recent years. As supported by literature, since China began to invest abroad, the major motive was natural-resource seeking following the country’s remarkable economic growth in the past decade (OECD, 2008). The economic growth has been so intensive, requiring huge amounts of natural resources including land, forest, water and oil. Although China is well endowed with natural resources her natural resource per capita is very low, hence the government has explicitly identified natural resource acquisition as a key strategic objective of internationalization and even offer direct state aid towards this motive [7]. Another important motive of going to invest in Africa is Market-seeking. Although some scholars have indicated resource seeking as China’s main interest to invest in Africa, with China’s energy sector state-owned enterprises taking the lead, the desire to benefit from commercial opportunities by the expanding trade into African large markets plays an important role as the determinant of Chinese OFDI [8]. Between 1980s and 1990s the market-seeking motive is said to have been dominated by a support function of Chinese domestic enterprises as OFDIs were designed to help Chinese firms familiarize themselves with international market behavior and requirements and facilitate exports of their domestic firms [9], [10].The need for natural resources cannot be overemphasized for Chinese MNEs going global, especially to Africa. Although China features as one of the major oil producers, it can produce less than half its domestic needs for oil [8]. This is coupled with the increased demand for aluminum, copper, nickel, iron ore, timber and other commodities [11]. On the other hand, Africa is well endowed with natural resources, possessing about 7.8 percent of the known global oil reserves as of 2012 [12].The China-SSA trade composition, for example, shows that SSA imports a wide variety of consumer and capital goods, while overwhelmingly exporting primary commodities, especially oil, minerals, and other natural resources [13]. All these have made China hold a high position in the Africa’s resource sector [8].The aspect of efficiency-seeking poses some doubtful justification. Chinese OFDI flow to Africa is not motivated by efficiency-seeking through cost reduction, since most Chinese companies have cost advantages in China. Also, should the cost increase along the coast areas, they could as well relocate to the hinterland [14].Furthermore, the strategic asset-seeking poses a weaker reason for the Chinese OFDI flow to Africa. Literature shows that, for about a decade or so, some Chinese companies have sought to gain a greater edge through acquisition of strategic assets such as branding, marketing know-how, and managerial competences. In most cases, this is well justified in their motives to go the developed markets as they seek internationally recognized trade marks [15]. The empirical literature offers little evidence on this as far as the Chinese motives of going to Africa are concerned.
3. Methodology
- In this study we used the panel data model. This is because panel datasets have considerable benefits over simple cross-section or time-series data as they can give more accurate inference of model parameters. Panel data usually contain more degrees of freedom and more sample variability than cross-sectional data. Also, panel data has greater capacity for capturing the complexity of human behavior than a single cross-section or time-series data. The other advantage of panel data is that they allow for the formulation of more complex hypotheses than would otherwise be in the case of only time series, or cross-sectional analysis [16].
3.1. Data Sources
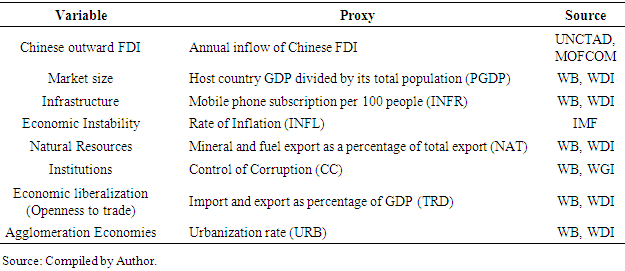
- The annual data on Chinese Outward FDI flow to Africa shall be used covering the period between 2003 and 2017. All Data for this study shall be secondary data from various credible sources including World Bank Development Indicators (2018), the China’s Ministry of Commerce (MOFCOM); World Statistics Year Book, UNCTAD, WTO, IMF and some specific information was obtained in some respective countries’ credible sources of data.
|
3.2. Econometric Model Specification
- In this study we estimated Chinese Outward FDI flow to African countries in terms of GDP per capita, mobile phone subscription per 100 people, inflation rate, openness to trade (imports and exports as a percentage of GDP), Natural resources, Institutional Quality and urbanization. We used annual time series data for 36 countries in Africa.The independent variables were chosen based on the conventional theory of FDI. The variables cover the theory of FDI as consisting of market size, infrastructure, economic environment, labor market, economic policy, international economic relationships and political stability. We took the Chinese outward FDI flow to Africa covering the period from 2003 to 2017.In this study we estimated a static model (FE) that was based on the following equation:
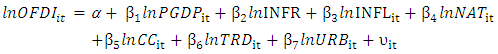 | (1) |
3.3. The Dynamic Panel Data Model
- In this section the FDI model (1) will further be re-specified as a dynamic panel data model that was subsequently estimated using the annual data on Chinese outward FDI flow from 2003 through 2017 for the 36 selected African countries. The lagged dependent variable was included on the right hand side of the equation together with the other independent variables. We used the Least Squares Dummy Variables to estimate the dynamic panel data model which is as specified in equation 2 below:
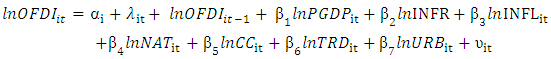 | (2) |
 is the residual term for country i at time t. All the variables in the model were transformed into logarithmic form because conventionally FDI, as a flow variable, is modeled by gravity model which is usually specified as double log model.
 3.4. Methods of Analysis
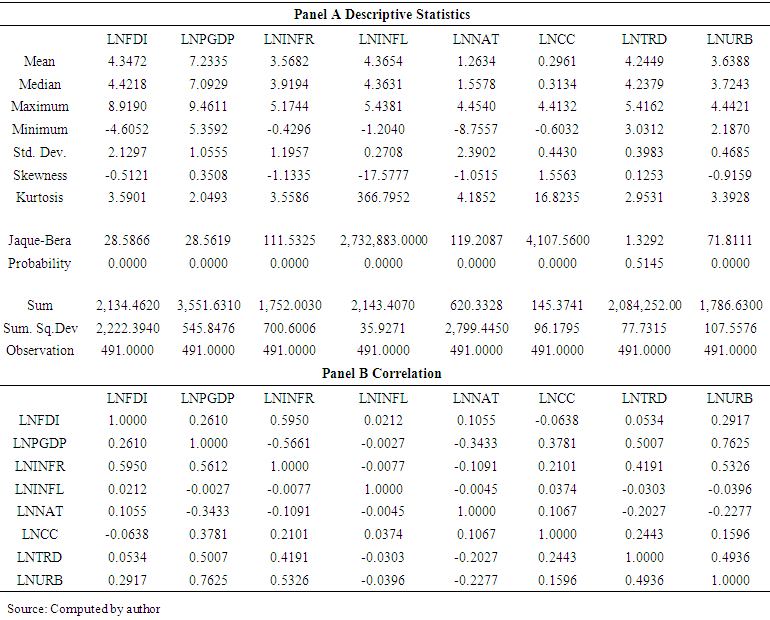
- The preliminary analysis involved examining the descriptive statistics of all the variables included in the model. The results of descriptive statistics are presented in table 2. The descriptive statistics bears a summary of the mean, median, standard deviation, skewness, kurtosis and the distribution of the series. The preliminary analysis provided a foundation from which we could proceed with the detailed analysis using econometric regression models. Econometric analysis was the main approach that was used to identify the variables that were significant as determinants of Chinese outward FDI flow to Africa. In carrying out panel data regression, a couple of models was used, namely, the static panel data model, and the dynamic panel data model.
 | Table 2. Descriptive Statistics |
4. Results and Discussions
4.1. Descriptive Statistics
- Descriptive statistics serves the purpose of describing or summarizing data in a quick and meaningful way. It allows a simpler interpretation of the data as it clearly shows the distribution or spread of the data. However, descriptive statistics could not be used to draw conclusions beyond the analyzed data. Therefore, the descriptive statistics provided descriptive information regarding outward Chinese FDI, market size (GDP per capita) of the selected host countries for the Chinese FDI, Infrastructure (mobile cellular subscription rate per 100 persons), Economic instability (inflation rate), Economic liberalization (openness to trade), Institutional quality (control of Corruption), natural resources, and urbanization. The values used were mean, standard deviation, minimum and maximum as well as the number of observations for each variable. A summary of descriptive statistics is presented in table 2.The results in panel A (Table 2) show that natural resources was the most volatile variable with a standard deviation of 2.39, followed by the Chinese OFDI, infrastructure, market size (PGDP), Urbanization, Corruption Control, Openness to trade, and inflation respectively.The other important set of interest is skewness and kurtosis, as well as Jaque-bera test for normality of the variables. These show that our data are not normally distributed. This information is important since it depicts a quick picture of the characteristics of the variables that were analyzed in the study.Panel B of the descriptive statistics (table 2) shows the degree of correlation of the variables. As it is depicted there is positive correlation between Chinese OFDI and most of the independent variables. Only control of corruption shows a negative correlation with Chinese OFDI. However, although this information gives a good preliminary analysis about the interaction of our variables, we cannot ascertain any causation at this level since correlation does not necessarily imply causation.
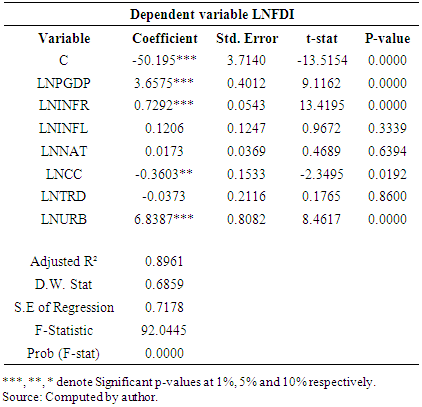
4.2. The Static Model
- In our analysis we first had to choose between random effects and fixed effects model as our statistic model for analysis. As explained in the methodology section, the fixed effects model seeks to establish the hypothesis that there are constant individual effects over time, while random affects model is based on the assumption that the individual effects are determined at random. In order to ascertain which of the two models was appropriate we had to conduct the Hausman test [17]. Therefore the null hypothesis was that the individual effects are not correlated with the other repressors in our model; otherwise (if they are correlated with the explanatory variables) the random effects will produce biased estimates, hence a fixed effects model would be preferred [18]. The Hausman Test results are presented in table 3.
|
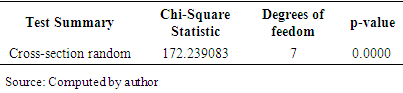
|
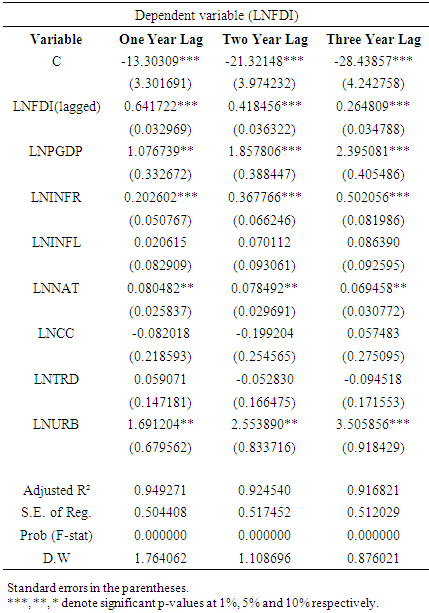
4.3. Dynamic Panel Data Model Regression Results
- The results for the dynamic panel data model when FDI is lagged by one; two and three years respectively are presented in table 5. When we compared the Durbin Watson statistics of the three models, the most preferred model was found to be the one whose dependent variable was lagged by one year as an independent variable. When Chinese OFDI was lagged by one year, the D.W= 1.76. Since the D.W value of this model was closer to 2 compared to the other two models, we therefore concluded that this model suffers the least from serial correlation. In addition, in the one year lagged model, the adjusted R squared was the highest (about 95 percent) and the standard error of the regression was 0.50.
|
5. Discussions
- The main purpose of this study was to investigate the factors that determine Chinese OFDI flow to African countries. After estimating the unlagged model and finding the presence of serial correlation, we estimated three different dynamic panel data models from which we found the one year lagged model to be the best model for our study.The dynamic panel data model contained Chinese FDI (one year lag) as one of the explanatory variables. Other explanatory variables that were included in the model are natural resources, market size (proxied by GDP per capita), infrastructure (proxied by mobile phone subscription per 100 people), economic stability (proxied by inflation), institutions (control of corruption), economic liberalization (openness to trade), and agglomeration economies (proxied by urbanization).Based on theoretical knowledge as well as empirical literature, resource-seeking MNEs tend to flock to countries where there is abundance of natural resources. In this study we used “minerals and fuel export as percentage of total export” as the proxy for natural resources in accordance with the UNCTAD’s approach. The dynamic panel data model results show that, as expected in our study hypothesis, there is a positive and significant relationship between availability of natural resources in African countries and the Chinese OFDI flow to the African countries. Specifically, a one percent increase in African natural resources leads to an increase in Chinese OFDI flow to the countries by 0.08 percent (significant at one percent). Therefore, there is a compelling reason to assert that natural resources positively and significantly affect Chinese OFDI flow to African countries. As noted earlier, China’s surge of industrial production goes in tandem with the increased demand for natural resources (energy, minerals, timber, and much more) and it produces less natural resources than what it actually requires domestically [6], [8]. In the interim, as per 2012 statistics, Africa possesses about 7.8 percent of the known global oil reserves as well as vast deposits of minerals and renewable natural resources [11], [12]. So Africa has become a good destination for Chinese OFDI flow to tap the highly demanded natural resources for their home-based manufacturing industries. In 2012, for example, natural resources accounted for about 66 percent of Africa’s export to China; China has become the biggest developing country investor in Africa [20].These findings are consistent with the findings obtained by many scholars who carried out econometric analyses on the determinants of Chinese OFDI flow to Africa [21], [23]. On the contrary, the research that was carried out by such earlier scholars as Yin-Wong Cheung and Xing Wang Qian found no substantial evidence that China invests in African and other oil-producing countries mainly for their natural resources [24]. Bringing it all together, the study findings are in agreement with the majority of scholars than the contrary. Furthermore, these findings support the conventional Heckscher-Ohlin trade theory whereby Africa highly exports natural resources where it has a comparative advantage, and in turn it imports the labor intensive manufactured goods from China. In addition, having been armed with both theoretical and empirical literature in regard to market size, we expected that the results of this study would find a positive and significant relationship between market size (GDP per capita) and Chinese FDI flow to African countries. Consequently, as expected, our study findings support the hypothesis that market size positively and significantly affects Chinese OFDI flow to African countries. According to the dynamic panel data model results, a one percent increase in market size (GDP per capita) of the African countries will lead to an increase in Chinese OFDI flow to these countries by 1.08 percent (significant at one percent). Chinese OFDI flow to Africa is influenced by the economic growth of these countries that is why there is increasing Chinese OFDI flow even in resource-poor African countries. For example, Ethiopia which is considered resource-poor, but has an average GDP growth above the continent’s average has experienced a surge of Chinese OFDI flow in recent years. This is also pertinent when one attempts to compare the amount of Chinese OFDI against GDP per capita among the African countries. It is evident that South Africa which had the highest GDP per capita (7583.59 US Dollars) had the highest inflow of Chinese FDI (5954.02 million US Dollars). The findings that market size influences positively the Chinese OFDI flow to African countries are in line with the findings of a similar study that was conducted in Africa [23]. Quintessentially, the findings are in accordance with the market-seeking FDI theory as well as the empirical studies on the locational determinants of FDI [25], [26]. In regard to infrastructure, theoretical literature shows that, infrastructure facilities have a positive influence on foreign direct investment. In testing for this variable we took mobile phone subscription per 100 people as a proxy for infrastructure. According to the dynamic panel data results it was found that infrastructure has a positive and significant relationship with Chinese OFDI flow to the African host countries. This implies that when infrastructure improves, the amount of Chinese OFDI flow into the African countries will increase. Specifically, as depicted in the dynamic panel data model estimation results, a one percent increase in the level of infrastructure leads to about 0.20 percent increase in Chinese OFDI flow to the African countries. These results support the hypothesis that infrastructure facilities affect positively Chinese OFDI flow to African countries. This is due to the fact that countries which have infrastructure facilities are considered to be in a better position to make it easier for investors to do business hence maximizing their returns on investments. Meanwhile, Chinese OFDI flow to Africa is also found in the large scale infrastructure projects. This implies that the ongoing infrastructure projects also play an important role in attracting Chinese OFDI to Africa; in most cases, they are the ones who win and implement such mega projects on the continent. For example, in January, 2015, China entered a Memorandum of Understanding (MOU) with the African Union (AU) to construct and improve road, rail and air transportation links in Africa [27].The findings that infrastructure facilities influence Chinese OFDI flow to Africa are similar to the findings that were obtained by some previous scholars [28], [30]. However, these findings are contrary to findings by Onyiewu and Shrestha who found that the relationship between infrastructure and FDI for Sub Sahara African countries is insignificant [31].Furthermore, economic theory posits that economic stability attracts FDI since Multinational enterprises tend to invest in countries which have stable economic systems. For this study we used inflation as a proxy for economic stability since high inflation reflects economic instability of the host country. High inflation rates tend to distort economic activities and affect profitability as higher prices can lead to increased costs and lower profits hence discouraging market-seeking FDI inflow to a host country. The study findings showed that, inflation had positive relationship with Chinese FDI flow to African countries. These findings are against the economic theory; however, the relationship between inflation and Chinese OFDI flow to African countries, according to the study findings, was not significant. More so, Quality of Institutions is an important determinant of FDI flow to a host country [32]. Multinational companies prefer investing in countries with high institutional quality; hence host countries whose institutions practice good governance tend to attract more FDI. Also, a stable legal system and low corruption have a positive effect on FDI flows into a country [33]. In this study we used control of corruption as a proxy for institutional quality in African countries. The study findings show that control of corruption has a negative relationship with inflow of Chinese FDI to the African countries; hence do not support the hypothesis that, Control of Corruption positively and significantly affects Chinese OFDI flow to African countries. A one percent increase in the level of corruption control in African countries leads to about 0.08 percent decrease in Chinese OFDI flow to these countries. This finding is contrary to the findings by some earlier scholars [32], [34], [36]. However, the relationship between control of corruption and Chinese OFDI in Africa, according to the study, is not significant.Furthermore, there are some empirical studies which obtained somewhat similar results to our stated hypothesis as they found out that, Control of corruption deters Chinese FDI flow to the African countries [33], [37], [39]. Similarly, a study that covered MENA countries found, among other factors, that Chinese OFDI in Africa is attracted by poor governance [40], [41]. It is important, however, to reiterate that the study found insignificant results between control of corruption and Chinese OFDI flow to Africa.In regard to economic liberalization, the findings do not support the hypothesis that openness to trade positively and significantly affects Chinese OFDI flow to African countries. Particularly, as the results indicate, a one percent rise in trade openness for the African countries leads to 0.59 percent increase in Chinese FDI. This could be the result of trade liberalization policies adopted by many African countries, especially after 1980s following the conditions from the World Bank and IMF Stuructural Adjustment Programs (SAPs). However, the relationship, according to the study, is not significant.These results are also inconsistent with the findings of some earlier studies on host country determinants of Chinese OFDI [42]. This is particularly true for the vertical (or export-oriented) FDI and do not support the evidence of earlier studies on the determinants of FDI in developing countries generally [29], [43], [45]. Furthermore, economic theory expounds that, agglomeration economies are an important location determinant for outward FDI. Empirical Literature shows a strong evidence of positive spillovers between firms as a result of agglomeration economies. Ideally, investors prefer to locate their businesses in spatially defined locations since such areas attract and facilitate them and other entrepreneurs as well as skilled labor and other resources that can take advantage of the opportunities that other entrepreneurs create [46], [47]. This is particularly true in cases where agglomeration is accompanied by absence of entry barrier and a great deal of enterprise diversification and industrial clusters [48]. It is also noteworthy that agglomeration diseconomies may result if the degree of agglomeration is too high [49].In this study we have used two aspects to explain agglomeration economies, namely, lagged Chinese OFDI and urbanization rate. Both lagged Chinese FDI and urbanization rate have positive and significant relationship with the current Chinese OFDI flow to Africa. As shown from the dynamic panel data results (table 5), a one percent increase in agglomeration economies (proxied by urbanization) leads to an increase in Chinese OFDI flow to Africa by about 1.69 percent (significant at five percent). In the interim, a one percent rise in Chinese OFDI flow to Africa a year ago, leads to about 0.64 percent increase in Chinese OFDI to African countries in the current year.Therefore, our study findings support the hypothesis that, agglomeration economies positively and significantly affect Chinese OFDI in African countries. These empirical findings are consistent with the findings obtained by an earlier study which demonstrated a positive and significant relationship between domestic investment and the urbanization rate; when the latter associated with the creation of urban clusters, transport corridors and the necessary infrastructure tend to attract FDI in Africa [42], [50], [51]. Furthermore, a bunch of scholars argue that the implications of including lagged FDI stock generates positive feedback, and externalities so that further investments would be self-reinforced; also it is associated with an adjustment process; and helps to calculate unobservable equilibrium stock [51]. Arguably, the practice of the Chinese investors going to invest in locations where other Chinese investors are already there helps them to adjust with the liability of foreignness. In order to test robustness of the model, we first added population and found the same results. In another development we removed the variable “inflation” since some countries (especially Zimbabwe), had hyper inflation but the results did not change. Also when control of corruption was replaced with rule of law (as proxy for institutional quality) the results were still the same. While the main results are parsimoniously reported in the text, the robust results are presented in the appendix section.
6. Conclusions and Policy Implications
- This study aimed at analyzing the determinants of Chinese OFDI flow to African countries. The static regression model was an important part of the initial analysis of the empirical results. The main findings, however, were based on the dynamic panel data model.According to the results, the determinants of Chinese OFDI flow to African countries are mainly natural resources, market size, agglomeration economies (urbanization as well as previous Chinese OFDI), as well as infrastructure. On the other hand, economic instability (Inflation) and openness to trade do not have a significant influence on Chinese OFDI flow to Africa.In addition, there is a bidirectional relationship running between Chinese OFDI flow and market size (that is, GDP per capita). Also, a bidirectional relationship was apparent between Chinese OFDI and urbanization. This, in economic theory, is characteristic of market-seeking FDI. On the other hand, there was unidirectional relationship running from infrastructure, and natural resources to Chinese OFDI flow to Africa respectively. No relationship was established for the rest of the independent variables and Chinese OFDI flow to Africa. By and large, FDI was exogenously weak. Furthermore, it was found that Chinese OFDI is composed of both State Owned Enterprises (SOEs) and Privately Owned Enterprises (POEs). While SOEs are mainly investing in such mega projects as energy and resource extraction the POEs are mainly targeted at the manufacturing, real estate and construction, as well as service sectors in Africa. Also, while the resource-seeking Chinese OFDI flock to resource-rich African countries; their market-seeking counterparts mainly flow to the African countries which have relatively bigger market size (higher GDP per capita).Finally there are some policy implications that result from our study findings. To begin with, since one of the motives of Chinese OFDI flow to Africa is natural resource-seeking, it is evident that Africa receives huge sums of money from China as a result of natural resource extraction and exporting. The receipts from this area should carefully be channeled to development projects and improve their (African) economies so as to avoid the so called “Dutch Disease” that would lead to the paradox that “natural resources are a curse to Africa” [52]. The African countries should formulate good policies to ensure sustainable natural resource harvesting (both exhaustible and non-exhaustible resources) so as to realize not only short-term benefits, but rather the long term economic benefits to carter for the present and future generations. Having examined the past Chinese OFDI flow to Africa it can be recommended that, the African countries should currently continue to attract Chinese FDI since doing so, sets a better ground for more Chinese OFDI to flow to these countries in future. Apparently, this shall result from, and in turn, lead to, agglomeration economies. In addition, macroeconomic policies geared at increasing economic growth, in terms of GDP per capita, should be encouraged. Increase in GDP per capita entails growth of the domestic market size, which in turn, attracts market-seeking Chinese OFDI flow to these countries. Furthermore, African countries should continue to construct and improve their infrastructure since doing so shall attract Chinese OFDI flow to these countries. Presence of physical and service infrastructure facilitates foreign direct investment generally. Also, it has been found that Chinese OFDI flow to Africa is influenced by the ongoing infrastructure projects including railroads, telecommunication, airports, sea ports, dams and water projects going on in these countries.Since most Chinese OFDI is resource-seeking and market-seeking, African policy makers should create sound policies that shall attract efficiency seeking FDI as well. So the African country governments should improve the investment climate and formulate good policies that shall attract foreign investors. This could be achieved through improving infrastructure and institutions (as noted earlier), improving education and human resource quality as well as creating Special Economic Zones (SEZ). This should go in tandem with establishing and managing well the Free Trade Zones (FTZ), especially Economic Processing Zones so as to encourage export as well as vertical FDI to flow to the countries in question.