Harlen, Deny Setiawan
Faculty of Economics and Business, University of Riau, Pekanbaru, Indonesia
Copyright © 2019 The Author(s). Published by Scientific & Academic Publishing.
This work is licensed under the Creative Commons Attribution International License (CC BY).
http://creativecommons.org/licenses/by/4.0/

Abstract
Indonesia has entered a period where there are a large number of people of productive age, reducing the dependency ratio. The population of Riau Province in 2016 with unproductive and productive age groups showed that the ratio was 39.64% classified as unproductive age and 60.36% classified as productive age. The purpose of this study is to find out the perspective of productive age groups in competing on the international labor market. The results showed that from the socio-economic respondents, respondents' education was generally financed by parents with the highest composition of income levels, namely Rp. 3,000,001- Rp. 3,500,000, and there was interest from respondents to continue their further education. From the mastery of respondents' information about the international labor market, respondents were still minimal in knowing the opportunities and challenges of the demographic bonus, mastery of foreign languages generally has mastered, and mastery of technology was still not good, from the readiness of universities there was a supportive curriculum, but socialization to work abroad was still little and also cooperation with foreign universities and private institutions abroad is still small.
Keywords:
Productive Age, Demographic Bonus, International Labor Market
Cite this paper: Harlen, Deny Setiawan, Productive Age Perspective Facing Demographic Bonuses in Riau Province, American Journal of Economics, Vol. 9 No. 1, 2019, pp. 23-37. doi: 10.5923/j.economics.20190901.05.
1. Introduction
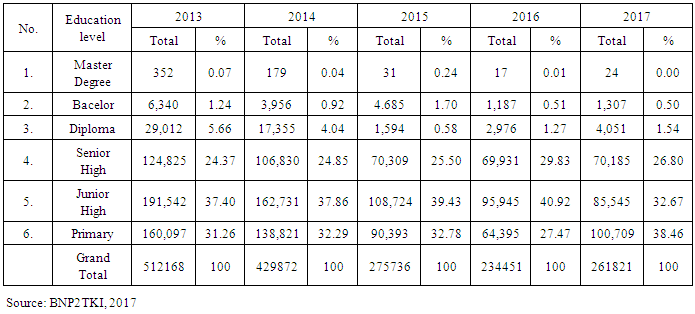
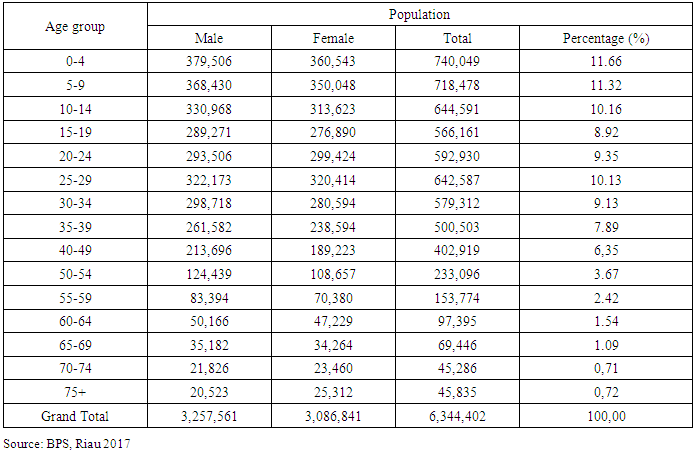
Indonesia in the near future will have a period in which there are a large number of productive age population, thereby reducing the dependency ratio. This period is called the bonus demographic. Demographic bonuses can also be interpreted as conditions in which economic productivity increases rapidly as an impact of the low dependency ratio and the size of the workforce population (Suryahadi et al., 2012).Indonesia has the fourth largest population in the world after China, India and the United States. Results of the 2010 population census, the total population of Indonesia is 238.5 million. Based on the projection of the Central Statistics Agency (BPS), this number is estimated to increase to 305.6 million by 2035. In this projection, the population of Indonesia in the next 24 years is assumed to increase by 28.14% from the calculation in 2010 (Indonesian Population Projection 2010-2035: 24).Can be seen from the educational background of migrant workers who work abroad, they are still dominated by elementary school graduates with a percentage reaching 71%. The rest of the high school level is 27% and higher education institutions, namely diploma, bachelor, and post-graduate are only 2%. The data can be seen below.With the globalization and implementation of the Asean Economic Community/Masyarakat Ekonomi Asean (MEA) which began in 2015 this is an opportunity and challenge for Indonesia to be able to compete with countries in the world, especially ASEAN. The productive workforce is expected to have more skills than other countries so that they have the opportunity to work abroad. They will choose a country that is able to give them higher wages so that their welfare and their families will increase.However, on the other hand, in facing the demographic bonus, there are also a number of challenges, including the limited availability of jobs which will have an impact on increasing unemployment rates, the number of people with low education levels related to the quality of human resources both in education and skills, availability of infrastructure in supporting demographic bonuses, technology that is not yet optimal, management of bureaucracy that is not yet clean, there are still many corrupt behaviors. This condition is all a challenge for the Indonesian nation in facing the demographic bonus of 2020-2030.Based on the age group data in Riau province in 2016, if this age group is grouped again into unproductive age groups, namely the age group 0 to 14 years and 65 years and above and the productive age of the age group 15 to 64 years shows that the ratio is 39, 64% belong to unproductive age and 60.36% belong to productive age. The ratio between the number of productive population and the number of unproductive residents in Riau Province is quite ideal and can be a bonus demographic to support development.Table 1. Placement of Indonesian Workers by Education Level 2013 to 2017
 |
| |
|
Table 2. Population by Riau Province Age and Gender Group in 2015
 |
| |
|
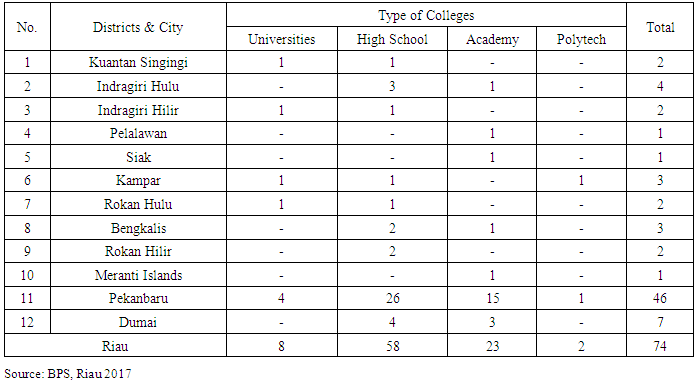
In the table above, the population with the largest age group exceeding 10% is age 0 to 4 years which is equal to 11.66%, followed by the age group 5 to 9 years as much as 11.32%, age groups 10 to 14 years as many as 10, 16% and the age group 25 to 29 years are similar to 10.13%. Furthermore, the age group with a percentage ranging from 5-10% is the age group 15 to 49 years, except for the age group 25 to 29 years.Furthermore, facing the demographic bonus, the Riau Province government and the municipal regency in Riau province are trying to continue to improve the quality of their human resources. This is reflected in the spread of the number of universities in Riau province. The number of universities in Riau province can be seen in the following table.Table 3. Number of Private Universities by Type and District / City in Riau Province, 2016/2017
 |
| |
|
Riau Province has 74 universities spread across districts and cities. Most universities are in Pekanbaru city with 46 universities. With the existence of these educational facilities there are already many educated workforce produced by universities in Riau Province. In addition to the educated workforce above, there are still a lot of workforce, namely uneducated workforce, so that whether they are ready not, Riau Province has entered a demographic bonus.The low level of education of Indonesian workers who work abroad does not escape the role of higher education institutions, namely universities and the desire of the population to pursue higher education, especially the productive age population. Especially in the era of bonus demography, Indonesia has the advantage of increasing the population of productive age.The formulation of the problem in this study is how the perspective of the productive age group of higher education competes on the international labor market. The purpose of this study is to find out the perspective of the productive age group of higher education in competing on the international labor market.
2. Literature Review
Relevant TheoryDemography bonusThe demographic bonus is a condition of changes in the age structure of the population as a result of the demographic transition process, namely a decrease in birth rates and mortality rates. Declining birth rates will cause a decrease in the number of residents aged less than 15 years, followed by the addition of productive age population 15 to 64 years as a result of the many births in the past. While due to improved health status, life expectancy is getting longer, so that the elderly will increase.Adioetomo (2005) said that this bonus demographic would only occur once for all residents of a country, namely the window of opportunity. According to Adioetomo (2012), the demographic bonus is defined as an economic benefit caused by a decrease in the dependency ratio as a result of the process of decreasing long-term fertility and increasing life expectancy. The decline in the proportion of young people reduces the amount of investment costs to meet their needs, so that resources can be diverted to boost economic growth and improve family welfare.Demographic bonuses are economic benefits caused by a decrease in the proportion of young people who reduce the amount of investment costs to meet their needs, so that resources can be diverted to stimulate economic growth and increase family welfare. Economists have long theorized that savings contribute to increased per capita income, because larger investments will trigger higher per capita output. This is evidenced by Lee, Mason, and Miller (2001) in their study using Taiwan household survey data on income, estimation of savings, fertility and mortality.Long-term demographic transition has an impact on:1) increasing the number of workers who if they get productive employment opportunities will increase the total output2) greater accumulation of wealth if there are community savings invested productively, and3) greater availability of human capital if there are investment policies specifically directed at increasing human resource capacity (Bongaarts, 2001; Birdsall and Sinding eds., 2001).Dependency RatioDependency Ratio is a comparison between the number of people aged 0 to 14 years, plus the population of 65 years and over (both are called outside working age) compared to the number of people aged 15 to 64 years (labor). The dependency ratio can be used as an indicator that can roughly show the economic situation of a country whether it is a developed country or a developing country. Dependency ratio is one of the important demographic indicators. The higher percentage of the dependency ratio shows the higher burden that must be borne by productive people to finance the lives of people who are not productive and no longer productive. While the lower percentage of the dependency ratio shows the lower burden borne by productive people to finance the population that is not productive and no longer productive. The growth of the working age population that is more rapid compared to the growth of the young population provides an opportunity to get a demographic bonus. This is realized if there is a positive government policy response at a time when the bonus demographic by providing labor is large enough to increase productivity. Demographic transitions reduce the proportion of young people and increase the proportion of the working age population, and this explains the relationship between population growth and economic growth. The decline in the proportion of young people reduces the amount of investment to meet their needs, so that resources can be diverted to boost economic growth and improve family welfare (Mason, 2001; Ross, 2004).EmploymentHuman resources or often referred to as human resources are the population as a whole. In terms of population as a factor of production, not all residents can act as factors of production, only the population in the form of labor (man power) which can be considered as a factor of production Human resources involve humans who are able to work to provide services or business ventures. Able to work, means being able to carry out activities that have economic value, namely that these activities produce goods or services to meet people's needs. Physically, work ability is measured by age. In other words, people in working age are considered capable of working. The age group is called labor or man power. In short, labor is defined as a population in working age (Simanjuntak, 2005).Theories of Human Resource Economics1) Adam Smith's Classical TheoryAdam Smith (1729-1790) argues, that humans are the main production factor that determines the prosperity of nations. Smith saw that the effective allocation of human resources is the beginner of economic growth.2) Malthus TheoryThomas Robert Malthus (1766-1834) said that humans develop much faster than the production of agricultural products to meet human needs.Workforce StructureBased on Law No. 13 of 2003 concerning employment, what is meant by labor is any person who is capable of doing work to produce goods or services, both to meet their own needs and for the community. The working age population according to the Central Bureau of Statistics (2008) and in accordance with what was suggested by the International Labor Organization (ILO) are people in 15 years old and over who are grouped into the workforce and not the workforce.Labor MarketThe labor market, like other markets in the economy, is controlled by the forces of demand and supply (Mankiw, 2002). The labor market is different from some other markets, because labor demand is a derivative demand. Most labor services, when compared to finished goods that are ready to be enjoyed by consumers, are inputs for producing other goods. The demand for labor comes from the business community. People try themselves or someone else needs and employs. For example, textile companies need workers to oversee weaving machines, shopkeepers need salespeople, and so on. We need to focus on companies that employ labor and use it to produce goods for sale to understand the demand for labor.Research Framework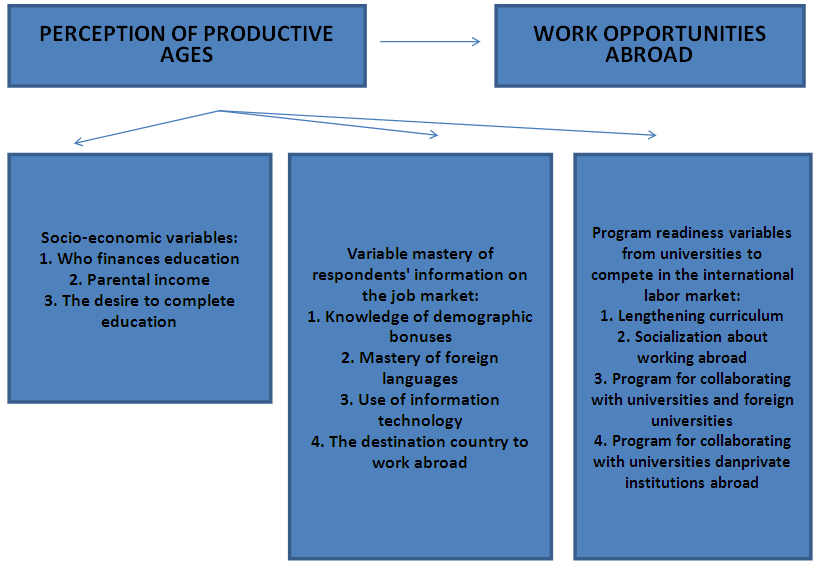 | Figure 1. Framework |
3. Research Methods
This research was carried out in city districts in Riau Province, namely Pekanbaru City, Indragiri Hilir Regency and Rokan Hulu Regency. This research was conducted for 8 months.The technique in sampling in this study was purposive proportional random sampling. Purposive sampling according to Sugiyono is a technique of determining samples with certain considerations (Sugiyono, 2012). The steps for taking the sample subject are done by:1. Determine the research areas, namely Pekanbaru city, Indragiri Hilir Regency and Rokan Hulu Regency with the consideration that the area has universities that have university status, namely Riau University, Riau Islamic University, Syarif Qasim State Islamic University, Lancang Kuning University, Indragiri Islamic University and the Pasir Pengaraian University.2. Determine the subjects to be used as respondents in this study are students in the exact sciences and in the field of social sciences.As for the determination of the number of samples used in this study the Quota Sampling technique. According to Sugiyono (2001), he states that quota sampling is a technique for determining samples from populations that have certain characteristics to the desired number (quota). According to Margono (2004), in this technique the population is not taken into account but is classified into several groups. The sample is taken by giving a certain quorum to the group. Data collection is carried out directly on the sampling unit. After the quota is fulfilled, data collection is stopped.By using quota sampling, researchers determined the number of samples taken was 600 respondents, for Pekanbaru City with the consideration that they have the highest number of university-level universities, the researchers took a sample of 400 respondents with 100 respondents for each university. Furthermore, for the district area a sample of 100 respondents was taken for each selected university with the consideration of representing other regions that had university-level universities. While the types of respondents are divided into two scientific disciplines, namely Exact and Non-exact with the same proportion of respondents so that they are expected to be able to answer the problem and research objectives.Data analysis methodThe analytical method used in this study is a quantitative descriptive method which is data obtained from a sample of the study population analyzed according to the statistical method used. Quantitative descriptive research in this study is intended to map the strengths and weaknesses of the productive age group in Riau Province to compete in the international labor market.
4. Research Results and Discussion
In the Productive Age Perspective Study Facing Demographic Bonuses in Riau Province using a sample of 600 respondents from 6 selected universities from 3 regencies/cities, each university consisted of 100 respondents with a composition of 50 respondents from the field of excellence and 50 respondents from the social sciences. Pekanbaru City is represented by the University of Riau, Riau Islamic University, Sultan Syarif Qasim State Islamic University, Lancang Kuning University. Indragiri Hilir Regency is represented by the Indragiri Islamic University and the Rokan Hulu Regency is represented by the Pasir Pangaraian University. The following describes the characteristics of respondents in general according to gender and age.Characteristics of respondents who were the subjects in this study according to gender can be seen in the following graph: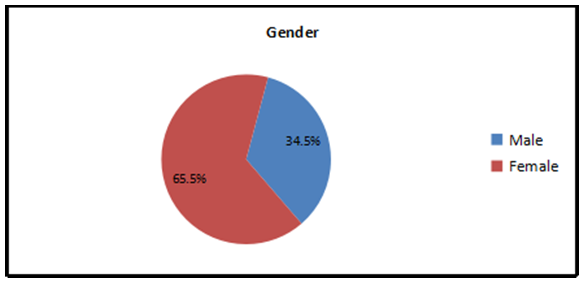 | Figure 2. Characteristics of respondents based on Gender (Source: 2018 processed data) |
From the results of the survey the majority of respondents were women who reached 65.5% while the rest were male as many as 34%.Characteristics of respondents who were the subjects in this study according to age can be seen in the following graph: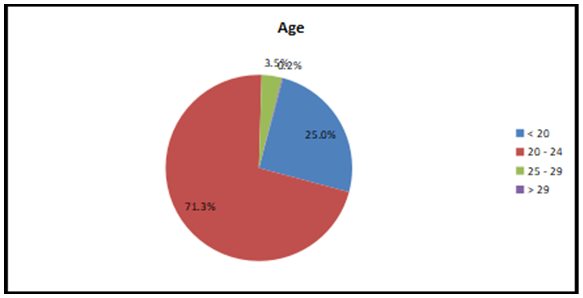 | Figure 3. Characteristics of respondents based on age (Source: Processed Data, 2018) |
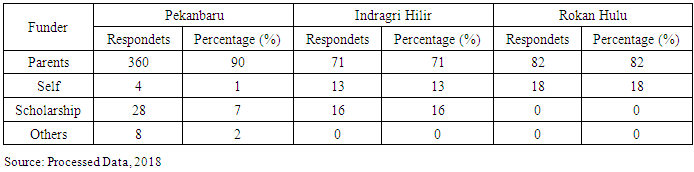
Based on the graph that the number of respondents as respondents is the most at the age of 20-24 years, amounting to 71.3%, then the age of < 20 years as much as 25.0%, age 25-29 years as many as 13.7%, while the least is > 29 years only 0.2%.To explain the results of research on respondents' socio-economic abilities, Mastery of respondents' information on the International Labor Market, and Productive Age Perceptions of Program Readiness from Higher Education in Competing in the International Labor Market the authors explain it based on two sides, based on area and based on Science.By regionRespondents' Socio-Economic CapabilitiesFrom the results of a survey that the author did with active students about who is paying for their current education, it is generally funded by parents, to be more clearly seen in the table below.Table 4. Respondents' Response about Who Is Financing Your Education Today
 |
| |
|
From the table above respondents in Pekanbaru City were financed by their parents as many as 90% of respondents, self-funded as much as 1% of respondents, 7% of respondents and other scholarships there were 2% of respondents, respondents in Rokan Hulu District were funded by parents of 82% and the remaining 18% of respondents he financed. While Indragiri Hilir's parents finance less than the other two regencies/cities as many as 71% of respondents, the rest are funded by scholarships 16% of respondents and themselves finance as much as 13% of respondents.Furthermore, the income of the respondents' parents which can support the social economy of the respondent's family. Below we can see the income of the respondents' parents.Table 5. Respondents' Response about Parents' Income
 |
| |
|
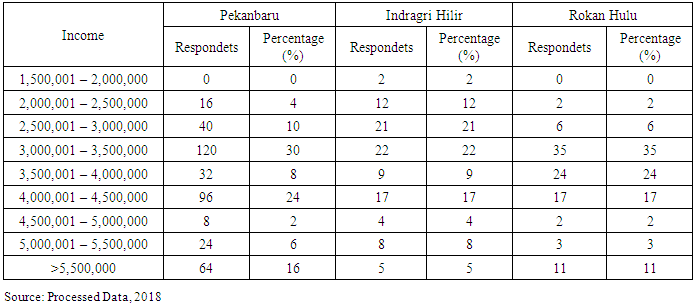
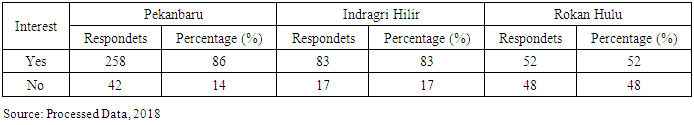
It can be seen from the table above that for Pekanbaru City, from the aspect of parental income, the average family income of the respondents is Rp. 4,413,000,- with a standard deviation of Rp 1,505,056. The highest income of the respondent's family is Rp.11,500,000, and the lowest is Rp. 1,500,000. Composition of income level the parents of the respondents are at the highest level of income of Rp. 3,000,001 - Rp. 3,500,000 which is as much as 30%. income level of Rp. 4,000,001 - Rp. 4,500,000 as much as 24%, income level > 5,500,000 as much as 16% and composition of income level The parents of the smallest respondents is Rp. 4,500,001 - Rp. 5,000,000,- as much as 2%.The income aspect of the respondents' parents in Indragiri Hilir Regency shows that the average family income of the respondents is Rp. 3,834,000, - with a standard deviation of Rp. 1,115,838. The highest income of the respondent's family is Rp.7,500,000, and the lowest is Rp. 2,000,000. Composition of income level the parents of the respondents are at the highest level of income of Rp. 3,000,000 - Rp. 3,500,000 which is as much as 22%. income level of Rp. 2,500,001 - Rp. 3,000,000 as much as 21%, income level of Rp. 4,000,001 - Rp. 4,500,000 as much as 17% and the composition of income level The parents of the smallest respondents are Rp. 1,500,001 - Rp 2,000,000,- as much as 2%.Furthermore, the aspect of the income of the respondents' parents in Rokan Hulu Regency shows that the average family income of the respondents is Rp. 4,161,000,- with a standard deviation of 1,027,785. The highest income of the respondent's family is Rp.7,500,000, and the lowest is Rp. 2,500,000. Composition of income level the parents of the respondents are at the highest level of income of Rp. 3,000,001 - Rp. 3,500,000 which is as much as 35%. income level of Rp. 3,500,001 - Rp. 4,000,000 as much as 24%, the level of income of Rp. 4,000,001 - Rp. 4,500,000 as much as 17% and the composition of income level The parents of the smallest respondents are Rp. 2,000,001 - Rp 2,500,000 and Rp. 4,500,001 - Rp. 5,000,000,- as much as 2%.When there is an offer if a scholarship is given to respondents to continue their education abroad there are some respondents who are not interested even though respondents are generally interested in continuing their education abroad. For more details, can be seen in the following table.Table 6. Respondents' Responses Regarding Interest in Providing Scholarships to Continue Education Abroad
 |
| |
|
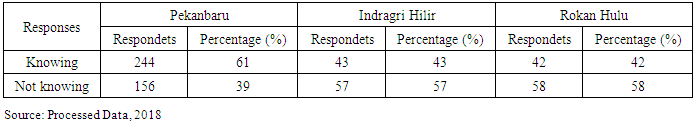
From the table it can be seen that respondents' responses to interest if given scholarships to continue their education abroad in Pekanbaru City were interested in as many as 86% of respondents and those who were not interested as much as 14% of respondents. Furthermore, in Indragiri Hilir district 83% of respondents were interested if they were given a scholarship to continue their education abroad and 17% of respondents were not interested. Lastly in Rokan Hulu 52% of respondents were interested if they were given a scholarship to continue their education abroad and 48% of respondents were not interested, this was more than the previous district/city.Mastery of Respondent's Information on the International Labor MarketWe should first know about international labor market information in order to be able to compete when we have to rivale the international labor market. The indicators are knowledge, language, and technology.Table 7. Respondents' Response About Knowledge of Demographic Bonuses
 |
| |
|
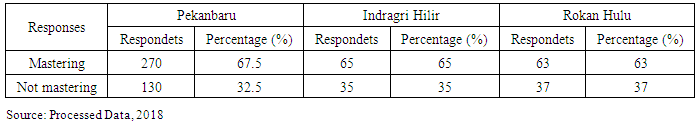
We can see from the table above that in Pekanbaru City respondents who knew the demographic bonus were 61% of respondents and who did not know as much as 39% of respondents. Indragiri Hilir Regency has 43% of respondents who know the demographic bonus and 57% of respondents do not know it. Furthermore, in Rokan Hulu Regency there were 42% of respondents who knew the bonus demographics, the rest did not know the demographic bonus as much as 58% of respondents. Here we see that the majority of respondents did not know the demographic bonus, most of them in Rokan Hulu district, respondents who did not know the term demographic bonus.Language is a means of delivering information both verbal and written. Especially with this era of globalization we must be able to communicate with languages that are commonly used by foreigners to be able to compete. In the following table, respondents generally master foreign languages.Table 8. Respondents' Response About Their Ability To Speak Foreign
 |
| |
|
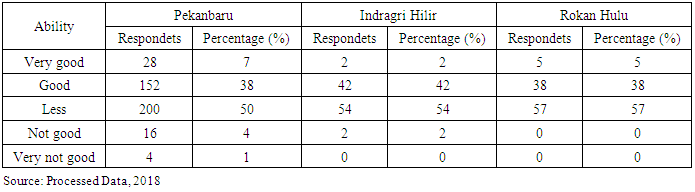
It can be known from the table above that in Pekanbaru City there were 67.5% of respondents who mastered foreign languages and 32.5% of respondents who did not master them. Furthermore, in Indragiri Hilir Regency there were 65% of respondents who mastered foreign languages and 35% of respondents did not master them. In Rokan Hulu Regency there were 63% of respondents who mastered foreign languages, the remaining 37% are did not.Furthermore, how do respondents assess their ability/mastery of Information Technology, from the 3 city districts in general the work ethic is neutral. For more details, we can see the table below.Table 9. Respondents' Response About Mastery of Information Technology
 |
| |
|
Based on the table, Mastery of Information Technology Pekanbaru City respondents as much as 50% of respondents are not good, good as much as 38% of respondents, the rest is very good ability as much as 7% of respondents, not good as much as 4% of respondents and very bad as many as 1% of respondents. Respondents from Indragiri Hilir regency were 54% of respondents were lacking, good as many as 42% of respondents, the rest of the abilities were very good and not good, each of them was 2% of respondents. In Rokan Hulu District, 57% of respondents were lacking, the rest were good as many as 38% of respondents and their abilities were very good as much as 5% of respondents.The reason for respondents choosing foreign countries in general is that respondents choose because of higher salaries. More details, we can see in the table below.Table 10. Respondent's response to the reasons for choosing the country
 |
| |
|
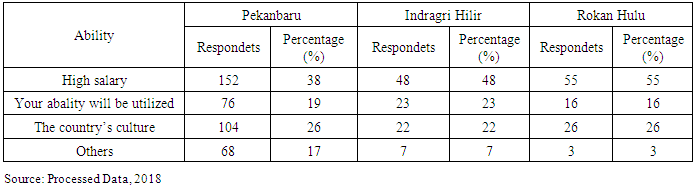
From the table above, the reason for Pekanbaru City respondents choosing foreign countries to work is because of higher salaries, which is as much as 38% of respondents, then because the country's culture is 26% of respondents, 19% of respondents and 17% of respondents are used. Respondents from Indragiri Hilir Regency chose foreign countries to work because of higher salaries, which was as much as 48% of respondents, then because of their ability to use as much as 23% of respondents, the country's culture was 22% of respondents, and 7% of respondents. Respondents from Rokan Hulu Regency chose foreign countries to work because of higher salaries, which was as much as 55% of respondents, then because of the country's culture as much as 26% of respondents, 16% of respondents were used, others were 3% of respondents.Productive Age Perception of Program Readiness from Higher Education in Competing in the International Labor MarketIn the readiness of the program from higher education institutions to compete in the international labor market, the indicators are the existence of a curriculum that supports work abroad, socialization about working abroad by universities, the existence of collaborative programs of universities with foreign universities, and the existence of university cooperation programs your height with private institutions abroad.Table 11. Respondents' Response to the Curriculum Supporting Work Abroad
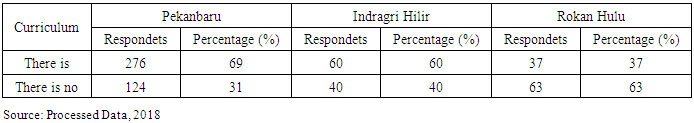 |
| |
|
From the table above we can know that in general there is a curriculum that supports respondents to work abroad. In Pekanbaru City, respondents stated that there was a curriculum that supported respondents to work abroad as much as 69% of respondents, while respondents who stated that there was no curriculum that supported respondents to work abroad were 31% of respondents. In Indragiri Hilir District, respondents stated that there was a curriculum that supported respondents to work abroad as much as 60% of respondents, while respondents who said there was no curriculum that supported respondents to work abroad as much as 40% of respondents. In contrast to the previous two districts, respondents from Rokan Hulu District stated that there were 37% of curriculum subjects who supported respondents to work abroad, while respondents who said there was no curriculum that supported respondents to work abroad were 63% of respondents.Table 12. Respondents' Response about Has Been Held Socialization about Working Abroad by Universities
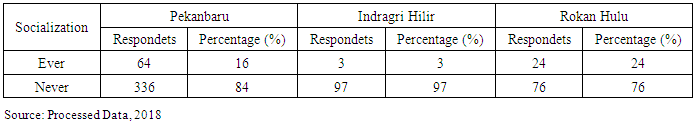 |
| |
|
We can see from the table above that the respondents of Rokan Hulu Regency stated that there was no socialization about working overseas by universities as many as 76 respondents while those who stated there were as many as 24 respondents. The respondents of Pekanbaru City stated that there were no socialization about working overseas by universities as many as 336 respondents while those who stated there were as many as 64 respondents. Respondents from Indragiri Hilir Regency stated that there was no training or socialization about working overseas by tertiary institutions as many as 97 respondents while those who stated there were only 3 respondents.Table 13. Respondents' Response Regarding Is There a College Cooperation Program with Foreign Universities
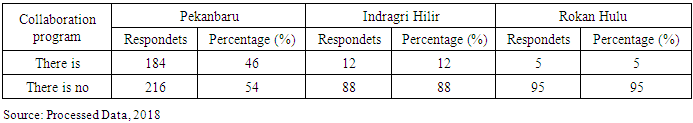 |
| |
|
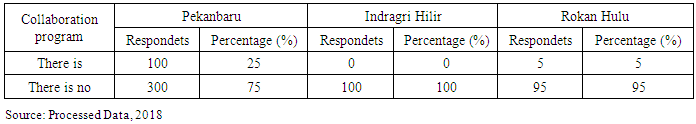
We can see in general that respondents stated that there were no collaborative programs for universities with foreign universities. In Pekanbaru City respondents stated that there were no collaborative programs between universities and foreign universities as much as 54% of respondents who stated that there were 46% of respondents. Furthermore, in Indragiri Hilir regency, respondents stated that there were no collaborative programs for universities with foreign universities as much as 88% of respondents who stated that there were 12% of respondents. The last respondent in Rokan Hulu District stated that there was no collaborative program between universities and foreign universities as many as 95% of respondents who stated that there were only 5% of respondents.Table 14. Respondents' Response about Your College Cooperation Program with Foreign Private Institutions
 |
| |
|
We can see in general that respondents stated that there was no collaborative program between universities and foreign private institutions. In Pekanbaru City, respondents stated that there was no cooperation program of your tertiary institution with foreign private agencies as much as 75% of respondents, while those who stated there were as many as 25% of respondents. Respondents in Rokan Hulu District stated that there were no 95% of respondents in your tertiary cooperation program with private institutions abroad, while 5% of respondents said there were and in Indragiri Hilir Regency, all respondents stated that there is no program of cooperation between your tertiary institutions and foreign private institutions.Based on the field of scienceRespondents' Socio-Economic CapabilitiesFrom the results of a survey that the author did about who financed his current education, it was generally funded by parents, to be more clearly seen in the table below.Table 15. Respondents' Response about Who Is Financing Your Education Today
 |
| |
|
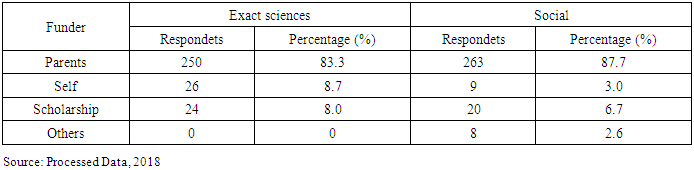
It can be seen from the table above the respondents in the exact sciences, education funded by parents as much as 83.3% of respondents, who finance themselves as much as 8.7% of respondents, and funded scholarships as much as 8.0% of respondents while in the social sciences of the respondents financed by his parents as much as 87.7% of respondents, through scholarships as much as 6.7% of respondents, the rest were funded by themselves as much as 3% of respondents and financed by other others as much as 2.6% of respondents.One factor in the sustainability of respondent's education is how much income their parents pay for their education. The composition of the parents' income level is at most Rp. 1,500,001 - Rp. 2,000,000. for more details can be seen from the following table.Table 16. Respondents 'Response about Parents' Income
 |
| |
|
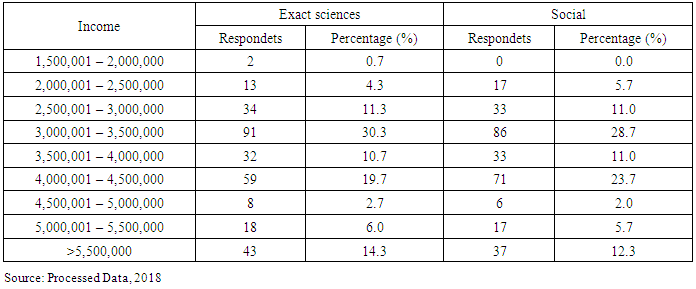
From the table above, it can be seen that for the exact sciences in terms of parental income, it can be seen that the average family income of the respondents is Rp. 4,338,000,- with a standard deviation of 1,558,199. The highest income of the respondent's family is Rp.11,500,000, and the lowest is Rp. 2,000,000. Composition of income level The parents of the respondents are at the highest level of income of Rp. 3,000,001 - Rp. 3,500,000 which is as much as 30.3%. income level of Rp. 4,000,001 - Rp. 4,500,000 as much as 19.7%, and the composition of the income level The parents of the smallest respondents were Rp. 1,500,001 - Rp 2,000,000,- as much as 0.7%.The income aspect of the respondents' parents in the field of social sciences is illustrated that the average family income of the respondents is Rp. 4,211,000,- with a standard deviation of Rp 1,201,495. The highest income of the respondent's family is Rp.8,500,000, and the lowest is Rp. 2,500,000. Composition of income level The parents of the respondents are at the highest level of income of Rp. 3,000,0001 - Rp. 3,500,000 which is 28.7%. income level of Rp. 4,000,001 - Rp. 4,500,000 as much as 23.7%, income level of Rp. 3,500,001 - Rp. 4,000,000 and level of income of Rp. 2,500,001 - Rp. 3,000,000 as much as 11.0%.Continuing education abroad requires a large amount of money, then how do you respond if you are given a scholarship? Generally respondents are interested if they are given a scholarship. For more details, we can see in the table below.Table 17. Respondents' Responses Regarding Interest in Providing Scholarships to Continue Education Abroad
 |
| |
|
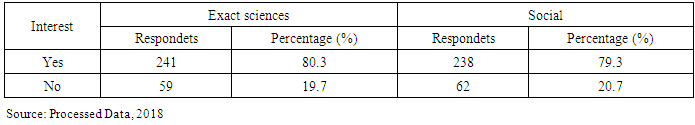
From the table above we can see that in the exact field of science respondents who are interested if given a scholarship to continue their education abroad are 80.3% of respondents and those who are not interested in 19.7% of respondents. Whereas in the social sciences field respondents who are interested if given a scholarship to continue their education abroad as much as 79.3% of respondents and those who are not interested in 20.7% of respondents.Mastery of Respondent Information on International Based Labor MarketThe climate of the international labor market competition is getting tougher and having to face technological developments and the digital world that is happening in the era of industrial revolution 4.0 at this time. We must adjust and even have the ability above the standard.The respondent's knowledge of the term demographic bonus is mostly unknown. We can see the explanation in the table below.Table 18. Respondents' Response about Knowledge of Demographic Bonuses
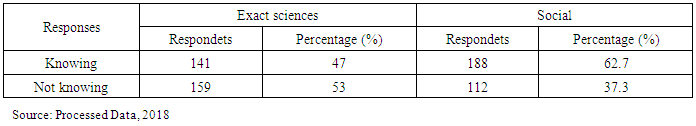 |
| |
|
From the table above we can see that in the exact sciences, respondents who knew the demographic bonus were 47% of respondents and those who did not know as much as 53% of respondents. Whereas in the field of social science that knows more than the exact sciences, there are 62.7% of respondents and 37.3% of respondents do not know the demographic bonus.Language means delivering information both oral and written. Especially with this era of globalization we must be able to communicate with languages that are commonly used by foreigners to be able to compete. In the following table, respondents generally master foreign languages.Table 19. Respondents' Response about Their Ability to Speak Foreign
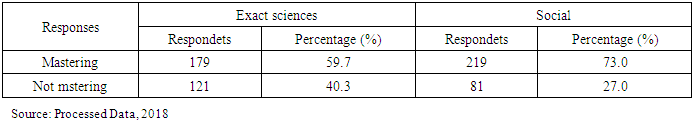 |
| |
|
It can be known from the table above that in the exact field of science respondents who mastered foreign languages were 59.7% of respondents and those who did not master them were 40.3% of respondents. Furthermore, in the social sciences field there were 73.0% of respondents who mastered foreign languages and 27.0% of respondents did not master them.The globalization era, information and technology plays a very important role. Mastering technology and information, means we have enough capital to be a winner in global competition. In the era of globalization, not mastering information technology is synonymous with illiteracy. Mastering respondents in information technology in social sciences is good and neutral, while in exact sciences is neutral. For more details we can see in the table below.Table 20. Respondent's response about his mastery of Information Technology
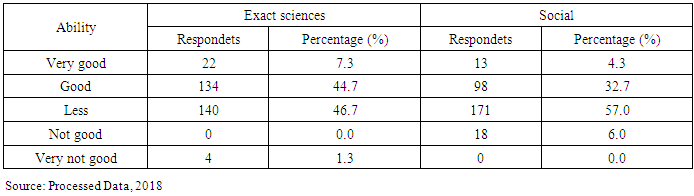 |
| |
|
In the table above, it can be explained that the respondents in the exact field of mastery of information technology in general are less good, namely as many as 46.7% of respondents, have good abilities as much as 44.7% of respondents, very good ability as much as 7.3% of respondents, and very bad as much as 1.3% of respondents. As with the social respondents, in general the mastery of information technology is less good with the number of respondents as much as 57.0% of respondents, have good ability 32.7% of respondents, the rest are very good 4.3 respondents and not good 6.0% of respondents.Working abroad we will find a different ethnicity, religion, race and climate. Of the many countries, which are the favorite countries of respondents from both fields of science in working are Malaysia. For more details, we can see in the following table.Table 21. Respondent's response to the reasons for choosing the country
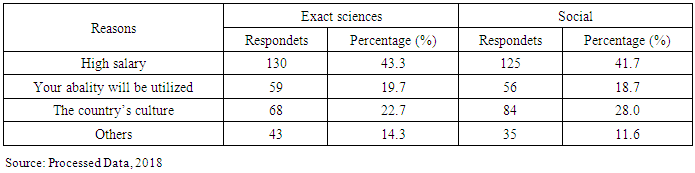 |
| |
|
From the table above, we can see that the reason for the respondents in the exact sciences in choosing their destination countries is mainly because of higher salaries with 43.3% of respondents, the remaining 19.7% of respondents choose the reason for their ability to use, 22.7% of respondents choose reasons for the country's culture, 14.3% of respondents chose for other reasons. Then respondents in the social sciences field chose their destination country generally because of higher salaries with 41.7% of respondents, the remaining 28.0% of respondents chose the reason because of the country's culture, 18.7% of respondents chose the reason because of their ability to be used, 11.6% of respondents chose for other reasons.Productive Age Perception of Program Readiness from Higher Education in Competing in the International Labor MarketHigher education is one of the warehouses to prepare superior and competitive human resources (HR). Therefore the university must prepare programs that support it.The curriculum is one that forms the hard skills and soft students themselves. The role of the curriculum in supporting respondents to work abroad is generally present. A clearer explanation can be seen in the table below.Table 22. Respondents' Responses about Curriculum Supporting Working Abroad
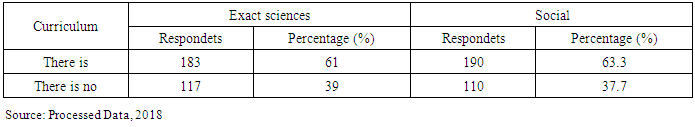 |
| |
|
From the table above, it can be explained that in the exact sciences of respondents who stated that there was a curriculum that supported working abroad as much as 61% of respondents and which stated that there was no curriculum that supported working abroad as much as 39% of respondents. Furthermore, in the social sciences field of respondents who stated that there was a curriculum that supported to work abroad as much as 63.3% of respondents and the rest said that there was no curriculum that supported to work abroad as many as 37.7% of respondents.Socialization needs to be carried out by universities to support knowledge of information on working abroad or skills that need to be prepared. We can see that there are still few respondents who know or participate in socialization working overseas. For more details, we can see in the following table.Table 23. Respondents' Responses Socialization about Working Abroad by Universities That Have Been Held
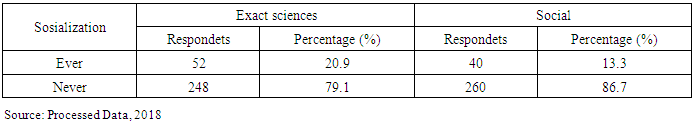 |
| |
|
It can be explained in the table above that in the exact sciences of respondents who stated that there had been socialization about working abroad by universities as much as 20.9 respondents while those who stated that there had never been socialization about the international labor market by universities as much as 79.1% of respondents. In the social sciences field there are even fewer who state that there is socialization about working abroad by universities which is as much as 13.3% of respondents while those who stated that there was no socialization about working abroad by universities were 86.7% of respondents.More and more collaboration between universities The Higher Education Cooperation Program with Foreign Universities will have a good impact on the academic community, especially for students. Collaboration can take the form of student exchanges or international seminars. From a survey conducted in the exact sciences and social sciences there are still a small number of respondents who stated the existence of a Higher Education Cooperation Program with Foreign Universities. For more details, can be seen in the table below.Table 24. Respondents' Response Regarding Is There a College Cooperation Program with Foreign Universities
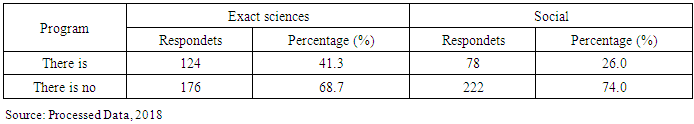 |
| |
|
In the table above, we can explain that in the exact sciences there were 41.3% of respondents who stated that there was a collaborative program between universities and foreign universities and the remaining 68.7% of respondents stated that there was no collaboration program between universities and foreign universities. In the social sciences field, there were 26% of respondents who were aware of the existence of the Higher Education Cooperation Program. However, respondents who stated that there was no Higher Education Cooperation Program with Foreign Universities as many as 74% of respondents.Similar to the Higher Education Cooperation Program with Foreign Universities, the collaboration of the Higher Education Cooperation Program with private foreign institutions has a good impact on the academic community, especially students. It is expected that with this cooperation program students who graduate can work in the private foreign institution. Respondents who stated that there is a program for your Higher Education Cooperation with Foreign Private Institutions is still small, for more details we can see in the table below.Table 25. Respondents' Response about Your College Cooperation Program with Foreign Private Institutions
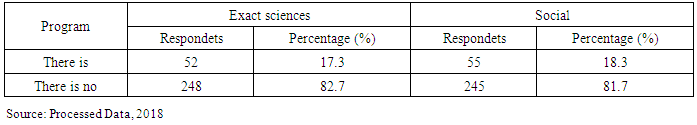 |
| |
|
It can be explained in the table above that in the exact sciences of respondents who stated that there was a collaboration program between universities and private institutions abroad as much as 17.3% of respondents while the respondents stated that there was no collaborative program of universities with foreign private agencies as much as 82.7% of respondents. Furthermore, in the social sciences of respondents who stated that there was a collaboration program between universities and private institutions abroad as many as 18.3 respondents, while the respondents stated that there was no collaboration program between universities and foreign private agencies as much as 81.7% of respondents.DiscussionIn this research there are several points that are used to find out the productive age perspective facing demographic bonuses in Riau Province, namely from respondents 'socioeconomic abilities, mastery of respondents' information on the international labor market, and perceptions of productive age about university readiness to compete in the international labor market.Regional DiscussionBased on the respondents' socio-economic abilities that their education is generally funded by parents, in Pekanbaru City as many as 90% of respondents, Indragiri Hilir Regency as many as 71% of respondents and Rokan Hulu District as many as 82% of respondents. It was taken from the income of parents in Pekanbaru City that the average family income of the respondents was Rp. 4,413,000,- and the composition of income levels The parents of the largest respondents are in Pekanbaru City, the level of income is Rp. 3,000,001 - Rp. 3,500,000 which is as much as 30%, in Indragiri Hilir Regency, it can be seen that the average family income of the respondents is Rp. 3,834,000,- and the composition of income level The parents of the respondents are at the highest level of income of Rp. 3,000,001 - Rp. 3,500,000 which is as much as 22%, the last in Rokan Hulu Regency shows that the average family income of respondents is Rp. 4,161,000,- and the composition of income levels the parents of the respondents are at the highest income level of Rp. 3,000,001 - Rp. 3,500,000 which is as much as 35%. Continuing education abroad if a given scholarship was given stated interest in 86% of respondents in Pekanbaru City, 83% of respondents in Indragiri Hilir Regency and 52% of respondents in Rokan Hulu District.Furthermore, mastery of respondents' information on the international labor market. The demographic bonus is known by respondents in Pekanbaru City as many as 61% of respondents, in Indragiri Hilir Regency as many as 43% of respondents, and in Rokan Hulu Regency as many as 42% of respondents. The bonus demographic information is generally obtained by respondents via the internet, in Pekanbaru City as many as 55.7% of respondents, in Indragiri Hilir Regency as much as 62.8% of respondents, and in Rokan Hulu Regency as many as 71.4% of respondents. The most perceived advantage gained by Indonesia from the bonus demographics according to respondents is the availability of productive age workers in Pekanbaru City as many as 64% of respondents, in Indragiri Hilir Regency as much as 53.5% of respondents, and in Rokan Hulu Regency 54.8% of respondents.In speaking foreign languages, 67.5% of respondents in Pekanbaru City master foreign languages, in Indragiri Hilir Regency as many as 65% of respondents and in Rokan Hulu Regency 63% of respondents. Foreign languages controlled by respondents, in Pekanbaru City 61.1% of respondents mastered English, in Indragiri Hilir Regency as many as 76.9% of respondents mastered English and in Rokan Hulu District as many as 79.4% of respondents also mastered English. Information technology capability / mastery of respondents felt that their ability was not as good as 50% of respondents in Pekanbaru City, 54% of respondents in Indragiri Hilir Regency and 57% of respondents in Rokan Hulu District.The country that was the destination of Pekanbaru City's respondents who were the most chosen was Singapore, which was 19% of respondents, respondents in Indragiri Hilir District, who chose Malaysia as many as 26% and Rokan Hulu District respondents chose Malaysia, which was 32%. The reason for respondents choosing foreign countries to work is because of higher salaries as much as 38% of respondents in Pekanbaru City, 48% of respondents in Indragiri Hilir Regency and 55% of respondents in Rokan Hulu District.The last indicator of productive age perception is the readiness of programs from universities in competing on the international labor market. There is a curriculum that supports respondents to work abroad as much as 69% of respondents in Pekanbaru, 60% of respondents in Indragiri Hilir Regency while in Rokan Hulu Regency, 37% of respondents said there was no curriculum that supported respondents to work abroad. The socialization about working abroad by the respondents stated that it had never been held, namely 84% of respondents in Pekanbaru pekanbaru, 97% of respondents in Indragiri Hilir Regency and 76% of respondents in Rokan Hulu District. Furthermore, regarding the collaboration program of universities with foreign universities, respondents from Pekanbaru City chose not to have 54% of respondents, 88% of respondents in Indragiri Hilir and 95% of respondents in Rokan Hulu Regency. The collaboration program of universities with foreign private agencies respondents chose none, namely 75% of respondents in Pekanbaru City, 100% of respondents in Indragiri Hilir Regency and 93% of respondents in Rokan Hulu District.Discussion Based on ScienceIn the respondent's socio-economic ability that education is funded by parents, in the exact sciences there are 83.3% of respondents, and in the social sciences as much as 87.7% of respondents. It is taken from the income of parents in the exact field of science that the average family income of the respondents is Rp. 4,338,000,- and the composition of income levels The parents of the respondents are at the highest level of income of Rp. 3,000,001 - Rp. 3,500,000 which is as much as 30.3% and in the field of social sciences there is an illustration that the average family income of the respondents is Rp. 4.211,000,- and the composition of income levels The parents of the respondents are at the highest level of income of Rp. 3,000,001 - Rp. 3,500,000 which is 28.7%. Continuing education abroad if given a scholarship respondent expressed interest as much as 80.3% of respondents in the exact sciences and 79.3% of respondents in the field of social sciences.Furthermore Mastery of respondents' information on the international labor market. The demographic bonus was never known by respondents, namely in the exact field of science as much as 47% of respondents and in the social sciences field as much as 53% of respondents. Information on bonus demographics obtained by respondents through the internet in the exact sciences was 56.0% of respondents and in the social sciences field as many as 60.7% of respondents. The most felt advantage gained by Indonesia from the bonus demographics of respondents was the availability of productive age workers in the exact sciences as many as 51.1% of respondents and 69.1% of respondents in the social sciences field.In speaking foreign languages, as many as 59.7% of respondents in the exact sciences mastered foreign languages and in the social sciences field as many as 73% of respondents mastered foreign languages. Furthermore, foreign languages controlled by respondents, in the exact sciences, 63.1% of respondents mastered English and in the social sciences field as many as 64.4% of respondents mastered English.Information technology ability/mastery respondents felt that their abilities were not as good as 46.7% of respondents in the exact sciences and 57.0% of respondents in the social sciences field. The country that was the target of the respondents in the exact sciences sector who was the most chosen was Malaysia, which was 20.7% of respondents and the social sciences of respondents chose Singapore, which was 21.0% of respondents. The reason for respondents choosing foreign countries to work is because of higher salaries as much as 43.3% of respondents in the exact sciences and 41.7% of respondents in the social sciences field.The third indicator is the perception of productive age about the readiness of programs from universities in competing on the international labor market. There is a curriculum that supports respondents in competing in the international labor market as many as 61% of respondents in the exact sciences and 63.3% of respondents in the field of social sciences. The socialization about working abroad by respondent colleges stated that it had never been held, namely 79.1% of respondents in the exact sciences and 86.7% of respondents in the field of social sciences. Furthermore, regarding the collaboration program of universities with foreign universities, respondents in the exact sciences field chose no 68.7% of respondents, and in the social sciences 74.0% of respondents. The collaboration program of universities with foreign private agencies respondents chose none, namely 82.7% of respondents in the exact sciences and 81.7% of respondents in the field of social sciences.
5. Conclusions and Suggestions
ConclusionThe conclusions from the results of this study are that the Productive Age Group Perspective in Competing in the International Labor Market is seen from the socio-economic ability of respondents that in general respondents' education is financed by parents because most of the respondents still have not worked and there is interest from respondents to further education.Furthermore, if viewed from the mastery of respondents' information on the international labor market, there are still many respondents who do not yet know the meaning of the demographic bonus. Then the mastery of foreign languages of the respondents generally mastered foreign languages, foreign languages that were generally mastered namely English, mastery of information technology was still not good but respondents had a great willingness to work abroad with destination countries namely Malaysia and Singapore because the country was considered to provide higher salary.Finally, the perception of productive age is about the readiness of programs from universities in competing on the international labor market. Higher education provides a curriculum that motivates respondents to work abroad. But according to respondents in general, universities are still lacking in socialization of the international labor market, cooperation programs with foreign universities and cooperation with private institutions abroad.SuggestionThe respondents are expected to increase the understanding regarding bonus demographics, respondent's foreign languages, and mastery of information technology in order to be able to compete in the international labor market.In addition, universities are expected to improve programs/policies that are able to support respondents in competing in the international labor market, through socialization of the international labor market and also increasing collaboration with foreign universities and private institutions abroad.The government is also expected to provide stimulants in the form of scholarships to respondents because the economic capacity of respondents is still low, where the tuition fees are generally funded by their parents.
References
| [1] | Adioetomo, S. M. 2005. Demographic Bonuses Explain the Relationship Between Population Growth and Economic Growth. Depok: i. Speech was delivered at the Permanent Inauguration Ceremony of the Professor in Population Economics at the Faculty of Economics, University of Indonesia. |
| [2] | Adioetomo, Sri Moertiningsih and Samosir, Omas Bulan. 2012. Basics of Demography. Demographic Institute of the Faculty of Economics, University of Indonesia, Salemba Empat. Jakarta. |
| [3] | Central Bureau of Statistics. 2013. Projections of Indonesian Population. BPS. Jakarta. |
| [4] | Central Bureau of Statistics. 2017. Riau in Numbers. BPS. Pekanbaru. |
| [5] | National Agency for Placement and Protection of Indonesian Workers. 2017. Data on the Placement and Protection of Indonesian Workers in the Period of January 1 S.D December 31, 2017. BNP2TKI. Jakarta. |
| [6] | Birdsall, Nancy, Allen C. Kelley, Steven W. Sindings. 2001. Population Matters, Demographic Change, Economic Growth and Poverty in the Developing World (eds.). Oxford University Press. New York. |
| [7] | Bongaarts, John. 2001. Dependency of Burdens in the Developing World. In In Birdsall, Kelly and Sindings. 2003. Page 55-64. |
| [8] | Lee, Ronald D., Andrew Mason and Tim Miller, 2001. 'Savings, Wealth and Population' in Birdsall, Kelley and Sindings (eds.) 2003. pp. 137-164. |
| [9] | Mankiw, Gregory N. 2002. Macroeconomic Translation Theory. PT.Gramedia Main Library. Jakarta. |
| [10] | Mason, Andrew. 2001. Population Change and Economic Development in EastAsia. Challenges Met, Opportunities Seized. California: Stanford University Press. Stanford. |
| [11] | Margono. 2004. Educational Research Methodology. Rineka Cipta. Jakarta. |
| [12] | Ross, J. W and Weill, P. 2004. IT Governance: How Top Performers Manage IT Decision Rights for Superior Results. MA: Harvard Business School Press. Boston. |
| [13] | Simanjuntak, Payaman. J. 2005. Management and Performance Evaluation. Institute of Publishers of the Faculty of Economics UI. Jakarta. |
| [14] | Sugiyono. 2001. Assessment Method. Bandung: Alfabeta. |
| [15] | Sugiyono. 2012. Qualitative Quantitative Research Methods and R & B. Alfabeta. Bandung. |
| [16] | Suryahadi, A., Raya, U. R., Marbun, D., & Yumna, A. 2012. Accelerating povertyand vulnerability reduction: trends, opportunities and constraints. SMERU Research Institute. Accessed from http://www.smeru.or.id/report/workpaper/povetyvulnerabilityreduction/povertyvulnerabilityreduction.pdf. Tangagal 4 April 2018. |
| [17] | https://www.bps.go.id/subject/6/tenaga-kerja.html accessed on April 1 2018. |

 Abstract
 Reference
 Full-Text PDF
 Full-text HTML