-
Paper Information
- Next Paper
- Paper Submission
-
Journal Information
- About This Journal
- Editorial Board
- Current Issue
- Archive
- Author Guidelines
- Contact Us
American Journal of Economics
p-ISSN: 2166-4951 e-ISSN: 2166-496X
2018; 8(6): 254-262
doi:10.5923/j.economics.20180806.04

Jakarta Composite Index, Sharia Stock Index and Rupiah Exchange Rate before and after the Indonesian Presidential Election 2014
 Abstract
 Reference
 Full-Text PDF
 Full-text HTML
Agus Eko Sujianto
Department Introduction to Economics, Economic and Business Faculty, State Islamic Institute of Tulungagung, Indonesia
Correspondence to: Agus Eko Sujianto, Department Introduction to Economics, Economic and Business Faculty, State Islamic Institute of Tulungagung, Indonesia.
| Email: |  |
Copyright © 2018 The Author(s). Published by Scientific & Academic Publishing.
This work is licensed under the Creative Commons Attribution International License (CC BY).
http://creativecommons.org/licenses/by/4.0/

Stock is capital shares sign to a limited liability company. Yet, the Indonesia Composite Index was still depends on Rupiah (IDR) Exchange Rate. Rupiah Exchange Rate remains unstable in some circumstances such as presidential election. The purposes of this research were: (1) to analyze the differences of Jakarta Composite Index; (2) to analyze the differences Sharia Share Index; and (3) to analyze the difference of Rupiah Exchange Rate before and after the presidential election. The research used descriptive statistic method. It used different tests of the two paired samples average (Paired Sample T-Test) either before or after the 2014 presidential election. The conclusions are: (1) there were significant differences of Jakarta Composite Index after the presidential election. It tended to increase, contrast with the condition before the presidential election. (2) Indonesia Sharia Stock Index tended to increase after the Presidential election that all were based on closing price. (3) Indonesia Rupiah Exchange Rate tended to increase after the Presidential election that based on middle rate.
Keywords: Jakarta Composite Index, Syariah Share Index, Rupiah Exchange Rate, Event Study
Cite this paper: Agus Eko Sujianto, Jakarta Composite Index, Sharia Stock Index and Rupiah Exchange Rate before and after the Indonesian Presidential Election 2014, American Journal of Economics, Vol. 8 No. 6, 2018, pp. 254-262. doi: 10.5923/j.economics.20180806.04.
Article Outline
1. Introduction
- The presidential and vice presidential election (Pilpres) has a systemic impact on the Economic aspects, including microeconomic and macroeconomic. In the microeconomic, presidential election had impacted the movement of Jakarta Composite Index or JCI) and Sharia Share Index (SSI) while in macroeconomic, the presidential election impacted the movement toward Rupiah Exchange Rate to US Dollar.The stock is a sign of capital participation in a limited liability company. There are benefits of owning shares of a company, such as: (1) Dividends; part of the company profits distributed to the stockholders, (2) Capital Gains; the profit gained from the difference between the sale price, and (3) Non-Financial; the benefits of the pride and voting power in determining the course of the company (Anoraga and Piji, 2001). Based on observations on the closing price index of the JCI period before the Presidential Election, a fluctuating trend varied into some categories, are; June 3rd (4942.16), June 10th (4946.09), June 17th (4909.52), June 24th (4862.24), July 1st (4884.83) and July 8th(5024.71). According to Krisna and Wirawati (421: 2013), JCI is a record of changes and movement of stock prices since the first start circulating until at a certain moment (Krisna, 2013). So, if the trend of the closing price of JCI increases (especially starting on June 24th) shows that the capital market is experiencing growth. Investors also tend to be interested invest in Indonesian open companies, and relatively undisturbed by the tense competition before the presidential election.The presidential election and the rupiah exchange rate movement influenced JCI’s downward trend on average throughout June. The weakening of JCI was followed by the declining rupiah’s rate exchange and awaiting new sentiment after the Presidential Election and the rupiah movement (Java Post, 2014). This grand five years event is indeed causing uncertainty. Moreover, business climate is difficult to predict stimulating businesses to take a Wait-See position and to hope none conflict from post-election.The decision to conduct a Wait-See position is heavily influenced by various conditions and situations that occurred among others, such as: (1) market conditions that are far from stability and uncertainty of both internal and external factors; (2) excessive reactions from political decision-makers and (3) the political bargaining power of the opposition in the political sphere (Fahmi, 145: 2012). Thus, this study offered the observation on the differences in JCI before and after the 2014 presidential election.Shares are categorized into two, including Sharia and non-Sharia shares (Supadi and Amin, 2012). This difference lies in the business activities and objectives. According Auliyah and Hamzah (Auliyah and Hamzah, 2006) Sharia shares are one form of common stock that has special characteristics in the strict control form on Halal scope of business activities. Meanwhile, non-sharia shares refers to ordinary shares is a securities evidence of delivery or ownership of individuals or institutions within a company (Ang, 1997).Similar to the JCI, the Sharia Share Index (SSI) as an institution becoming a forum for all Sharia shares listed on the Indonesia Stock Exchange (IDX) also shows a fluctuating trend. The existence of SSI completes the previous existing sharia index; Jakarta Islamic Index (JII). Thus, sharia share index owned by IDX are divided into two kinds, are: SSI and JII. The main difference between SSI and JII lied in the number of sharia shares that became the constituents of each index. SSI comprised all Sharia shares listed on the IDX (currently 304 shares) while JII is only the 30 most liquid Sharia shares of all ISSI shares.The tendency of SSI closing price is the same as JCI which increase from June 3rd to June 10th, but decreased. This condition did not last long because SSI was closed under growth conditions from June 24th to July 8th. Based on the explanation, this study also would like to investigate SSI differences before and after the 2014 presidential election.In fact, the exchange rate (Kurs) is the price of a currency denominated in a foreign currency (Siamat, 2001). The exchange rate also means the amount of one currency needed to buy another currency. Indeed, the rupiah exchange rate is the ratio of the value or the price of the rupiah currency to the currency of another country (Brealy et al, 2008).Rupiah average rate into US dollar from 3rd to 24th June was less encouraging because the rupiah depreciated against the US dollar which equal to 12000 per US Dollar. However, this condition did not last long due to the strengthening of the exchange rate before the presidential election.The rupiah exchange rate on the average tends to weaken throughout June as JCI and ISSI predicted by Bergen (2010). Dealing with Bargen (2014), the factors that affect the depreciation of the rupiah exchange rate is the increasingly tight competition to the presidency. On the point, this study also observed the difference of the rupiah exchange rate before and after the 2014 presidential election.
2. Literature Review
- There are researches concerning JIC, SSI and Rupiah Exchange Rate. First, Maysami and Koh (2000) examined exchange rate within macroeconomic variables and its influence toward the relationship of Singapore Stock markets. Second, Sakti and Harun (2013) examined the relationship between Islamic Stock Prices and Macroeconomic Variables with evidence from Jakarta Stock Exchange Islamic Index. Furthermore, Ibrahim and Yusoff (2001) found that Exchange rate was negatively associated with the stock prices in their analysis of equity market and macroeconomic variables. Moreover, Shabri and Rosylin (2009) studied on long-run relationship between Islamic stock returns and macroeconomic variables using Autoregressive Distributed Lag model (ARDL).Based on the conducted researches above, the previous study did not concern about Presidential election as the event and the indicator that potentially has high impact toward JCI, SSI and Rupiah Exchange Rate. Thus, this study was conducted to analyse Jakarta Composite Index, Sharia Stock Index, and Rupiah Exchange Rate before and After 2014 Indonesian Presidential Election.
3. Methodology
- This research was descriptive statistical study. It is a method related to the data collection and presentation. It measures data quality in variables, statistical summary, (mean, median, modus and deviation standard, etc.) distribution and graphical representation without any probabilistic formula (Walpole, 1993; Correa-Prisant, 2000; Dodge, 2006). In addition, this study could be also included into event study which explained the events study examined the market reaction to an event. Event study can be used to test information content of an event (Hartono, 2003). The research of this event study is interesting to be used in economic research in the last decade because this type of research is able to reveal the meaning contained in an event both economically and non-economically.This research revealed the differences of research variables, namely: RUPIAH Exchange Rate, Sharia Share Index (SSI) and Jakarta Composite Index (JCI) before and after the presidential and vice presidential election of the Republic of Indonesia held in July 2014. This study can be considerations for making managerial decisions for investors and potential investors.Furthermore, Population is a generalization region consisting of objects /subjects that have certain qualities and characteristics set by the researchers to be studied and then drawn the conclusions (Sugiyono, 2014). The population of this research is all public companies under IDX either included in SSI or not during the research period dated May 26th to August 27th 2014 while the sample is part of the number and characteristics possessed by the population. The Sampling track in this research used purposive sampling method. Purposive sampling is an accustomed-sampling to the objectives and targets of research. Sugiyono (2014) explained that the sample purposive is a technique of determining the sample with certain considerations while, The sample companies selected based on the criteria are: (1) all public companies in IDX from 26th May to 27th August 2014; (2) public companies of SSI category at IDX from 26th May to 27th August 2014; (3) the RUPIAH exchange rate from 26th May to 27th August 2014 and (4) has a pair that is the conditions before and after the 2014 presidential election.This study used both primary and secondary data sources. Primary data sources are the sources that directly provide data to the collectors. Secondary sources are sources that indirectly provide data (Sugiyono, 2014). The primary data were rupiah exchange rate obtained from BI Kediri and JCI, and SSI that were published by IDX. Further, data collection technique used library research on documentation. The documents required in this study are the rupiah exchange rate published by Bank Indonesia (these data were obtained from BI Kediri) and JCI and SSI published by IDX.Based on the problem formulation model, this research is included in the comparative research, based on data analysis method, this research is solved using inferential statistic method, especially parametric statistic. The selection of parametric statistics because in this study wanted to examine the average differences of two paired samples (Paired Sample t-Test), i.e. rupiah exchange rate, Sharia share index and Jakarta composite index either before or after the 2014 presidential election.According to Nugroho (2005), different test of two paired samples, t-paired is a statistical method that is often used in parametric statistics. However, before this test performed, the normality test as recommended by Nugroho should be used with the parametric statistics and it absolutely must be accompanied by the data normality test (Nugroho, 2005). The t-test is one of the parametric statistics, then the analysed data must be normal and homogeneous and the data scale is the interval or ratio (Fuad and Sujianto, 2014).Furthermore, Fuad (2014) stated that normality test intended to find out whether the analysed data is normally distributed. This normally distributed data becomes a requirement in the parametric statistical analysis. In this study, the data normality test was performed based on the results of the Kolmogorov-Smirnov Test as recommended by Sujianto (2009), and for decision making data normality with guidelines: (1) Sig value. Or significance or probability value <0.05, the data distribution is abnormal and (2) the Sig Value. Or significance or probability value> 0.05, the data distribution is normal.The parametric statistics was used to test the parametric hypothesis of two variables of one sample group were t-test. This test is used to analyse research data using correlated comparability, usually, data obtained from the results of research in the form of pre-experimental design or before or after treatment (Fuad and Sujianto, 2014).These Two-sample t-tests included comparative test. The purpose of this test is to compare (differentiate) whether the two data (variables) are the same or different. Ridwan (2012) stated that the use of the comparative test is to test the ability of generalization (significance of research results in the form of comparison of the variable state of two average samples). The paired sample t-test is used to analyse the presence or absence of the average difference between two groups of paired (related) samples, i.e. a sample but undergoing two different treatments. The tested in this research are rupiah exchange rate, Sharia Share Index, and Jakarta Composite Index.The test used two-tailed test with the significance level is 5% (α = 5%). In addition, the Paired Sample t-Test was chosen to answer the three problem formulas as recommended by Kurniawan (2010) in his research which tested the probability level of the bank before and after the establishment of the fatwa (instruction) of the Indonesian Ulama Council on bank interest.While the decision making on paired sample t-test is based on the hypothesis (Fuad and Sujianto, 2014):(1) H0: There is no difference before and after the Presidential Election;(2) Ha: There are differences before and after the Presidential Election.With Criteria: (1) Use significant value / P-Value. If the significant value / P-Value> 0.05; Then Ho accepted, and if significant value / P-Value <0.05; Then Ho is rejected and (2) Using a comparison between t arithmetic with t table. The t value of the table is derived from α (real level / significant level) with the degree of freedom (df). If t count> t table; Then Ho is rejected and if t arithmetic
4. Findings and Discussion
4.1. Findings
4.1.1. Indonesian Composite Index
- Jakarta Composite Index (JCI) is one of the stock market index (securities) used by Indonesia Stock Exchange (IDX). This index was first introduced on April 1st 1983, as an indicator of stock price movements on the Stock Exchange. This index includes the price movement of all common stock and preferred stock listed on the JSX. The basic day for JCI computation is August 10th 1982.On the date, the index was assigned with the base value is 100 and the listed shares at that time amounted to 13 shares. The basis for calculating the JCI is the total Market Value of the total shares listed on August 10th 1982. Total Market Value is the total multiplication of each listed share (excepted for the company under the restructuring program) based on the JSX price on the day.Index calculation represents the movement of stock prices in the market/exchange that occurs through the auction trading system. Basic Value will be adjusted quickly if there is a change in issuer's capital or there are other factors that are not related to the stock price. Adjustments will be made if there are additional new issues, partial/company listings, warrants and convertible bonds as well as delisting. In the event of a stock split, stock dividend or bonus shares, the Base Value is not adjusted because the Market Value is not affected. The stock price used in calculating the JCI is the stock price in the regular market based on the price that occurs by the auction system.JCI’s values always fluctuate following to economic circumstances (eg inflation and interest rates), the number of stock quotes and demand, political situation, and so on. Here is a picture of JCI movement during the period May 26th to August 27th 2014 which has been processed using SPSS version 20.
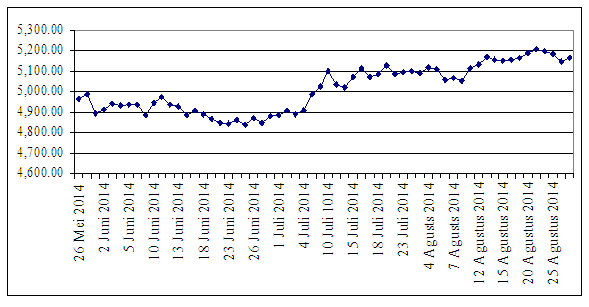 | Figure 1. JCI based on Closing Price 26th May to 27th August 2014 |
4.1.2. Sharia Share Index
- SSI values are always dynamic in accordance with economic circumstances (eg economic growth, inflation, and interest rates), total demand and supply of sharia shares, political situation, and so on. Figure 2 represents the movement of SSI during the period May 26th to August 27th 2014, processed using SPSS.
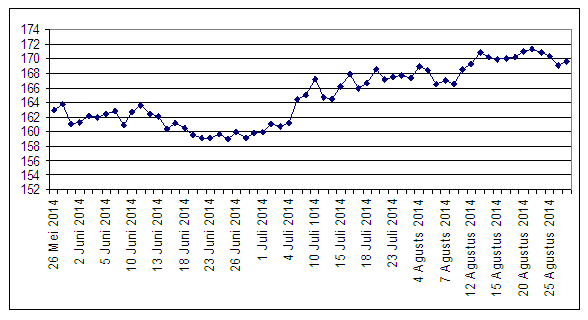 | Figure 2. SSI Based on Closing Price from 26th May to 27th August 2014 (Source: Secondary Data, Processed (2015)) |
4.1.3. Rupiah Exchange Rate
- The exchange rate used is the rupiah exchange rate into US dollar issued by Bank Indonesia. Based on Appendix 5 it can be stated that the amount of research data is 30 with the periodization of research before the Presidential Election on 26th May to 8th July and after Presidential Election on July 10thto August 27th 2014. Rupiah exchange rate before the Presidential Election is 11,611 and 11,498 after it decreased to 113. The decline in the rupiah exchange rate indicates that there is a negative sentiment of the rupiah exchange rate toward US dollar.The maximum value of rupiah exchange rate before the Presidential Election is 12,103 and 11,822 after the Presidential Election, which means a decrease up to 281. The decline in the maximum SSI indicates that there is a negative sentiment of the rupiah exchange rate against the US dollar. The decline in the minimum and the maximum value of the rupiah exchange rate before and after the Presidential Election reflects that in general the Democratic Party in Indonesia, namely the presidential election, disrupts the rupiah exchange rate toward US dollar. So the political event (Presidential Election) in Indonesia has an impact on the depreciation of the rupiah exchange rate.
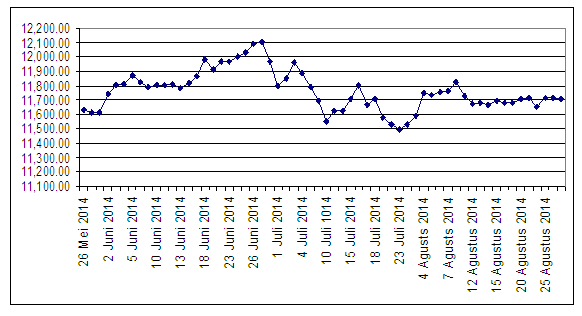 | Figure 3. Rupiah Exchange Rate Based on Rate of 26th Mei to 27th August 2014 (Source: Secondary Data, Processed (2015)) |
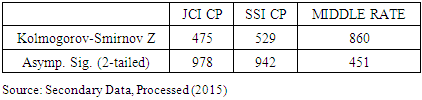
4.1.4. Data Normality Test
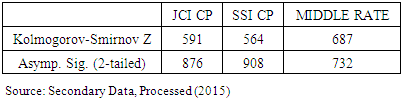
- Data normality was required for the next statistical test (Paired Sample t-Test). Paired Sample t-Test is a parametric statistic test, so before committing the test, it is necessary to test the data normality to test the data normality, this research using One-Sample Kolmogorov-Smirnov Test both for JCI, SSI, and rupiah exchange rate both before and after Presidential Election.Based on the results of the research data analysis (Table 1), it can be argued that the value of Asymp. Sig. (2-tailed) for JCI before the Presidential Election is 0.876. This value is greater than the value of α (this study uses the level of α = 0.05 = 5%), which means the corresponding JCI data before the presidential election normally distributed. For SSI variable the value of Asymp Sig. (2-tailed) is 0.908. This value is greater than the value of α (this study uses the level of α = 0.05 = 5%), which means SSI-related data before the presidential election is normally distributed. While the exchange rate variable Asymp. Sig. (2-tailed) is 0.732. This value is greater than the value of α (this study uses the level of α = 0.05 = 5%), which means data related to the middle exchange rate before the presidential candidate is normally distributed.
|
|
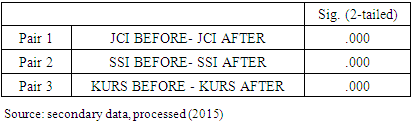
4.1.5. Paired Sample t-test
- It has been described before that the t-test of two paired samples belongs to comparative test. The purpose of this test is to compare whether the two data (variables) are the same or different if there is an event called Presidential Election.Based on Table 3 below, it can be argued that the significant value or P-Value indicated by the Sig value. (2-tailed) by 0.000. This value is smaller than α = 0.05 so that Ho conclusion is rejected and Ha accepted. The result that Ha accepted this means "There are differences before and after the Presidential Election" is significantly good for the composite share price index variables, Indonesian sharia share index and the middle rate of Rupiah against US dollar.
|
4.2. Discussion
4.2.1. Differences of JCI before and after 2014 Presidential Election
- Based on the research results indicates that JCI before and after the Presidential election there are significant differences. Thus the hypothesis which reads: "there is a difference of JCI before and after the 2014 presidential election" is tested.These results are relevant to the observations in the form of drawings (figure 1) that the JCI before the Presidential Election indicates a decline. This JCI decline trend lasted for 1 month starting from May 26th 2014 to June 27th 2014. The value of JCI back on 30th June and continue to increase after the presidential election.However, this research result stated there is a difference of JCI before and after Presidential Election has a contradictive result with Latifah’s research (2012). According to him: (1) there is no difference between stock return before and after religious holidays; (2) there is no difference between stock return before and after national holiday; (3) there is no difference between stock return before religious holiday and before national holiday and (4) there is no difference between stock return after religious holiday and after national holiday.This difference is caused by a different of event study, where this research using presidential election, while Latifah’s research using religious holidays and national holidays. Besides, the periodization of the research is also different, whereas Latifah’s research uses data from January 2nd 2007 to December 30th 2011. While this study used data from May 23rd to July 8th (before the Presidential Election) and July 10th to August 27th (after the Presidential Election).The results of this study are similar to Pramana and Wisnu's research that there is a significant difference from trading volume activity before and after the event. And there is no significant difference of abnormal return before and stock split announcement (Pranama and Mawardi, 2012). The same results were also shown by Aderiyawan's research. According to him, there is a difference of average stock price included in JCI between time period before and after fuel oil price (Aderiyawan, 2013).
4.2.2. The SSI Differences before and after 2014 Presidential Election
- This study shows that there are significant differences on the SSI, both before and after the presidential election. Thus, the tested-hypothesis: "there is a difference of ISSI before and after the 2014 presidential election".The results of this study were different with Budiyanto’s research, et al (2006), who found: (1) There was no significant difference in average Trading Volume Activity (TVA) either before or after joining the Jakarta Islamic Index, with the t-count of -1, 0852 is smaller than t-table of 2.021 and (2) There are no significant differences of average Abnormal Return between before and after joining Jakarta Islamic Index with the calculation of the t-count value of -0.0839 smaller than t-table of 2.021. Since there is no significant difference between TVA and abnormal returns in this study, it is advisable to the investors if they wish to find returns on the stocks included in the JII index, to select stocks that have long joined JII.This difference is due to the historical sample or observed company. Where this study observed companies have joined the Jakarta Islamic Index both before and after the presidential election. Unlike Budiyanto, et.al (2006) who used companies that have not joined the Jakarta Islamic Index (data before) and have joined the Jakarta Islamic Index (data after), this study used Pilpres as the event study.
4.2.3. Differences in Rupiah Exchange Rate before and after 2014 Presidential Election
- Based on the results of the research, it showed that the rupiah exchange rate both before and after the presidential election got a significant difference. Thus, the tested-hypothesis: "there is a difference in the rupiah exchange rate before and after the 2014 presidential election".The results of this study are dealing with Mukhlis’s research that in the period after the economic crisis, the volatility of the exchange rate of USD increased compared to the period before the economic crisis (Mukhlis, 2011). According to Mukhlis, the peak of volatility in the exchange rate toward Rupiah/USD occurred during the period of 1997/1998 indicating a gap between supply and demand for foreign currency (USD) compared to local currency (rupiah). This happens because the public expectations are not rational responding the economic crisis. So its economic behavior becomes wild and reflects high moral hazard.This study is also relevant to the Bangun’s research that tested the appreciation and depreciation of the Rupiah (Indonesia), Won (Korea), Bath (Thailand), Dollar (Singapore), Yen (Japan) before and after the economic crisis in 1997. The results showed that the value The United States dollar exchange rate into rupiah in the pre-crisis period despite being the most appreciate but the most volatile. In the period after the crisis, the US dollar exchange rate into rupiah became the most appreciative and volatile compared to other currencies (Primsa, 2003). Based on this study, there is a difference in the RUPIAH exchange rate into the US dollar before and after the 1997 economic crisis. Where before the economic crisis the rupiah exchange rate was stable and after the crisis the exchange rate position became labile or volatile.
5. Conclusions
- Based on the results of this research and discussion could be concluded:1. JCI movement based on closing price before the Presidential Election shows a decreasing tendency. Meanwhile, the movement of JCI based on closing price after the Presidential Election showed an increasing tendency. These were because of investor theoretically wanted to take a safe spot from capital market various risks. Investors needed a certainty about Indonesia’s investment climate. Moreover, the situation before Presidential Election was full of uncertainty. Therefore, the JCI movement was mentioned as above. 2. Similar to the JCI, the SSI movement based on closing price before the Presidential Election shows a decreasing tendency. While the movement of SSI based on closing price after the presidential election showed an increasing trend. The decrease SSI tendency because of political issue before Presidential Election. Investor tended to take safe spot to avoid the risks considered stock market was full of uncertainty. Therefore, the investor was waiting after the Presidential Election.3. The movement of the rupiah Exchange Rate by the Middle Rate before the Presidential Election shows a tendency to weaken (the Rupiah depreciates into the US dollar). While the rupiah Exchange Rate Based on the Middle Kurs after the Presidential Election showed a strong tendency (rupiah appreciated into US dollar. Therefore, it showed generally that Rupiah exchange toward Dollar was disturbed by Indonesia Presidential Election. It definitely stated that Indonesia Presidential Election impacted on Rupiah Exchange Rate depreciation. The recommendations of this research are:1. For the academic world. The results of this study provide empirical evidence that the JCI, SSI and rupiah exchange rates both before and after the Presidential Election differ significantly. So it is recommended to extend empirical studies that non-economic factors such as presidential election, have implications on JCI, SSI, and rupiah exchange rate in Indonesia.2. For the practice world. Information related to the movement of JCI, SSI, and rupiah exchange rate is beneficial for investors in making economic decisions. For example the decision to invest in capital markets, the decision to buy sectoral shares such as shares incorporated in the Jakarta Islamic Index as well as other economic investments. So it is recommended to prospective investors to pay attention to events international, national, and regional. Besides, it is also necessary to pay attention to economic, social and political events before investing in the capital market.3. For the next researcher. The variables of this study are limited to JCI, SSI, and rupiah exchange rate. While in the long term the presidential election also affects other macroeconomic factors so it is recommended to expand the study and include elements of economic growth, inflation, and employment.
ACKNOWLEDGEMENTS
- The researcher really thanks the family, friends and the supervisor who already helped and supported him to finish the study.