Gudina Goda Korsa, Destaw Akele, K. Rajan
Department of Economics, College of Business and Economics, Hawassa University, Ethiopia
Correspondence to: K. Rajan, Department of Economics, College of Business and Economics, Hawassa University, Ethiopia.
| Email: |  |
Copyright © 2018 The Author(s). Published by Scientific & Academic Publishing.
This work is licensed under the Creative Commons Attribution International License (CC BY).
http://creativecommons.org/licenses/by/4.0/

Abstract
This paper examines the effect of devaluation on domestic price along with the effect of changes in Money Supply (MS), World Commodity Price Index (WCPI) and the Output gap on the Consumer Price Index (CPI) in Ethiopia for the period 1995 to 2017 on the basis of secondary data using bound testing (ARDL) approach of co-integration. The result of ARDL in the short run shows that devaluation of the nominal effective exchange rate (NEER) has no significant effect on CPI although money supply and WCPI have a positive and significant effect. The speed of adjustment from previous quarter’s disequilibrium in CPI to current quarter’s equilibrium is fast in each period. In the long run, the NEER, MS and WCPI have positive and significant effect on the CPI. The result of Granger causality test shows that there is a unidirectional causality from nominal effective exchange rate and money supply to the CPI although there is bidirectional causality between CPI and WCPI. The result of impulse response function shows that devaluation increases CPI in each period. The result of variance decomposition shows that, at the initial period, the cause of variation in all the variables are from the variables themselves although the effect declines with time. The study may suggests avoiding continuous and high devaluation of the Birr to the extent possible to avoid the evil consequences of devaluation on the standard of living of the people.
Keywords:
Exchange rate – pass through, Consumer price index, Devaluation, Money supply, World commodity price index
Cite this paper: Gudina Goda Korsa, Destaw Akele, K. Rajan, The Effect of Devaluation on Domestic Prices in Ethiopia, American Journal of Economics, Vol. 8 No. 4, 2018, pp. 191-201. doi: 10.5923/j.economics.20180804.02.
1. Introduction
High inflation has been one of the important characteristics of the developing countries of Africa and Asia for the last many decades. There are different interpretations for the high inflation in developing countries. Actually, there exists a controversy between monetarists and structuralists regarding the causes of inflation. According to the monetarists, the major reason behind inflation in developing countries is the money creation by governments. In addition, they also have found that devaluation of exchange rate is another important reason behind the inflation in developing countries especially in the short run. On the other hand, the structuralists claim that the links between food bottlenecks, income distribution, and social conflicts over the determination of real wages are the important reasons behind inflation. Thus, according to the structuralits, inflation may be generated from the worker-capitalist conflict over the distribution of income between real wages and profits (Agenor and Montiel, 2015, p. 331). International Monetary Fund (IMF) and some other economists (Keynesians) attribute the high inflation of developing countries to the increased demand arising from the increased money supply, deficit, and increased foreign remittances (Sisay, 2008, p. 2-3). As such, it is clear that there are a large number of factors behind the high inflation in developing countries like Ethiopia.In Ethiopia, there has been a sharp decrease in the exports of coffee, oilseed, leather, gold, etc. during the last five years owing to the highly fluctuating commodity prices in the international market and due to the improved strength of US dollar over other foreign currencies. It is in this context that the World Bank has advised the Ethiopian government to devaluate its currency - Birr - at least by 10 percent. The bank indicated that this would boost the export earnings in real terms by five percent and increase economic growth by two percent. In accordance with the advice of the World Bank, on October 10, 2017, the National Bank of Ethiopia (NBE) has devalued the Birr by 15 percent against international currencies (NBE, 2017). The Ethiopian government reiterated that the devaluation was undertaken to encourage exports - to overcome the foreign exchange crunch - and to conquer the black market.Immediately after the devaluation of Birr on October 10, 2017, the prices of almost all commodities and services have sharply increased and have resulted in a rise in the general price level. In other words, the immediate effect of devaluation was acceleration in inflation. Specifically, inflation measured in terms of the Consumer Price Index (CPI) has increased by 3.4 percentage points from 12.2 percent in October 2017 to 15.6 percent in February 2018 (Central Statistical Agency (CSA), 2018). Thus, the increased inflation in Ethiopia, owing to the devaluation of Birr once again establishes the fact that there is a direct relationship between devaluation and inflation. Hence, one of the important factors in the persistence of high inflation in Ethiopia has been the frequent devaluation of Birr. As such, there may not be much disagreement among economists that among the various factors of inflation in Ethiopia, one of the important factors has been the continuous devaluation of Birr by the NBE. There is a feeling among many economists, researcher’s and even among the general public that devaluation of birr has been one of the important factors directly affecting domestic prices and hence the rate of inflation in Ethiopia. It is found that devaluation will directly increase the prices of imported intermediate and finished goods and will indirectly increase the consumer prices by increasing the demand for substitute goods. Thus, exchange rate and inflation are among the macroeconomic variables which have important implications for macroeconomic policy. This is because; devaluation will have a specific effect on exports and imports and a general effect on the domestic prices.Review of LiteratureThere are a large number of studies carried out by different researchers about the impact of exchange rate on the domestic prices in the developed and developing countries. However, these studies differ in their findings owing to the differences in the study period, due to variations in the sources of data, differences in methodology and models used. Here, we have made an attempt to review briefly the major available studies carried out in developed and developing countries including Ethiopia to explore the research gap in the prevailing studies.Studies in Developed CountriesThe study by Hufner and Schroder (2002, p. 11) relates to five countries viz., France, Germany, Italy, Spain and the Netherlands. Their study covers 20 years from January 1982 to January 2001. The study was on the basis of the data from IMF and Bank of England. The objective of the study was to examine the effects of the change in the exchange rate on consumer price level for euro area. They used the weighted harmonized index of consumer prices to measure the elasticity of consumer prices to the change in the nominal exchange rate. For realizing the objective, they have used the vector error correction model. At the aggregate level, (using the relative weights of each country’s inflation rate in the harmonized index of consumer price) the study found that on an average, a 10 percent depreciation of effective euro nominal exchange rate leads to an increase of 0.4 percent inflation rate in the euro area after one year. The total effect converges to 0.8 percentage point after about three years. At the individual country level, the study found that Netherland shows the fastest exchange rate pass-through to consumer prices. However in the long-run, the effect of exchange rate pass-through is highest in Italy followed by France. The effects of a change in exchange rate on consumer prices ranges from 7 percent in France to 12 percent in Italy after one year. The pass-through coefficients range from 8 percent in Spain to 18 percent in Italy after two years. Thus, the study concluded that the euro exchange rate has an effect on inflation measured in terms of consumer prices in the euro area. The study suggested that the monetary authorities should take the fact that exchange rate will have an effect on inflation while framing exchange rate policies.Cheikh and Louhichi (2014, p. 9) have carried out a study for 12 euro area countries. The study was conducted during the period from 1980 to 2010. Their objective was to examine the pass-through of the exchange rate to domestic prices. For realizing the objective, they have used data from IMF’s and data from Organization for Economic Cooperation and Development (OECD)’s Main Economic Indicators and Economic Outlook. They have applied a co-integrated vector autoregressive framework (used the Johansen co-integration procedure). They found that there exists a one co-integrating vector at least for each euro area country of their sample. With regard to the long-run effect of exchange rate changes on domestic prices, they found a wide dispersion of exchange rate pass-through across countries. According to their study, the degree of exchange rate pass-through appears to be most prevalent in Portugal and Greece. However, in Portugal, a one percent depreciation of exchange rate increases domestic prices by about 0.84 percent whereas it was about 58 percent for Greece. The lowest coefficients of long-run exchange rate pass-through were found in Germany, Finland, and France (below 0.20 percent).Studies in Developing CountriesAmong the studies carried out about the impact of exchange rate on inflation and domestic prices in developing countries, the most important and available studies are briefly reviewed here. The study by Rowland (2004, p. 18) examined the exchange rate pass-through to domestic prices in Colombia using two models (unrestricted Vector Autoregressive model and the Johansen framework of multivariate co-integration) of the Vector Autoregressive (VAR) models. The study has covered a 20 year period from January 1983 to October 2002 and was on the basis of monthly data. The study found that the Exchange rate pass-through has been incomplete in Colombia. However, import prices have responded quickly to an exchange rate change, with pass-through coefficients of 0.48 after three months and 0.80 after one year. On the other hand, the producer prices respond more sluggishly, with a pass-through coefficient of 0.28 after one year. With regard to consumer prices, the two econometric frameworks provided relatively different results. The unrestricted VAR framework has shown a pass-through coefficient of 0.08 after one year, while the Johansen framework has shown a coefficient of 0.15. The study concluded that import prices respond quickly to an exchange rate change with as much as 80 percent of the change in the exchange rate being passed on within a year, producer and consumer prices respond much more sluggishly. Exchange rate pass-through to producer prices is modest while the pass-through to consumer prices is very much limited. Thus the influence of an exchange-rate shock on consumer price inflation is limited, with less than 15 percent of an exchange rate change being passed on to consumer prices one year after the shock. The short-term response (after three months) of CPI to an exchange rate change is also very much limited as it was less than 4 percent.Mwase (2006, p. 20) used a structural vector autoregressive (SVAR) model to quantify the exchange rate pass-through for Tanzania using quarterly data for the period 1990q1-2005q1. He found that exchange rate pass-through has declined despite the depreciation of the currency. He divided the sample into a period prior to 1995 and after 1995. In the full sample, pass-through elasticity was found to be 0.028. In the period before 1995, pass-through elasticity was 0.087 and it has declined to 0.023 after 1995.Wimalasuriya (2009, p. 63) has examined the exchange rate pass-through in Sri Lanka by taking two approaches -a log-linear regression model and a SVAR model. The log-linear regression model was estimated to determine the degree of exchange rate pass-through into import prices. The study found that the exchange rate pass-through into import prices is about 50 percent - that is, a 1 percent depreciation of the rupee vis-a-vis its trading partners’ currencies, results in an increase in import prices by around 0.5 percent within a period of about 8 months. The findings of the SVAR model shows that the consumer prices has increased by around 0.3 percent in response to one percent depreciation in the nominal effective exchange rate. The pass-through into wholesale producer prices was found to be much larger, with complete pass-through within a period of about 6 months. The study also found that the factor input prices (worker compensation) has increased by around 0.5 percent as a result of a one percent appreciation in the nominal effective exchange rate.Bhattacharya et al (2008, p. 15) have investigated the relationship between inflation and the exchange rate in the post reform period in India for the period 1997 to 2007. They have also estimated the impact of a change in the nominal exchange rate on the wholesale and consumer price indices. They found that one percent increase in exchange rate causes a 3.7 to 17 percent rise in CPI level in the long run. The short-run effect was found to vary between 10.1 to 11.3 percent. According to them, if the effects of monetary policy are not taken into consideration, 10 percent of the exchange rate shock passes into the CPI in the next period and falls to 6.8 percent after two years. Thus, they found that the exchange rate pass-through is incomplete for India.Bangura et al (2012, p. 93) have employed the SVAR model for the Sierra Leone economy to estimate the pass-through effects of exchange rate changes to consumer prices. The findings show that the pass-through to consumer prices is significant and incomplete. Thus, they suggested that exchange rate depreciation is a potential source of inflation in Sierra Leone. Bwire et al (2013, p. 13) have studied the exchange rate pass-through in Uganda with quarterly data over the period 1999 to 2012 using triangulation of well-specified Vector Error Correction Model (VECM) and SVAR models. They found a strong and significant association between the exchange rate movements and inflation in Uganda. The pass-through to domestic inflation, although incomplete, was modest and persistent with a dynamic exchange rate pass-through elasticity of 0.48. Thus, they suggested that exchange rate movements are a potential source of inflation in Uganda.Arabi (2015, p. 13) has assessed the pass-through effect of the exchange rate to import and consumer prices in Sudan using a vector error correction model. The study has covered the period from 1960 to 2011. On the basis of the CPI model, it was suggested that the exchange rate shock has passed to consumer prices by an average of 47 percent. Thus, the study concluded that exchange rate pass-through is a potentially important source of inflation in Sudan. The exchange rates pass-through to import prices has an upward trend starting from 7 percent in the first year to 109 percent in the tenth year. The error correction terms of import prices and consumer prices have indicated that the elimination of 33 percent and 12 percent of disequilibrium respectively within one year. The exchange rate pass-through into import prices was found to be lower than that of consumer prices. Consumer prices have adjusted within two lags compared to one lag in the adjustment of import prices.Mushendami (2016, p. 1872) has examined the degree of the exchange rate pass-through to prices at different distribution levels, starting from import prices to consumer prices in Namibia from 2000 to 2014 using a SVAR framework. The exchange rate pass-through to inflation was found to be very low and incomplete. The exchange rate pass-through elasticity suggests that the pass-through was low and incomplete on both imported and consumer prices. The study suggested that the exchange rates pass- through on consumer prices and imported prices was estimated to be at 0.01 and 0.04 respectively in the first quarter. After eight quarters, the exchange rate pass-through on both the consumer prices and import prices were estimated to be at 0.02.Faryna (2016, p. 36) has estimated the degree of exchange rate pass-through (ERPT) to domestic prices in Ukraine considering nonlinearities with respect to the size and direction of exchange rate movements by employing a panel autoregressive distributed lag model (ARDL). Exchange rate pass-through for the group of all consumer prices was estimated at a level of 0.172. The response of core prices, prices of tradable and import tradable was 0.181 to 0.189. For core food prices, the ERPT coefficient was somewhat higher 0.268, while the prices of core nonfood goods have the lowest pass-through of 0.154. In the short-run, the degree of exchange rate pass-through for raw food prices have risen to 0.24, which was the highest compared to other price groups, and subsequently stabilizes at a level of 0.183. All ERPT coefficients were statistically significant at a one percent confidence level.Ntsosa and Nkwe (2016, p. 1798) have explored the impact of exchange rate fluctuations and other macroeconomic variables on inflation in Botswana. They have used a vector error correction model to investigate the presence of pass through to the economy due to currency depreciation. The study relates to the period 1998 to 2013 and was based on the data from first quarter of 1998 to last quarter of 2013. The exchange rate pass-through was found to be incomplete with a coefficient of 0.2.Mohammed et al (2017, p. 206) have examined the degree and extent of exchange rate pass-through into domestic consumer price inflation in the Nigerian economy. The study related to the period 1986 to 2013 and has used SVAR methodology. They estimated that the elasticity of domestic prices to the change in exchange rate was about 33 percent. They found a positive relationship between exchange rate pass-through and inflation for the Nigerian economy.Studies in EthiopiaAs there were variations in the exchange rate in Ethiopia, there are a few studies about the impact of devaluation in Ethiopian economy especially on inflation in the country. The important studies in Ethiopia about the relationship between exchange rate and inflation are briefly reviewed in the following paragraphs. One of the earliest studies about the impact of exchange rate variations on inflation in Ethiopia has been by Helen (2012, p. 124). The study relates to the period 1991-92 to 2010-11 and was based on the secondary data from NBE, CSA and IFS. The objective of the study was to examine the exchange rate pass-through in the case of Ethiopia. For realizing the objective, the study applied Conditional Vector Autoregressive (CVAR) and SVAR models. Her study found that ERPT in Ethiopia during the study period has been significant and moderate, and persistent in the case of import prices. However, the ERPT was low and short lived in the case of consumer prices. More specifically, she found that the elasticity of import prices to the change in exchange rate was about 0.29 and showed that the degree of exchange rate pass-through to import prices in the long run was incomplete. However, the degree of exchange rate pass-through to consumer prices was found to be insignificant in the long run which indicated an absence of exchange rate pass through to consumer prices. Thus, on the basis of the co-integration analysis, the study concluded that there was incomplete ERPT to import prices and absence of pass-through to consumer prices in the long run.Mohammadnur (2012, p. 31) has studied the exchange rate pass-through to inflation and other macroeconomic variables in Ethiopia for the period from July 2002 to June 2011. The study used six variables to estimate variance decomposition and impulse response function and have used unrestricted VAR model. To measure the effect of the change in exchange rate on CPI (coefficient of the exchange rate), the study utilized the standardization of change in the exchange rate which can convert the shock from one standard deviation to one percent. He found that, on an average, a one percent change in exchange rate will increase the CPI by 4.75 percent in the first year. The effects of the changes in exchange rate has stopped after two years of exchange rate shock.Mekasha and Molla (2015. P. 37) have studied the exchange rate pass-through for Ethiopia for the period 1993 to on the basis of secondary data (quarterly data) from CSA and World Bank Development Indicators Data Base (WBDIDB). They have used SVAR model to realize their objective. The study found that the exchange rate pass-through to consumer price index was small and incomplete. In other words, according to their study, about 16 percent of the variation in consumer prices in Ethiopia was explained by shocks in nominal exchange rates.The above review of studies show that although there are a large number of studies about the relationship between exchange rate and domestic prices in developed and developing economies, such studies in Ethiopia are few and far between. The three available studies that have examined the exchange rate pass-through to prices in Ethiopia are by Mohammadnur (2012), Helen (2012) and Mekasha and Molla (2015). These studies relate to different periods, based on different data sets, considered different variables and have used different models and hence have reached contradictory results. Over and above these limitations, none of these studies have examined the short-run dynamics. Finally, in a dynamic world, where everything is changing, the findings of a study may not be accurate and applicable across time. Hence, there is a need to examine the effect of exchange rate devaluation on inflation on account of a shock to the exchange rate using the bound testing to co-integration of an Autoregressive Distributive Lags model in Ethiopia.
2. Methodology
The objective of this study is to examine the effect of devaluation of Birr on the domestic price along with the effect of changes in Money Supply, world commodity price index and the output gap on the Consumer Price Index in Ethiopia. The study covers a period of 22 years from 1995 to 2017. The study has mainly used the secondary sources of data available from National Bank of Ethiopia (NBE), World Bank Development Indicators Data Base (WBDIDB), and data from the International Financial Statistics (IFS). The data has been analyzed using the software EViews 9.The theoretical foundation of the effects of changes in exchange rates on domestic prices is associated with the purchasing power parity (PPP) theory. The linear functional form of the model is:  | (1) |
Where CPI is the Consumer Price Index, NEER is the Nominal Effective Exchange Rate, MS is Broad Money Supply, YGAP is the Output Gap, and WCPI is the World Commodity Price Index. We can specify the equation in a log-log form for easy estimation as below: | (2) |
It is expected that the signs of the elasticity parameters are positive for  .The ARDL of Bounds TestingThe present study has used the Autoregressive Distributed Lag (ARDL)/Bounds Testing model for realizing the objective. The ARDL includes the lags of both the dependent variable and independent variables as regressors. The ARDL model of this study is represented as follows:
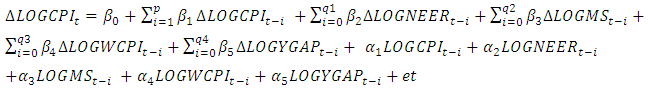 | (3) |
The bounds testing procedure requires the estimation of the above equation. In the ARDL bounds test of co-integration, F-statistics is used to examine the null hypothesis of no co-integration among the variables  . In the ARDL bounds test, the estimated F-statistics value is compared with the two sets of critical values of the upper- and lower-bounds. If the estimated F-statistics value is higher than the upper bound critical values, then the null hypothesis of no co-integration is rejected (there is co-integration among the variables). If the value is lower than the lower bound critical values, the null hypothesis of no co-integration is not rejected (there is no co-integration among the variables). If the estimated value of F-statistics lies between the two critical values, the conclusion is indecisive.From the bounds test, if a hypothesis of long-run relationship among the variables is accepted, then the long-run elasticity can be estimated from the following equation.
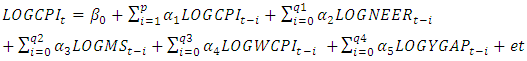 | (4) |
We can estimate the error correction term after the confirmation of long-run relationship among the variables. The short run relationship can be modeled as follows: | (5) |
 is the coefficient of the error (or equilibrium) correction term (ECT) or it is called adjustment coefficient. It shows how much of the equilibrium error is corrected each period. The error correction term indicates the speed of adjustment due to any short-run disequilibrium after a shock. A negative and statistically significant error correction term certifies the coming together of the dynamics to the long-run equilibrium. It should be noted that the speed of adjustment to equilibrium is dependent upon the magnitude of adjustment coefficient, meaning that:
  , then nearly 100 percent of the adjustment takes place within the period (in this case, quarterly) or the adjustment is very fast.
  , then about 50 percent of the adjustment takes place each period. And
  , then there is no adjustment.Most of the time, the dynamic features of a VECM are scrutinized by conducting two types of structural analysis – the variance decomposition and impulse response function. The variance decomposition analysis describes the proportional contribution in a variable’s variance explained by all the variables after a shock given to the system. The impulse response function measures the effect of an impulse in one variable on the other variable in later periods.
3. Results and Discussion
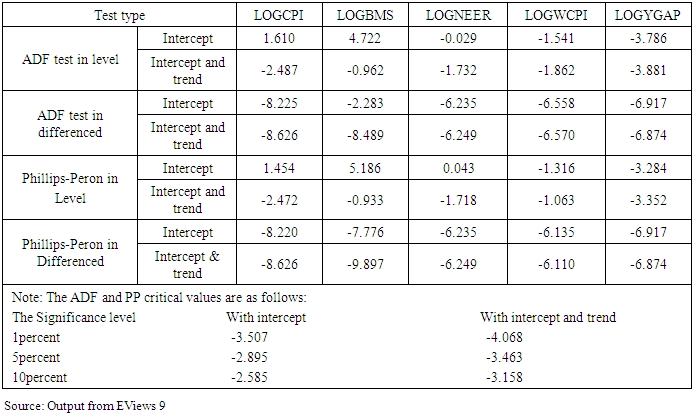
Unit Root TestIn order to get stationary series, a stochastic process requires the mean, variances and auto-covariance to be finite and independent of time. Hence, it is crucial to know whether the variables under study have a real economic relationship or not. To test for stationary, the study has used the Augmented Dickey Fuller (ADF) and Phillips-Peron (PP) unit root test. Augmented Dickey-Fuller and Phillips-Peron test results are presented in Table 1. According to the table, all the variables are stationary at first difference. However, money supply and output gap are stationary at level and at first difference. Therefore, it is integrated of order 1 or I (1). There is no variable that is stationary at second difference and hence, the test results of the ADF unit root test can be justified for using the ARDL approach (bounds test approach of co-integration).Table 1. Augmented Dickey-Fuller and Phillips-Peron Unit Root Test
 |
| |
|
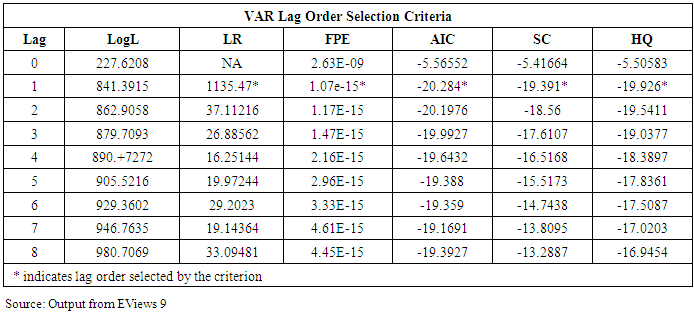
Lag length Selection CriteriaThe selection of the optimal lag length is essential for the precision of the outcome. If the lag length is too small, then the serial correlation in the errors will bias the test result. However, if the lag length is too large, then the power of the test will suffer. This leads to the fact that there is some optimal lag length (Mohammadnur, 2012, p, 26). According to the result presented in Table 2, all information criteria like Akaike Information Criterion (AIC), Final Prediction Error (FPE), Likelihood Ratio (LR), Schwartz Information Criterion (SIC), and Hannan-Quinn Information Criterion (HQ) suggests that the lag length to be one. Hence, the study has selected the optimal lag length of one.Table 2. Lag Length Selection Criteria
 |
| |
|
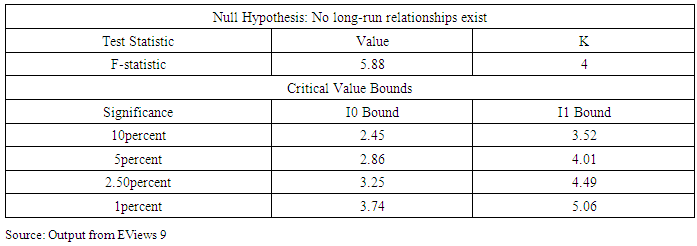
Bound TestThe guide line for the bound test is that if the F test statistic falls below the lower bound, then there is no co-integration. However, if the F test statistic is greater than the upper bound, then we can assume that there is co-integration. On the other hand, if the F-statistic lies between the both the critical values, then the test is inconclusive. The following Table (Table 3) shows that the computed value of F-statistic (5.88) is greater than the upper bound value of F-statistic at 10 percent (3.52), at 5 percent (4.01), at 2.5 percent (4.49), and at 1 percent (5.06) level of significance. Hence, we can reject the null hypothesis of no long run relationship. Therefore, we can conclude that there is long-run relationship among the variables. After checking for the long-run co-integration between the dependent and explanatory variables, the next step is to estimate the long-run coefficients.Table 3. Bounds Testing
 |
| |
|
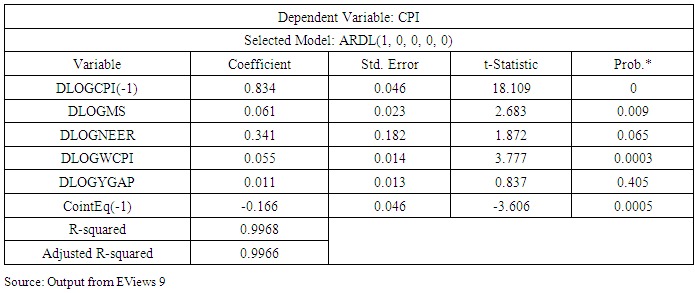
The Short-run Relationship between CPI and NEER, YGAP, WCPI and MSThe short-run elasticity of the CPI is depicted in table 4. It can be seen from the table that in the short-run, nominal effective exchange rate is not a significant factor affecting CPI. However, there is a positive relationship between the broad money supply and the CPI in the short run. If the broad money supply increases by one percent, then the CPI increases by about 0.061 percent. Also, there is a relationship between the world commodity prices and the CPI in the short-run. The coefficient of world commodity prices is 0.055 which would mean that a one percent increase in the world commodity price increases the domestic price by almost 0.055 percent. Table 4 also indicates the error correction term. The speed of adjustment from previous quarter’s disequilibrium in domestic prices to current quarter’s equilibrium is about 16.6 percent in one period (one quarter).Table 4. The Short-run Relationship between CPI and NEER, YGAP, WCPI and MS
 |
| |
|
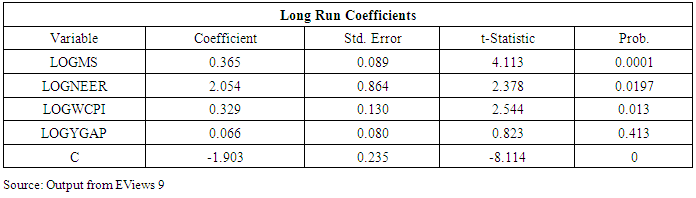
The diagnostic test shows that there is no serial correlation and Heteroscedasticity problem. However, the residuals are not normally distributed. The existence of normality problem does not affect and distort the estimators’ unbiasedness and consistency property as the main purpose of normality tests is for inference (testing hypothesis about the population parameter). Therefore the in-existence of vector normality in this model will not affect our estimates.The Long-run Relationship between CPI and NEER, YGAP, WCPI and MSThe long run relationship between the variables is depicted in table 5. The table shows that there is a significant and positive relationship between CPI and broad money supply, nominal effective exchange rate (devaluation), and world commodity prices. Specifically, this would mean that if domestic currency (the Birr) is devalued by one percent, then the CPI will rise by 2.1 percent in the long run. The relationship between the broad money supply and CPI shows that if the broad money supply increases by 1percent, then the CPI will increase by 0.37 percent in the long run. The relationship between world commodity prices and CPI shows that if the world commodity price index increases by one percent, then the CPI will increase by 0.33 percent. Thus, on the basis of the long run result, we can conclude that nominal effective exchange rate (devaluation of the Birr); money supply and world commodity prices are the most significant factors that affect the CPI in Ethiopia.Table 5. The Long-run Relationship between CPI and NEER, YGAP, WCPI and MS
 |
| |
|
However, the result of the model indicates that there is no significant relationship between output gap and the CPI. Hence, it can be concluded that, in the long run, output gap does not affect the CPI significantly. The insignificance of output gap on the CPI in Ethiopia may be because of the predominance of the agricultural sector in total output of the country. It is seen that, except for the last three quarters, for the study period as a whole, agriculture is the largest contributor to the national output and hence, agricultural sector is the dominant sector in Ethiopia. The higher contribution of agricultural sector to the total output may have negatively affected the commodity prices.In equation form, we can rewrite the results as follows:LOGCPI = 0.0655*LOGYGAP + 0.3649*LOGMS + 2.0542*LOGNEER + 0.3295*LOGWCPI -1.9029 Stability TestThe study tested the stability of the selected ARDL based on error correction model using cumulative sum of recursive residuals (CUSUM) and cumulative sum of squares of recursive residuals (CUSUMSQ) stability testing technique. CUSUM and CUSUMSQ plots have been shown in the below Figures (Figure 1.a and 1.b). Since both the plots remain within the critical bounds at 5 percent level of significance, we can conclude that the model is structurally stable.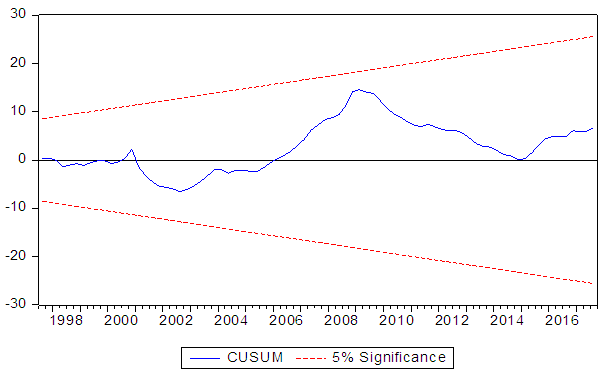 | Figure 1a. Plots of Cumulative Sum of square of Recursive Residuals (Source: Output from EViews 9) |
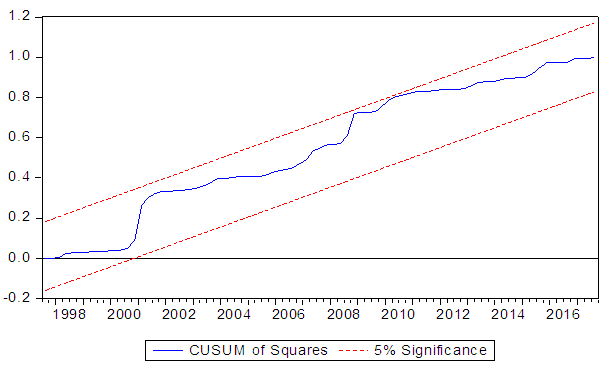 | Figure 1b. Plots of Cumulative sum of Recursive Residuals (Source: Output from EViews 9) |
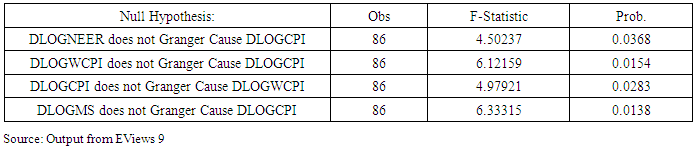
Granger Causality TestThe result of the Granger causality test is depicted in table 6. It can be seen from the table that there is Granger causality between CPI and explanatory variables (NEER, WCPI, and MS). More specifically, there is a unidirectional Granger causality running from money supply and nominal effective exchange rate to CPI. However, the granger causality between CPI and world commodity price index are bidirectional. Thus, the result establishes a long-run relationship between the CPI (dependent) and NEER, WCPI, MS as was also revealed by the bound test. Table 6. Pairwise Granger Causality Tests
 |
| |
|
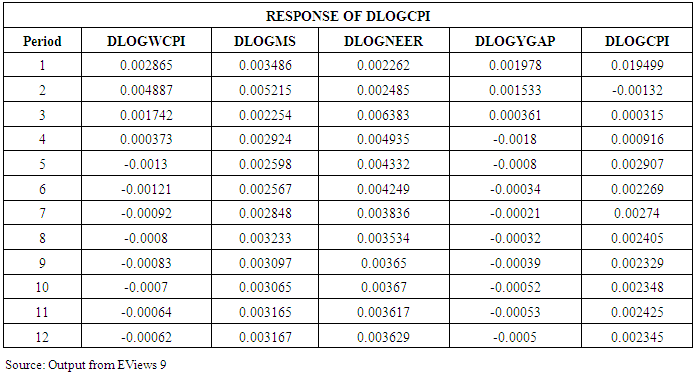
Analysis of Impulse Response and Variance DecompositionImpulse Response Impulse response function shows the impact of a one standard deviation shock to one of the innovations (shock, impulse, residuals, and error terms) on the current and future values of the endogenous variables. This helps us to analyze the reaction of one variable on other variables due to a shock. Response of Consumer Price IndexAs can be seen from table 7, the CPI responds positively to a shock in the nominal effective exchange rate over the whole period and the magnitude of the response increases up to the fourth quarter. But after the fourth quarter, it decreases up to 8th quarters and remained almost the same for the next quarters. This implies that a one standard deviation shock to nominal effective exchange rate (devaluation) leads to a 0.23 percent increase in the CPI after first quarter. However, the result shows a slight rise in the response of the CPI in the subsequent quarters as it is 0.25 percent in the second quarter and 0.64 percent in the third quarter as a result of one standard deviation shock to the exchange rate. However, the response falls to 0.38 percent after seventh quarter and then remained constant for the next quarters. The positive response of CPI to the exchange rate is justifiable because the depreciation of currency generally leads to a rise in the imported intermediate and finished goods which in turn impose a pressure on the CPI.Table 7. Impulse Response of Consumer Price Index
 |
| |
|
The CPI has also responded positively to a shock in money supply. Exactly, a one standard deviation shock in money supply (an expansionary monetary policy) will result in an increase in the CPI by about 0.35 percent after the first quarter and 0.52 percent after the second quarter. However, the response of CPI becomes fixed at about 0.33 percent for the next quarters. The response of CPI to money supply is as expected. This is because an increase in money supply leads to an increase in the demand for goods (domestically produced and imported) and hence will lead to an increase in the CPI.Similarly, the CPI also responds positively to its own shocks for all the periods except the second quarter. At the first quarter, the CPI responded by about 1.95 percent to a one standard deviation shock in itself although the effect is negative in the second quarter by about 0.13 percent. However, for the rest of the periods, the response becomes fixed at about 0.25 percent after the fifth quarter. The response of CPI to its own shock is also as expected and justifiable. Whenever there is a shock in CPI today; the consumers will expect another higher shock in CPI (inflation) in the next period. This situation is known as inflation due to inflationary expectations. Workers may expect a higher inflation in the next period if there were inflation in the previous period and this may make them to demand higher money wages so as to have constant real wages. When the wage is increased, it may lead to an increase in the demand as well as the cost of production and may accelerate the inflation. Hence, the response of consumer price to its own impulse is in conformity with the theory of inflation expectations.While coming to the relationship between CPI and the global commodity prices, the CPI changes positively as a result of the shock in global commodity prices. The response (increase) is 0.29 percent as a result of one standard deviation shock in global commodity prices at the end of the first quarter and reaches its maximum of 0.49 percent at the second quarter. However, it should be noted that the CPI responds negatively (with very small magnitude near to zero) after one year. The short run response of CPI to shock in global commodity prices is reasonable. When there is an increase in the global commodity prices, it influences and increases the CPI in Ethiopia. This is because Ethiopia depends heavily on imported (intermediate and final) goods and services. The rise in the price of imported final goods are directly reflected in CPI whereas if the imported good is an intermediate good it increases the cost of production and hence indirectly leads to an increase in the price of domestic goods as firms are forced to raise the price to accommodate the increase in the cost of production.Finally, the CPI also responds positively to the shock in output gap up to the third quarter and the response is negative after the end of third quarter. More specifically, a one standard deviation shock to output gap results in 0.20 percent, 0.15 percent, 0.036 percent increases in CPI in the first, second, third quarters respectively although it is negative in the next quarters. The positive response of CPI to a shock in output gap shows that the actual output is greater than potential output up to the third period. This leads to an increase in demand which in turn results in an increase in price and ends in inflation. The negative response of CPI to a shock in output gap after the third period shows that the actual output falls short of the potential output. This may lead to a deficiency in demand and will eventually lead to a deflation. Exchange Rate Pass-through in EthiopiaThe exchange rate pass-through to consumer price index in Ethiopia is given in figure 2. The figure shows the exchange rate pass-through to CPI for the first 12 quarters from the total observations. Accordingly, one percent devaluation in nominal exchange rate results in an increase of CPI by about 3.02, 7.27, 2.75, and 2.66 percent in the first, second, third and fourth quarters respectively. In other words, it can be interpreted as the relationship between exchange rate and inflation. As can be observed from the figure a one percent devaluation of nominal exchange rate results in an increase of inflation by 3.92 percent after one year and the shock falls to one percent after three years. The pass-through coefficient found in our study is slightly lower than the pass-through coefficient found by Mohammadnur (2012) for Ethiopia although the coefficient is slightly higher than that of Helen (2012) and Mekasha and Molla (2010) for the country.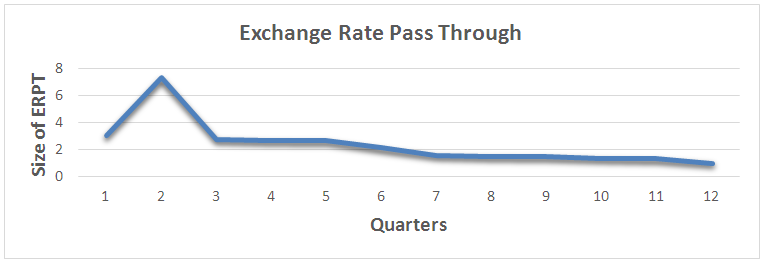 | Figure 2. Exchange rate Pass-Through to CPI in Ethiopia (Source: Output from MS excel) |
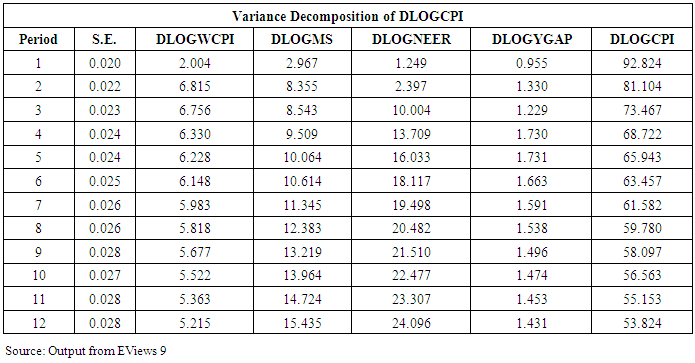
On the basis of this study, we can conclude that the exchange rate pass-through in Ethiopia for the period under consideration is incomplete (less 100 percent).Variance Decomposition of Consumer Price IndexThe variance decomposition of CPI indicates that, in the initial period, the CPI explains 92.82 percent of its own variation (Table 8). However, during the second period (quarter), only about 81.10 percent of the variation is explained by its own innovations. The contribution of broad money supply and the world commodity prices, in the first quarter, comes to be about 2.97 percent and 2 percent respectively in the variations in the CPI. Table 8. Variance Decomposition of Consumer Price Index
 |
| |
|
In the long run, 53.83 percent portion of the consumer prices error variance is explained by its own innovation, whereas money supply and nominal effective exchange rate contributes to 15.43 percent and 24 percent portion of consumer prices error variance respectively. Thus, the variance decomposition of CPI is largely explained by its own variation. This finding is in conformity with the study of Helen (2012) and Mohammadnur (2012) in Ethiopia. However, the effects of money supply and nominal effective exchange rate on CPI goes on increasing over time. This underlines that the effect of money supply and nominal effective exchange rate on inflation is larger in the long run. The effect of output gap on the variance of CPI goes on decreasing over time although the effect of nominal effective exchange rate, world commodity price and money supply increases over time.
4. Conclusions
In Ethiopia, inflation has been very high and among the factors, the devaluation of domestic currency, increase in money supply and an increase in the world commodity prices were perceived to be the most important. It was in this context of high inflation and foreign exchange crunch, that the World Bank has advised the country to devaluate its currency. In accordance with the advice, the National Bank of Ethiopia has devalued its currency by 15 percent in 2017 and this has accelerated inflation in the country. The specific objective of this study was to examine the effect of devaluation of Birr on the domestic prices along with the effect of changes in Money Supply, world commodity price index and the output gap on the Consumer Price Index in Ethiopia. It was found from our analysis that in the short run, devaluation of nominal effective exchange rate has no significant effect on the CPI. However, money supply and the world commodity prices were found to be the variables significantly affecting the consumer prices in the short run. The result of the ARDL test revealed that nominal effective exchange rate, money supply and world commodity prices were the significant variables affecting the consumer prices in the long run. As such, it is clear that devaluation of the nominal effective exchange rate increases the consumer price index in Ethiopia. However, the exchange rate pass-through to consumer prices in Ethiopia was moderate. Hence, it can be concluded that devaluation definitely causes inflation in the country. This may be partly due to the increase in government debt and due to an increase in the cost of public investment. Therefore, we may suggest avoiding continuous and high devaluation of Birr to the extent possible to avoid the evil consequences on the economy. From the impulse response test, it was found that the consumer price index responded positively to its own shock, to the changes in the nominal effective exchange rate (devaluation), money supply and world commodity prices. Our analysis of the Granger causality test revealed that the nominal effective exchange, money supply and world commodity prices have granger causality on the consumer prices. As it was found that output falls short of potential output in Ethiopia, to accelerate economic growth in the country, the government may increase the money supply in accordance with the increase in output. The increase in aggregate demand due to an increase in money supply will match with the increase in productive capacity of the economy. However, the government should be careful about the inflationary effect of money supply as the increase in money supply may lead to inflation.The government may also seek alternative avenues to boost exports and to solve the problem of deteriorating the foreign exchange. To boost exports, the government may introduce financial concessions like provision of cheap credit, decrease in tax rate and announcement of tax holidays along with subsidies to those domestic firms engaged in exports along with the export diversification strategy. The government may also resort import substitution strategy so as to tide over the foreign exchange crisis. If the government resort import substitution by producing previously imported goods domestically will help the government to control inflation. Moreover, import substitution may also help the government to reduce the adverse effects of world commodity price index on the domestic consumer price index.
References
| [1] | Agenor, P.R. and Montiel, P.J. (2015): Development Macroeconomics, Princeton University Press, 4 th Edition, p. 331. |
| [2] | Arabi, M. K. (2015): Exchange-Rate Pass-Through: Empirical Evidence from Sudan Economy, Journal of Applied Economics and Business, University of King Khalid, Saudi Arabia, Editorial board, 5, Vol. 3, Issue 3. pp. 5-24. |
| [3] | Bangura, M., Caulker, E. and Pessima, S. (2012): Exchange rate pass - through to inflation in Sierra Leone: A structural vector autoregressive approach, West African journal of monetary economics, 12 (1), pp. 94-123. |
| [4] | Bhattacharya, R., Patnaik, I. and Shah, A. (2008): Exchange rate pass-through in India. National Institute of Public Finance and Policy, New Delhi. |
| [5] | Bwire, T., Anguyo, F.L. and Opolot, J. (2013): A Re-estimation of Exchange Rate Pass-through to Domestic Prices in Uganda: Evidence from a Structural Vector Auto-Regression, Bank of Uganda, Working Paper No. 05/2013. pp. 2-16. |
| [6] | Central Statistical Agency. (2018): Government of Ethiopia, General year-on-year inflation increases, http://www.ena.gov.et/en/index.php/economy/item/4263. |
| [7] | Cheikh, N. B. and Louhichi, W. (2014): Measuring the Impact of Exchange Rate Movements on Domestic Prices: A Cointegrated VAR Analysis, FIW Working Paper, No. 131. |
| [8] | Faryna, O. (2016): Nonlinear Exchange Rate Pass-Through to Domestic Prices in Ukraine, Visnyk of the National Bank of Ukraine, No. 236, pp. 30–42. |
| [9] | Helen, B. (2012): Exchange Rate Pass-Through to Import and Consumer Prices: Evidence from Ethiopia, Addis Ababa University, Addis Ababa, pp. 2-137. |
| [10] | Hufner, F. P. and Schroder, M. (2002): Exchange Rate Pass-Through to Consumer Prices: A European Perspective, Center for European Economic Research, Discussion Paper 02-20, (Mannheim, Germany: Center for European Economic Research). |
| [11] | Mekasha, T. J. and Molla. K. G. (2015): Exchange Rate Pass-Through and Prices: Evidence from Sub-Saharan Africa with a Focus on Ethiopia, Working Paper. |
| [12] | Mohammed, A. A., Mati, S. and Hussaini, M. (2017): Exchange Rate Pass-Through Elasticity to Domestic Consumer Prices in Nigeria and Taylor’s Hypothesis: A Structural Vector Auto Regression Analysis, American Journal of Economics, 7 (5), pp. 201-210. |
| [13] | Mohammadnur, B. (2012): Exchange rate pass-through in Ethiopia, Addis Ababa University, Addis Ababa. |
| [14] | Mushendami, P. L. and Namakalu, H. (2016): Exchange Rate Pass Through to Inflation in Namibia, Journal of Emerging Issues in Economics, Finance and Banking, Vol. 5, Issue: 2. |
| [15] | Mwase, N. (2006): An Empirical Investigation of the Exchange Rate Pass-Through to Inflation in Tanzania, IMF Working Papers 06150, Washington, D.C. |
| [16] | National Bank of Ethiopia, (October 10, 2017/ 1:48 PM/ IN 7 MONTHS), Retrieved from https://0x9.me/N85BR. |
| [17] | Ntsosa, M.M. and Nkwe, P.T. (2016): Testing the Exchange Rate Pass-through in Botswana, IJABER, Vol. 14, No. 3. pp. 1789-1804. |
| [18] | Rowland, P. (2004): Exchange Rate Pass-Through to Domestic Prices: The Case of Colombia, Central Bank of Colombia. |
| [19] | Sisay, M. (2008): Determinants of Recent Inflation in Ethiopia, Retrieved from https://mpra.ub.uni-muenchen.de/29668/. MPRA Paper No. 29668. |
| [20] | Wimalasuriya, S. (2009): Exchange Rate Pass-Through: To What Extent do Prices Change in Sri Lanka?, Staff Studies, 37 (1). pp. 49-67. |

 Abstract
 Reference
 Full-Text PDF
 Full-text HTML