Amrita Bhattacharya
Department of Economics, Southern Illinois University, Carbondale
Correspondence to: Amrita Bhattacharya, Department of Economics, Southern Illinois University, Carbondale.
| Email: |  |
Copyright © 2018 The Author(s). Published by Scientific & Academic Publishing.
This work is licensed under the Creative Commons Attribution International License (CC BY).
http://creativecommons.org/licenses/by/4.0/

Abstract
This paper estimates the elasticities of substitution and partial elasticities of the tobacco industry in the United States. With the help of translog cost function, I analyze the process of technical innovation in the tobacco industry in United States. The analysis is carried out over the over the sample period of 1985-2005 using seemingly unrelated regression techniques. Empirical results suggest that on average physical capital shows large degree of substitutability with labor, materials and energy in the tobacco industry over the whole sample period when the model is non-homothetic and has non-neutral technical change except for materials and energy being complements.
Keywords:
Translog cost function, Technology, Tobacco industry, United States
Cite this paper: Amrita Bhattacharya, Technological Innovation in Tobacco Industry in the United States: A Translog Cost Function Framework, American Journal of Economics, Vol. 8 No. 3, 2018, pp. 123-137. doi: 10.5923/j.economics.20180803.02.
1. Introduction
The big business of tobacco is global in nature, and each part of the tobacco business, from growing the leaf to manufacturing products, contributes to the multi-billion-dollar tobacco industry. Tobacco prices are central to industry marketing strategies, and it is the tobacco industry that sets the prices of its tobacco products. Cigarettes are a largely uniform product, easily manufactured at low cost on a global scale. Prices of tobacco products are of great interest to the public health community because they play such a pivotal role in people’s decisions to use tobacco. In this paper with the help of translog cost function, I analyze the process of technical innovation in the tobacco industry in United States. Translog production function has been used by many past researchers for investigating the technological change and the elasticities of substitution among the input factors in the agricultural sector.Utterback (1994) explores how innovation transforms industries, suggesting a strategic model to help firms to adjust to ever-shifting market dynamics. Teece (1986) explains why innovating firms often fail to obtain significant economic returns from an innovation, while customers, imitators and other industry participants benefit. Garcia et al. (2002) suggests a method for classifying innovations so that practitioners and academics can talk with a mutual understanding of how a specific innovation type is identified and how the innovation process may be unique for that particular innovation type. Howell et al. (1990) investigated the personality characteristics, leadership behaviors, and influence tactics of champions of technological innovations. The study found that champions exhibited higher risk taking and innovativeness, initiated more influence attempts, and used a greater variety of influence tactics than non-champions. Explores the impact of process management activities on technological innovation. Benner et al. (2002) suggest that research in organizational evolution reduce variance in organizational routines and influence the selection of innovations, they enhance incremental innovation at the expense of exploratory innovation. Freeman (2009) examines the historical record of the ascendancy of science-related technology in modern economies and presents an economic theory of innovation based on that record and it implications for policy-makers. Hill (2017) identify a number of factors that help to explain incumbent performance in markets shaken by a radical technological innovation. Scherer (1986) draws essays from a body of work strongly influenced by the thought of Joseph A. Schumpeter. Each essay tests the hypotheses derived from the Schumpeterian propositions that technological innovation radically increases real income per capita in Western industrialized nations and also monopoly market structures and their pursuit are a powerful engine of technological progress. (Zellner 1962) suggests that efficiency gains resulting from joint estimation tended to be larger when the explanatory variables in different equations weren’t highly correlated but the disturbances from these equations were highly correlated. Microeconomics related research involving seemingly unrelated regression techniques involves; examining how the level of regulation affects the size distribution of businesses (Calcagano and Sobel, 2013); capturing the interdependence of maize crop residues in Ethiopia (Jaleta et al, 2015). Beierlein, Sirilli et al. (1998) provides empirical evidence on technological innovation in the service sector and manufacturing. The study suggests that technological innovation is a diffused and variegated phenomenon in market services. Engineering, technical consultancy, computing and software are the most innovative sectors. Innovation expenditure per employee in these industries is rather close to the manufacturing average. Service firms as well as the manufacturing ones rely on a wide range of innovation sources. Cardinal (2000) examines the impact of organization-wide controls on innovativeness at the firm level. The results challenge several important features of existing models of R&D management and diverge from common beliefs about R&D management at the project level. Gilbert (1996) investigates in detail, through the reflections of individuals within the company, the activities and behaviors that have led to the successful introduction of technology change. Utterback (2017) discusses how environmental factors, primarily the definition and communication of needs for innovation and secondarily the existence and communication of technical information, are viewed as both stimulating and limiting the firm's potential for innovation. Internal factors which affect the synthesis of information into ideas and solutions to development problems are also viewed as influencing the effectiveness of the firm in response to its environment. These include diversity in task assignments and the organizational relationships between technical and administrative personnel. Similarly, the paper also discusses the barriers to communication between the firm and its environment, for a given set of internal characteristics, are viewed as limiting the firm's response.This paper estimates the elasticities of substitution and partial elasticities of the tobacco industry in the United States. With the help of translog cost function, I analyze the process of technical innovation in the tobacco industry in United States. The analysis is carried out over the over the sample period of 1985-2005 using seemingly unrelated regression techniques. Empirical results suggest that on average physical capital shows large degree of substitutability with labor, materials and energy in the tobacco industry over the whole sample period when the model is non-homothetic and has non-neutral technical change except for materials and energy being complements.
2. Methodology
2.1. Model
We make the following assumption that in the tobacco industry sector there exists a twice differentiable aggregate production function which relates the flow of gross output (Y) to the services of four inputs: capital (K), labor (L), energy (E) and all other intermediate materials (M).Mathematically, it can be written as: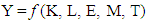 | (1) |
where, T is a technological index. From the theory of duality, there always exists cost and production functions which are dual to each other. Hence, the cost function can be written as: 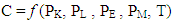 | (2) |
with, C being the total cost and PK, PL , PE , PM the respective input prices of K, L, E, M. Also, the above mentioned translog cost function places no a priori restrictions on the Allen partial elasticities of substitution and can be viewed as a simple second order approximation to an arbitrary twice differentiable cost function. In the general form, the translog function is given by: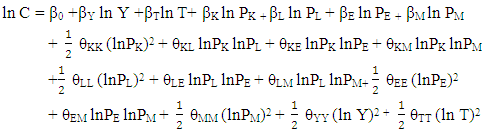 | (3) |
where, θij=θji (symmetry constraint); i, j=K, L, M, E. Moreover, the cost function must be homogenous of degree one in input prices. Hence, the following relationship among the parameters must hold: 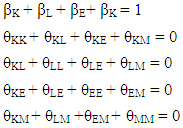 | (4) |
Furthermore, factor prices are fixed due to the assumption of perfect competition in the factor markets. Cost minimizing input demand functions are deduced by logarithmically differentiating (3) and by using Shephard’s Lemma [i.e substitute (dc/dPi)= i, i=K,L,M,E] giving the cost share equations for capital, labor, energy and intermediate materials are denoted by SK, SL, SE and SM, respectively. Hence, they are as follows:  | (5) |
 | (6) |
 | (7) |
 | (8) |
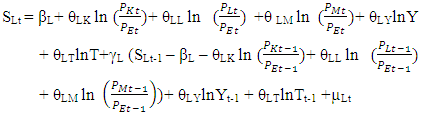
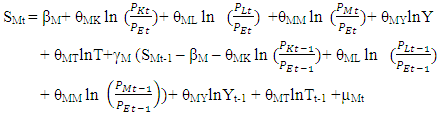
Now, following the parametric restrictions in (4), we are left with the following three equations. After adding the error component to these equations, these can be written as: | (9) |
 | (10) |
 | (11) |
For the translog cost function in (3), the Allen partial elasticities of substitution are given by: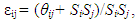 | (12) |
and 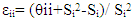 | (13) |
Here Si and Sj are the fitted values of the cost share equations and θii and θij are the estimated parameters from the seemingly unrelated regressions (SUR) procedure. It should be noted that by definition ηii and ηij are the same. Furthermore, positive ηij implies that the two factors are substitutes and negative ηij implies that the two factors are complements whereas ηij any equal to zero implies that the two factors are independent of each other. Hence, if εij>0, then the inputs i and j (already specified as K, L, M, E) where i≠j are substitutes for each other. On the other hand, if εij<0, then the inputs are complements. Allen elasticities of substitution are related to the price elasticities of demand for factors of production. Own and cross price elasticities of substitution explain how relative expenditure on factor inputs changes as the relative prices change. Thus, using Allen elasticities of substitution, the own price elasticity of demand for the ith factor of production is given by: | (14) |
 | (15) |
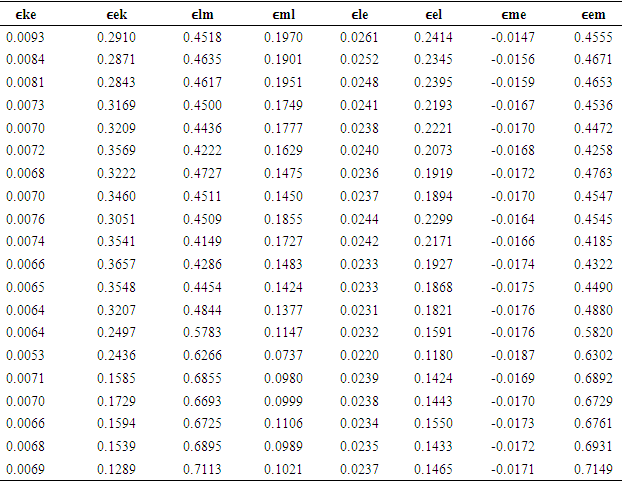
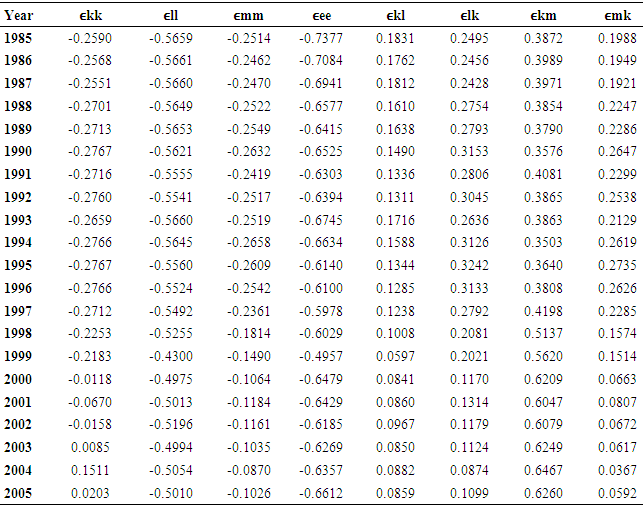
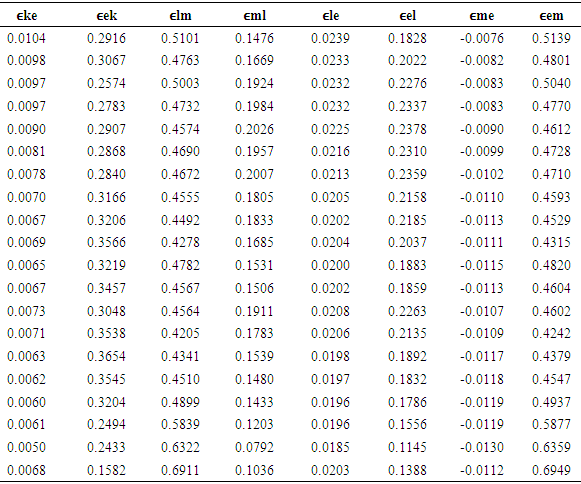
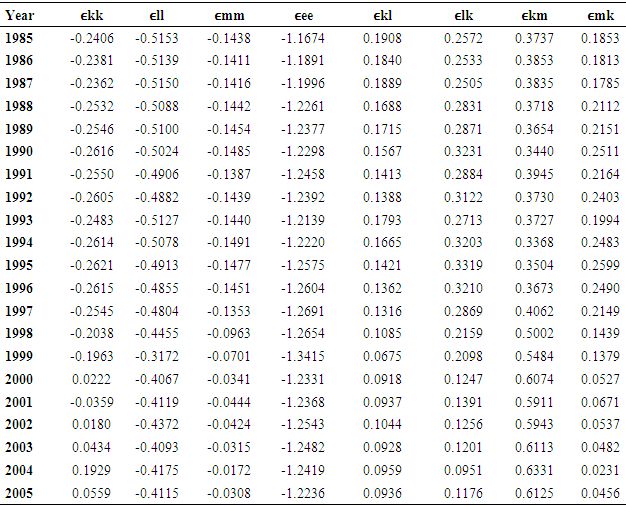
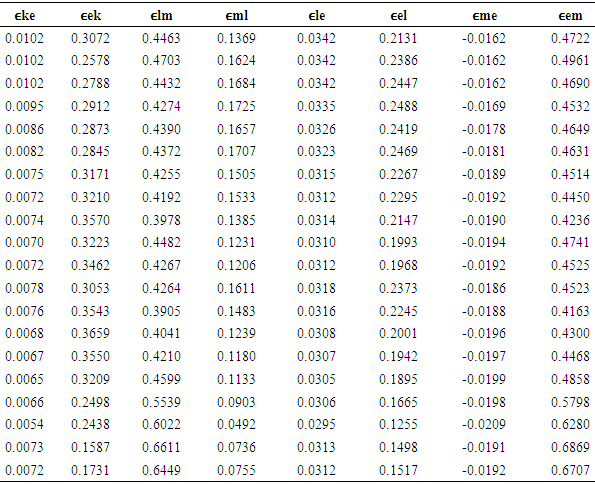
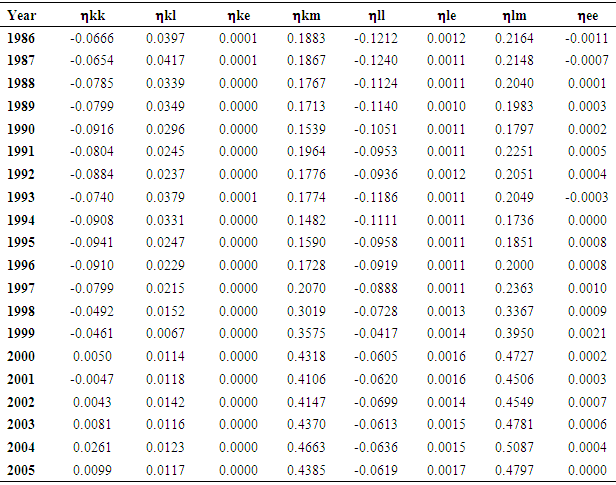
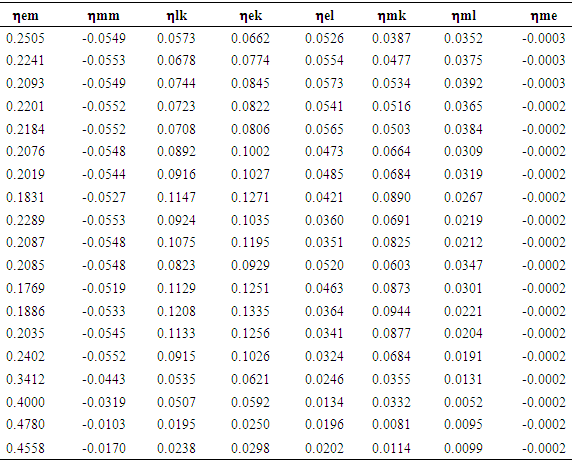
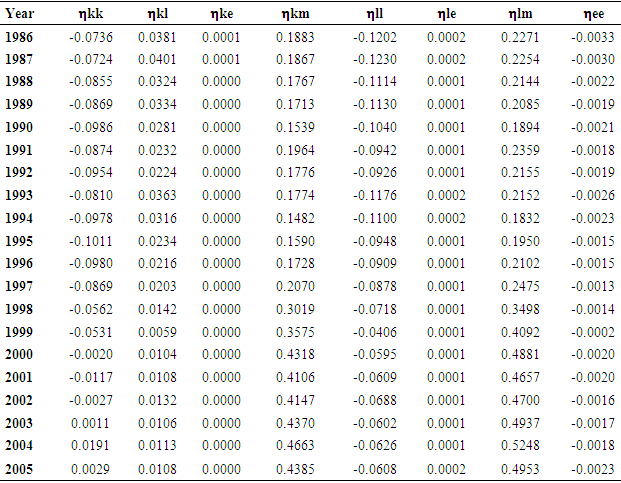
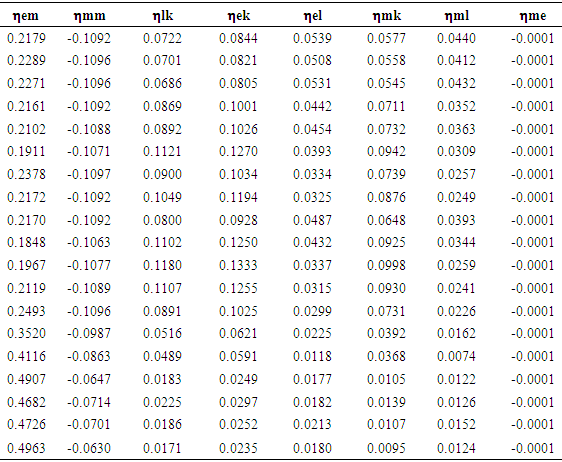
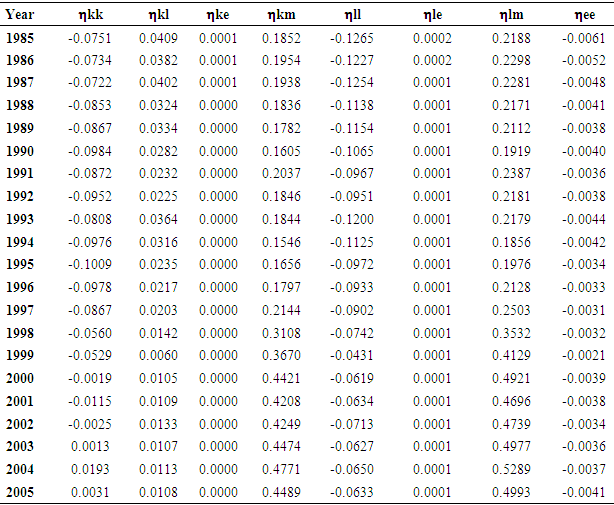
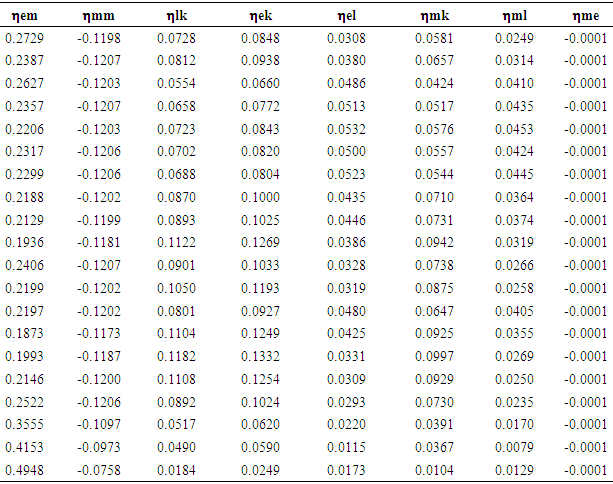
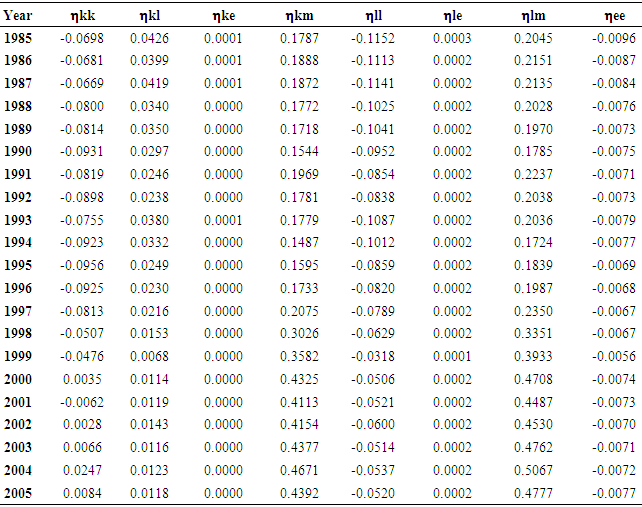
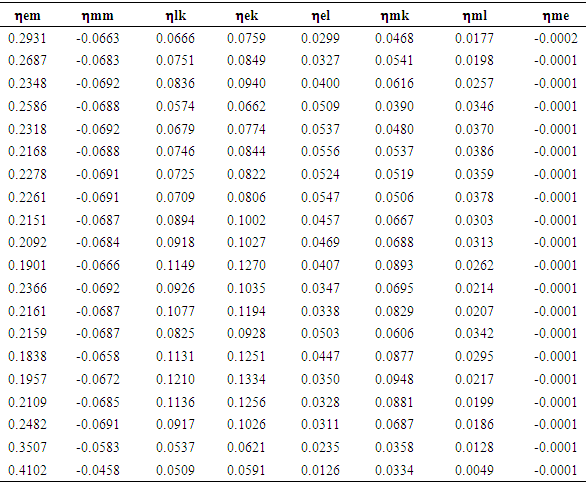
Equation (15) denotes the cross-price elasticity of demand for the ith factor of production given a price change in the jth factor of production. Allen elasticities of substitution, in general, tell us about the substitutability of various inputs for one another. Using our estimated parameters and fitted cost shares, we report Allen elasticities of substitution in Table 4 Appendix A. The commonly used specification to estimate the parameters of a cost function is to jointly estimate the share equations with symmetry and homogeneity restrictions on the parameters. We will carry the estimation procedure keeping in mind the above-discussed technique.
2.2. Estimation
To estimate an econometric model for production and technical change in the tobacco industry, we add a stochastic component to the set of cost share equations and estimate these subject to linear homogeneity and symmetry restriction on the parameters. Hence, we specify Model (I) consisting of four stochastic share equations as: | (16) |
 | (17) |
 | (18) |
 | (19) |
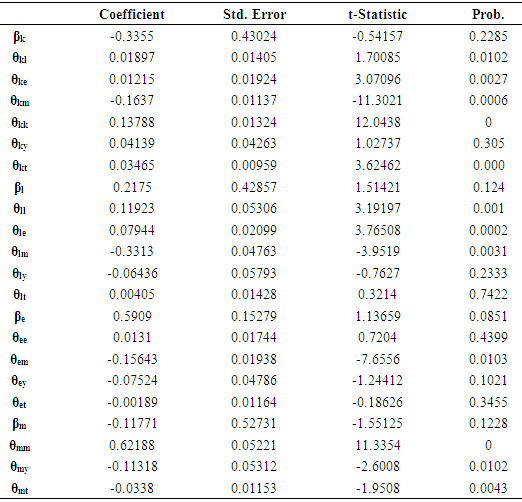
The random disturbances always sum to zero and the disturbances are hence, not independent since the cost shares in Model I sum to unity. Model I can be either estimated by Zellner’s (1962) seemingly unrelated regressions (SUR) procedure or by the general maximum likelihood method. However, before the analysis can be carried out, the cost shares equations from (16) to (19) along with an imposition of symmetry conditions on the parameters must be estimated by the Ordinary Least Squares (OLS) method. The OLS estimates are presented in Table 1 in Appendix A. The correlation matrix of the OLS residuals is provided below: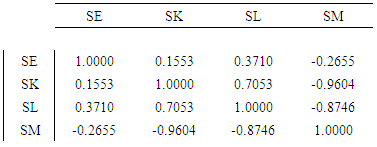 The correlation matrix exhibits that the residuals are highly correlated among the cost share equations. This justifies the use of the seemingly unrelated regressions (SUR) model to estimate the cost share equations because it takes care of the contemporaneous correlation among the cross-equation errors. Due to the dependence of the disturbances, the variance-covariance matrix in the Zellner’s procedure will be singular. Thus, it is not possible to estimate Model I by Zellner’s procedure until one of the share equations are deleted. Hence, I arbitrarily drop the SE equation since energy as an input is rarely used in the tobacco industry. Model (I) is thus estimated using Zellner’s iterative seemingly unrelated (SUR) procedure without the SE equation namely, the first stage. Results are presented in Table 2 in Appendix A. The autocorrelation function (ACF) and partial autocorrelation function (PACF) of the SUR residuals for each equation is analyzed to determine the error model. Most of the correlograms of the residuals indicate the existence of autoregressive process of order one, AR(1). To be consistent across, it is assumed that the error terms follow AR(1) process throughout. Random errors are assumed to be independent and identically distributed as normal variates. Before the final estimation, each share equation is corrected for autocorrelation. The corrected share equations are given by:
 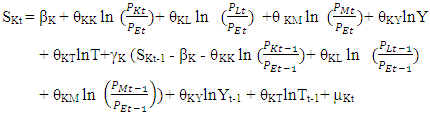 | (20) |
 | (21) |
 | (22) |
Thus, the equations in (20), (21), and (22), represent the lag adjustments of changing factor prices. Again, I estimate these equations by applying the iterative seemingly unrelated regression (ITSUR) technique imposing the symmetry conditions on the parameters. These estimates are reported in Table 3 of Appendix A.
3. Empirical Results
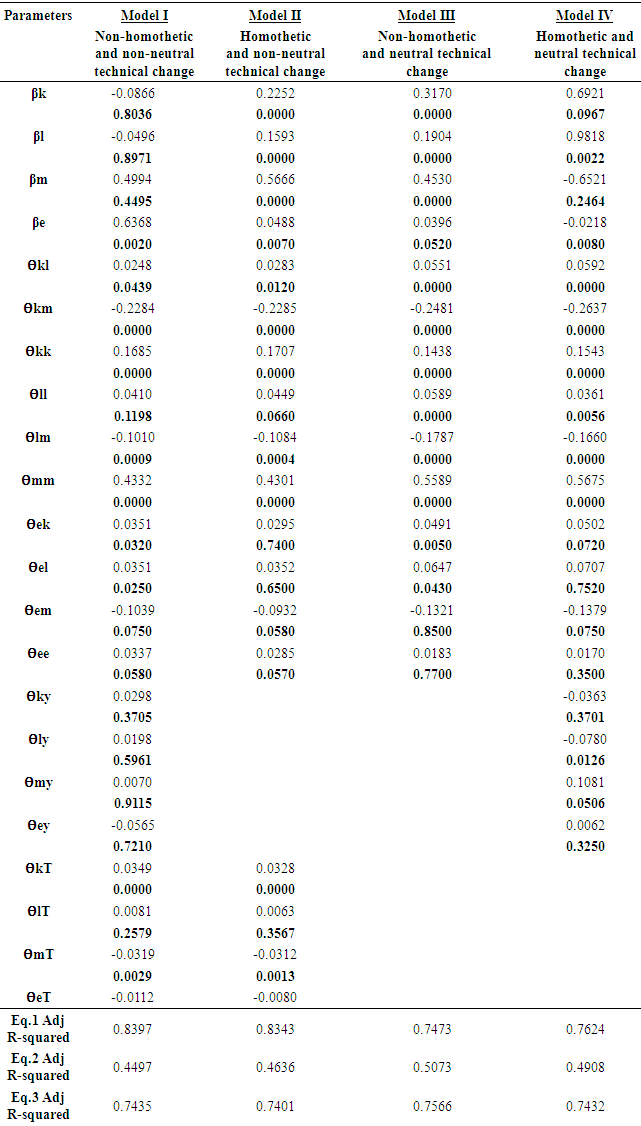
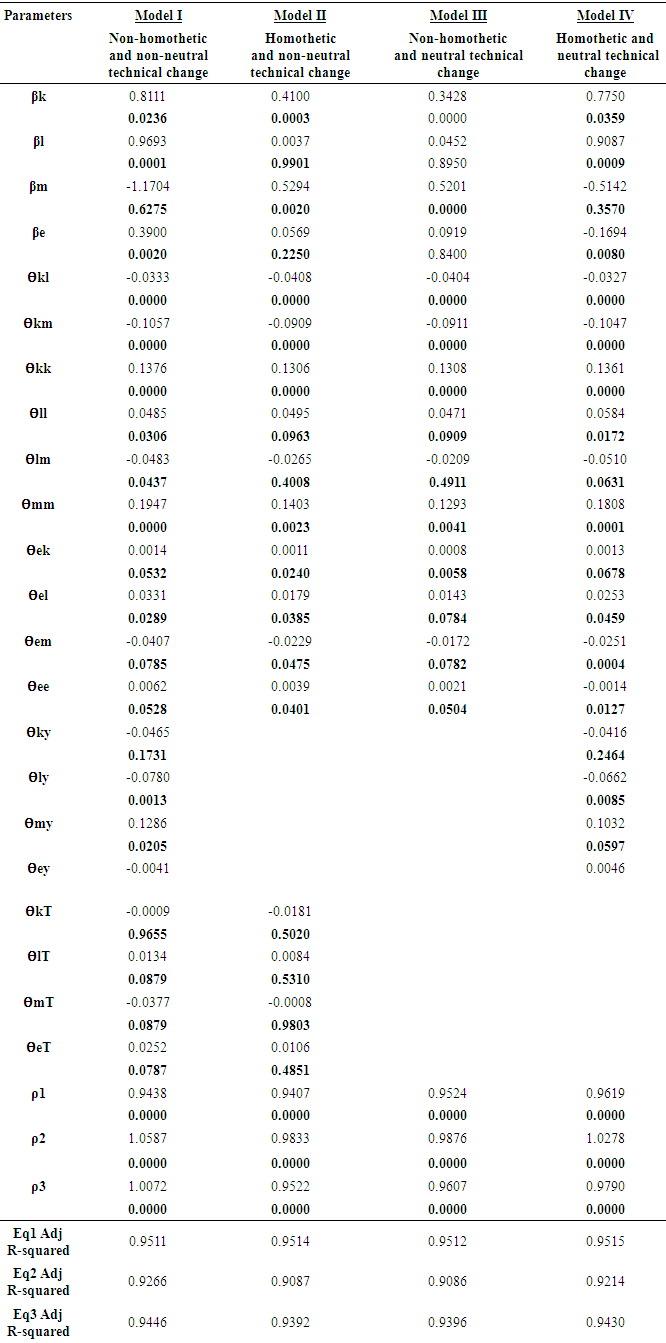
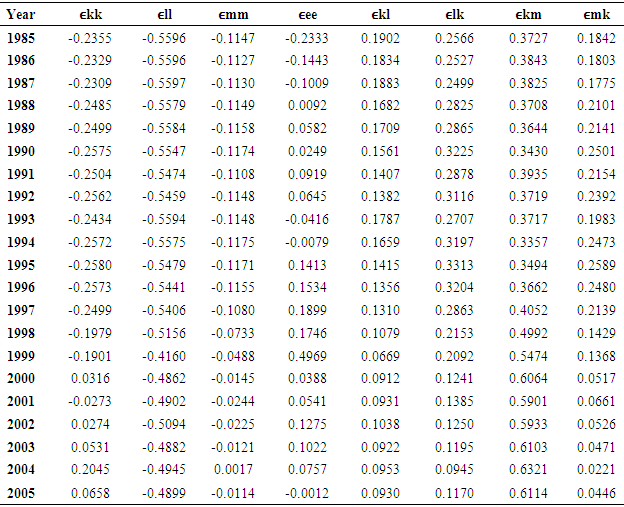
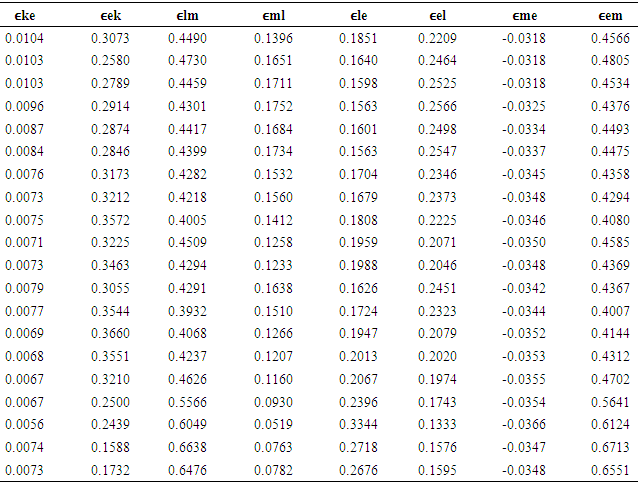
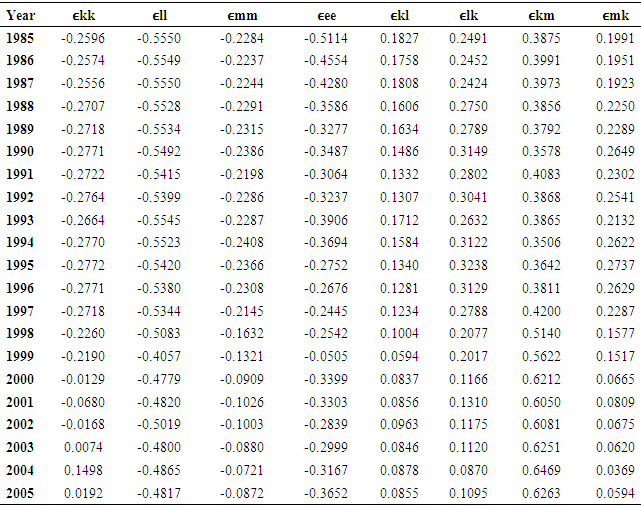
The data used in this study is annual and are drawn from the Harvard Data verse under Dale Jorgensen. The data used in the analysis ranges from 1960-2005. Therefore, the total number of observations in each model is 46. Following Sims, Takayama and Chao (1987), four different formulations of Model I are estimated. Estimation of Model I allows for non-homotheticity of the production function and non-neutral technical change. In Model 2, the production function is assumed to be homothetic, so that θiY=0, for all i. In Model 3, the assumption of homotheticity is relaxed but it is assumed that the technical change is neutral, i.e. θiT =0 for all i. In Model 4, both homotheticity and neutral technological change are assumed to hold i.e both θiY=0 and θiT =0 must hold. If θiT is not significant, it implies that technical change is neutral. Results in Table 2 will account for this as well. Significance of θiY‘s implies homotheticity of the production function. Results are reported in Table 3 in Appendix A. Using our estimated parameters and fitted cost shares from (12) to (15) I report Allen elasticities of substitution in Table 4 in Appendix A. Importance of Allen elasticities of substitution are justified by their relation to the price elasticities of demand for factors of production. Own and cross price elasticities of substitution explain how relative expenditure on factor inputs changes as the relative prices change. For the analysis, I obtained both own price elasticities of demand and cross price elasticities of demand for all the four factors; capital, labor, energy, and intermediate materials, used in the tobacco industry of the United States. Using the estimated Allen elasticities of substitution and the fitted cost shares, I report own and cross price elasticities of demand for all factors of production in Table 5 Appendix A. Note these are all reported for the four different formulations of Model I. The mean values of the respective tables are computed as well for easy interpretation. It is evident from Table 5 Appendix A that on average, physical capital shows substitutability with labor, materials and energy in the tobacco industry over the whole sample period when the model is non-homothetic and has non-neutral technical change. This was however not always the case because on average material and energy were found to be complements in the industry. Labor is found to be substitutes with all the other factors of input across all models.
4. Conclusions
The use of seemingly unrelated regressions to a simple translog cost function in order to estimate the cost share equations for the tobacco industry of the U.S. economy for a sample period of 1960 to 2005 allows us to deduce that on average physical capital shows large degree of substitutability with labor, materials and energy in the tobacco industry over the whole sample period when the model is non-homothetic and has non-neutral technical change with the exception of materials and energy being complements via Allen elasticities of substitution and price elasticities of demand for the production factors; capital, labor, energy, and intermediate inputs.
Appendix A
Table 1. (OLS Estimates)
 |
| |
|
Table 2. (SUR estimates)
 |
| |
|
Table 3. (SUR estimates)
 |
| |
|
Table 4. (Model I) [Allen Elasticities of Substitution]
 |
| |
|
Table 4. (Model I) [continued]
 |
| |
|
Table 4. (Model II)
 |
| |
|
Table 4. (Model II) [continued]
 |
| |
|
Table 4. (Model III)
 |
| |
|
Table 4. (Model III) [continued]
 |
| |
|
Table 4. (Model IV)
 |
| |
|
Table 4. (Model IV) [continued]
 |
| |
|
Table 5. (Model I) [Price Elasticities of Demand]
 |
| |
|
Table 5. (Model I) [continued]
 |
| |
|
Table 5. (Model II)
 |
| |
|
Table 5. (Model II) [continued]
 |
| |
|
Table 5. (Model III)
 |
| |
|
Table 5. (Model III) [continued]
 |
| |
|
Table 5. (Model IV)
 |
| |
|
Table 5. (Model IV) [continued]
 |
| |
|
References
| [1] | Avery Robert B. (1977). Error Components and Seemingly Unrelated Regressions. Econometrica, 45 (1), 199-208. |
| [2] | Beierlein, J. G., Dunn, J. W., & Mcconnon, J. C. (1981). The Demand for Electricity and Natural Gas in the Northeastern United States. The Review of Economics and Statistics, 63(3), 403. |
| [3] | Becchetti, Leonardo, and Castriota, Stefano, (2011). “Does Microfinance Work as a Recovery Tool after Disasters? Evidence from the 2004 Tsunami” World Development, Vol. 39, No. 6, pp. 898–912. |
| [4] | Calcagno, P. T., & Sobel, R. S. (2013). Regulatory costs on entrepreneurship and establishment employment size. Small Bus Econ Small Business Economics, 42(3), 541-559. Retrieved March 1, 2016. |
| [5] | Jaleta, M., Kassie, M., & Erenstein, O. (2015). Determinants of maize stover utilization as feed, fuel and soil amendment in mixed crop-livestock systems, Ethiopia. Agricultural Systems, 134, 17-23. Retrieved February 23, 2016. |
| [6] | Kmenta, J., & Gilbert, R. F. (1970). Estimation of Seemingly Unrelated Regressions with Autoregressive Disturbances. Journal of the American Statistical Association, 65(329), 186-197. |
| [7] | Kakwani, N. C. (1967). The Unbiasedness of Zellners Seemingly Unrelated Regression Equations Estimators. Journal of the American Statistical Association, 62(317), 141. doi:10.2307/2282917. |
| [8] | Loayza, N. V., & Raddatz, C. (2010). The composition of growth matters for poverty alleviation. Journal of Development Economics, 93(1), 137-151. doi:10.1016/j.jdeveco.2009.03.008. |
| [9] | Mcelroy, M. B. (1977). Goodness of fit for seemingly unrelated regressions. Journal of Econometrics, 6(3), 381-387. |
| [10] | Metzler, Johannes, and Ludger Woessmann, (2012). “The Impact of Teacher Subject Knowledge on Student Achievement: Evidence from Within-Teacher Within-Student Variation” Journal of Development Economics, Vol. 99, No. 2, pp. 486–496. |
| [11] | Norman, Loayza, and Claudio Raddatz, (2010). “The Composition of Growth Matters for Poverty Alleviation” Journal of Development Economics, Vol. 93, No. 1, pp. 137–151. |
| [12] | Percy David F. (1992). Prediction for Seemingly Unrelated Regressions. Journal of the Royal Statistical Society. Series B (Methodological) 54(1), 243-252. |
| [13] | Schundeln, Matthias, and John Playforth, (2014). “Private Versus Social Returns to Human Capital: Education and Economic Growth in India” European Economic Review, Vol. 66, pp. 266–283. |
| [14] | Schmidt, P. (1977). Estimation of seemingly unrelated regressions with unequal numbers of observations. Journal of Econometrics, 5(3), 365-377. |
| [15] | Zellner, A. (1962). An efficient method of estimating seemingly unrelated regressions and test for aggregation bias. Rotterdam: Netherlands School of Economics. |

 Abstract
 Reference
 Full-Text PDF
 Full-text HTML