-
Paper Information
- Paper Submission
-
Journal Information
- About This Journal
- Editorial Board
- Current Issue
- Archive
- Author Guidelines
- Contact Us
American Journal of Economics
p-ISSN: 2166-4951 e-ISSN: 2166-496X
2018; 8(3): 113-122
doi:10.5923/j.economics.20180803.01

Estimating the Effects of Free Trade Agreements on Imports, Exports and Trade Volume Using “Threshold Auto Regressive Model” (A Case Study of Pakistan)
 Abstract
 Reference
 Full-Text PDF
 Full-text HTML
Mir Alam1, Ye Mingque1, Imtiaz Hussain2
1School of Economics, Shanghai University, Shanghai, China
2Pakistan Institute of Development Economics, Pakistan
Correspondence to: Mir Alam, School of Economics, Shanghai University, Shanghai, China.
| Email: |  |
Copyright © 2018 The Author(s). Published by Scientific & Academic Publishing.
This work is licensed under the Creative Commons Attribution International License (CC BY).
http://creativecommons.org/licenses/by/4.0/

This study aims to investigate the impact of free trade agreements on trade volume of Pakistan with China and the SAARC countries including India, Sri Lanka, Maldives, Bhutan and Bangladesh. The study employs cross country data by utilizing the variables imports, exports and trade volume for the time period 1972-2017. All the above variables are in log form and integrated of order one and at first difference. For this purpose, the Threshold Autoregressive Model (TAR) has been applied to estimate the pre-post analysis of the trade volume. Furthermore, we have selected 2004 as a threshold time and by introducing dummy variables for before and after 2004. The study found that after trade agreements of Pakistan with SAARC countries, the trade volume has been increased due to increase in exports and imports. However, in case of China and India, Pakistan’s imports increases at a greater rate than the increase in exports.
Keywords: Trade, Trade volume, Free trade agreement, Exports, Imports, Threshold autoregressive model
Cite this paper: Mir Alam, Ye Mingque, Imtiaz Hussain, Estimating the Effects of Free Trade Agreements on Imports, Exports and Trade Volume Using “Threshold Auto Regressive Model” (A Case Study of Pakistan), American Journal of Economics, Vol. 8 No. 3, 2018, pp. 113-122. doi: 10.5923/j.economics.20180803.01.
Article Outline
1. Introduction
- Economists of all time, either classical, new classical or modern have never denied the importance of external trade. International trade has been considered as the backbone of the economy of any country. The issue of trade and free trade has been at the prime agendas of economists' for over last two centuries. David Ricardo and Adam Smith talked about the importance of free trade, and given Comparative and Absolute Advantage theories. Furthermore, globalization or free trade is a debated phenomenon in the world economic system of the 21st century. If the economic affluence and economic development of all the countries around the globe could be carried at equivalence level by the free flow of commodities and services with each other, irrespective of boundaries, under the umbrella of free trade, then it would be a situation for which, every country should struggle for. Additionally, multilateral trade agreements are preferred to bilateral once, in high, middle and low income countries, to protect their external markets to assurance their activities in foreign trade in the upcoming years. An FTA is a legally-binding treaty among two or more states to promote trade, facilitate the flow of foreign trade and foreign direct investment (FDI), and bring about closer economic coalition. FTAs are a mutual arrangement between two or more nations; it allows the partners to give each other privileged market access. Subsequently, FTAs support the free movement of commodities, services, FDI and encourage to economic coalition among the binding states by removing tariff/restrictions on each other’s goods. [1]During 1990s, the regionalism and multilateralism have fetched essential trade liberalization all over the world (For example EU Union and NAFTA). Multilateralism moved forward to the effective conclusion of the Uruguay Round of trade talks, which concluded with the formation of World Trade Organization (WTO) in 1995. However, according to Shabir and Kazmi [2] there is a perception in less developed countries that the WTO remained biased, and safeguards the benefits of the dominant high income developed countries, protecting and advancing their benefits; therefore, worsening many of the world’s deprived nations. The damage of trustworthiness of the WTO led emerging economies to shelter and promotes their own benefits in this gradually globalized world. At present, almost 300 FTAs exist globally. Currently, a more than 60 percent of international trade, is being conducted through multilateral regional and bilateral trade arrangements, [2, 3] The prime objective of these FTAs is not only to the assistance to economic desires of the two states, but it also supportive to develop international relations, or in other words, it legitimatize trade and other mutual welfares between two coalition allies. Consequently, on average, after 10 years, an effective FTA approximately doubles bilateral trade between two members. [4, 5]
1.1. Pakistan – China Free Trade Agreements
- China and Pakistan have been developing a cooperative association at several levels, particularly in the diplomatic, security and political grounds. There has been a strong strategic and military relationship between China and Pakistan since their inception at the world map. However, they are not much successful to make significant development in their economic relations until recently started the project, named, China-Pakistan Economic Corridor (CPEC). Both the countries have a great expectation with this project. Pakistan-China bilateral trade agreement is moving on the same track. With the development of the importance of developing/emerging economies in East Asia, South Asia, Asia Pacific and South America. Pakistan is continuously trying to strengthen its relations in trade and commerce with the countries of those regions. With the evolving importance linked to China as the world second largest economy as well, a neighbor and a sincere friend of Pakistan, it is a correct time for Pakistan to establish its economic ties with China, besides, their already strong political and military brotherly relations.From the early 1950s, China-Pakistan moved into economic relations; though, the first official FTA was finalized in January1963. Later, in October 1982, both states established the Pakistan-China joint Committee on the bilateral trade, technology and economy. In addition, the trade between Pakistan and China had normally been lead under the 1963 FTA, because of which both nations had declared Most Favored Nation (MFN) status to each other. At the initial years, both countries had multi-modal trade that is barter system and cash trade. Conversely, the trade between China and Pakistan was going on almost completely on a cash basis in convertible currency. Recently, both countries are agreed to do the trade in Chinese currency (RMB) rather than U.S. $. At present, both countries kept the economic relationship on the top priorities. Currently, a question rises as to why this rapid interest in trade between the two nations has hastily been ignited. Apart from other causes, one is that the government of China has convinced its state owned entrepreneurs to import Pakistani goods in order to progress the trade balance between both nations and make more project specific investments. With this eagerness and objective in mind that Pakistan established a Free Trade Agreement with China in July, 2006. Although, the Chinese economy is much bigger than Pakistan’s economy is in terms of gross domestic products, reserves, trade etc. However, the FTA offers an enormous potential for the economy of Pakistan. It can convert its chronic trade deficit into surplus with China through using the new market access for different products given by China. Through diverting its exports from customary trade partners to the most populous country to capture new consumer base of P.R. China, Pakistan can reduce its overall trade deficit, for that Pakistan needs to make its exporting goods a more diversified, more competitive and much improved in quality.
1.2. Pakistan- South Asian Free Trade Agreements (SAFTA)
- The South Asian Association for Regional Cooperation (SAARC) comprising seven South Asian countries; Bangladesh, Nepal, India, Pakistan, Maldives, Sri Lanka and Bhutan, was established in December, 1985. Latter, in 2007 Afghanistan has also joined SAARC. It was anticipated that South Asia Free Trade Area (SAFTA) will help better specialization and cost minimization making substantial trade formation in the region in the opinion of substantial reduction in tariff and exclusion of other non-tariff obstacles, given the present complementary in resource endowment, technological awareness and escalating production ability.The SAFTA was signed at Islamabad during the 25th SAARC Summit on January 6, 2004. The endorsement of SAFTA by all the member nations is a key success of SAARC mandate. The SAARC Secretariat on March 22, 2006 issued an official notification declaring the entry into force of SAFT Agreement with effect from January 1, 2006.The Working Cluster on minimization in the Sensitive Lists under South Asian Free Trade Area SAFTA completed its mission of reduction the Sensitive Lists by 20 percent. Consequently, Maldives has reduced its Sensitive List to 154 tariff lines from 681 tariff lines (78 percent reduction) and India has reduced its Sensitive List to only 25 tariff lines from previously 480 tariff lines for Least Developed Member nations which is a 95 percent decrease. Pakistan has reduced its sensitive list to 936 from 1169. [6] Moreover, the key objective of this research study is to analyze the impact of the FTA on the trade volume of Pakistan. The study thoroughly investigates the impact of FTAs of Pakistan on trade volume with its major trading partners with whom Pakistan has free trade agreements such as China, India, Afghanistan and USA. The study compares the trade volume with each associated country and figures out the main causes of the fluctuation of trade volume with different trade partners and in different sectors. The study will further investigate importance of trade with china.This work is organized as follows. In section 2, we briefly reviewed the existing literature. Section 3 describe empirical methodology i.e. data description and estimation, section 4 explain results and discussion, section 5 conclusion, and finally policy recommendation in section 6.
2. Literature Review
- Numerous studies have been done to find the relationship between preferential trade agreements (PTAs)/ Free trade agreements (FTA)/ Regional trade agreements (RTA) and trade volume between two or more countries. Fernandez and Portes [7], Freund and Ornelas [8], [9], Carrere [10], Fiorentino, Verdeja [11], Estevadeordal, Freund [12], Ornelas [13] and Baldwin and Jaimovich [14] have discussed the role of these agreements of the economy of different states. They argued that trade incorporation is essential for surge the flow of trade among the member nations. The quantity of PTAs and FTAs has improved hastily for the last decades, in all over the world. Enormous research studies that argue the integration in trade among North-South, South–South and North-North region, trade gain among the all developing and developed nations, and the various methodologies used to analyze the impact of FTAs/PTAs on bilateral flows of trade among member states. Very few studies on FTAs and trade volume have been done in case of Pakistan.While going through different studies, we found that trade agreement have not a clear and equal impact on exports, imports and trade volume of the involved countries. Most of the studies in trade literature, found that FTAs/PTAs has raised the trade volume among associated states [5] [15, 16]. Though, the increase in trade volume is not alike in developing and developed countries. The less developed states are not good trading partners due to their limited size of economy, similar comparative advantage, similar factor endowments, and greater trade costs [14, 17]. The impact of PTA on south-south countries is much greater than the agreement between north-south countries. Whereas the impact on north-north PTAs are statistically insignificant [18]. Southern countries can play an improved role in North-South agreements than agreements among same countries, since they have different factors endowments and factor sizes. Because of these agreements less developed countries can access to vast and developed markets. [19-21]. Trade between unequal bargaining powers wouldn’t be welfare enhancing. The rich countries develop the directions and regulations for poor states. And they have to implement their instructions despite of whether these rules are appropriate for them or not. Consequently, in North-South agreements the benefits for poor states are limited [22, 23].Concentrating on North-South bilateral trade agreements, a significant and positive impact of NAFTA on Mexico’s trade [24], but got no effect of NAFTA on Mexican trade (Pacheco-López, 2003). Mexico has a limited trade with America because of preventive rules of source. [25]. In a conventional type of trade agreements running in the development at a multinational level, FTAs pay positively to the bilateral trade [5]. After going through different studies we found a mixed results, FTA are favorable for some countries whereas, it can suffers the economies due to high imports. It is also depending on the economic status and trade partners. Villareal and Fergusson [26], argued that NAFTA was considering a controversial treaty, because it was the first trade agreement among a developing county and two highly developed rich countries. Trade share of US with Mexico and Canada was very low, therefore it wasn’t put a visible impact on American economy. But it put a good contribution to the Mexican economy. Caporale, Rault [27] and Caporale, Rault [28] analyzed the trade flow between the country of the European Union and the eastern and central European countries. They found a positive and statically significant impact of FTA of bilateral trade flow.
3. Methodology
3.1. Data Description
- For the identification of the impact of free trade agreements on trade volume of Pakistan, the data of cross countries has collected for the time period 1972 to 2016 for the variables import, export and trade. The countries including China, India, Sri Lanka, Maldives, Nepal, Bangladesh and Pakistan have been selected for the study. The data is collected from the World Bank database, World development indicators (WDI). The sum of export and import has been considered as trade volume in the study which is our dependent variable.
3.2. Estimation Technique
- This study applied the multiple regression analysis technique to analyze the impacts of free trade agreement on trade volume of Pakistan. In addition, for the purpose of achieving research objective of the study, the study takes trade volume as dependent variable, and import export as explanatory variables. On the other hand, the study takes 2004 for the purpose of pre-post analysis because of the summit held by SAARC countries in 2004. In such a case, the pre-post analysis has applied through multiple regressions to investigate the impact on trade volume before and after 2004’s free trade agreements. For this purpose a set of dummy variables are introduced with explanatory variables in regression model.
3.3. Specifications of Empirical Models
- The Empirical model to estimate pre-post impact of international trade on trade volume of Pakistan, we have formulated the model for individual country by introducing dummies to capture the impact on trade volume before and after 2004. For this purpose, following regression model is developed.
3.4. Regression Model
 | (1) |
 is the trade volume of Pakistan as dependent variable with country i at time t. while,
  is the difference of post exports, which is after 2004 of the country
  with Pakistan at time t as explanatory variable. In addition,
  is the difference of post imports that; is after 2004 of the country j with Pakistan at time t as explanatory variable. On the other hand the term
  is the exports of the country i before 2004 with Pakistan at time t. and finally,
  is the imports of the country i before 2004 with Pakistan at time t. However, in this study we have applied the threshold autoregressive model (TAR) for time after and before 2004 and detailed explanation is as follow.
3.5. Threshold Autoregressive Model (TAR)
- This model was initially proposed by Tong [29] and elaborated in detail by Tong [30] which confirms the non-linearity in univariate models by the mean of threshold value. In TAR model if univariate series contains single threshold level then autoregressive processes governed in two different ways, first is before and second is after threshold level. The most important point in this model is that by the presence of the regime switching the univariate series in nonlinear, even this is linear in each regime and regime switching advanced by all factors is called shocks.The general form of the TAR model for the regimes after and before 2004 is as follow
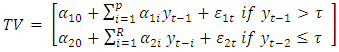 | (2) |
 is the threshold time which is 2004 and P in the equation represents Autoregressive process in high regime while, R represents the Autoregressive process in lower regime. In the model TAR the autoregressive process performs each sides differently such as positive and negative. The regimes are revised because the shocks of the error, as for as there is higher variance then there is more probability to switch from one regime to another regime. So in this connection, we assumed that the variance of two errors is equal then the alternative form of the threshold autoregressive model would be as follow.
 | (3) |
 Post effect of free trade agreements on trade volume of Pakistan.On the other hand
  is the effect on trade volume before free trade agreements.Now when
  then the equation above would be
 | (4) |
 then the threshold time model turns into as follow.
 | (5) |
4. Results and Discussions
4.1. Pakistan Trade with FTA Partner Countries
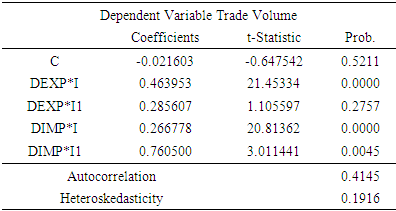
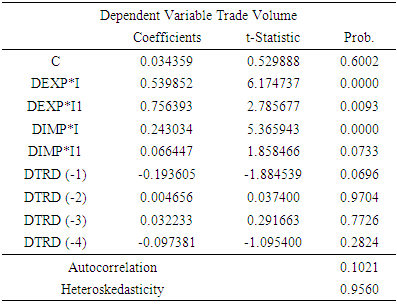
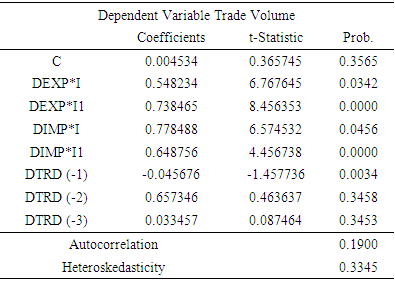
- In the model, the dependent variable is trade volume while independent variables are import and exports. The variables are characterized as post exports and pre-exports based on the free trade agreement that has been taken place in 2004 among SAARC countries. To capture the post behavior of exports and imports as well as pre- behavior of exports and imports among SAARC countries as before and after the free trade agreement among them it is generated dummies. As “I” above in model is attributed as pre- behavior of exports. It is generated as before 2004 it is one and else zero and then this dummy is multiplying by the exports and imports to capture the trend of exports and imports before free trade agreement (2004). And “I1” is also a dummy it is one after free trade agreement (2004) and multiplies by imports and exports to analyze their pattern. Thus, 2004-time period is a threshold time in our model. In above model there is no problem of serial auto correlation and Heteroskedasticity as their p-values are greater than 5%.
4.2. Trade Performance with China
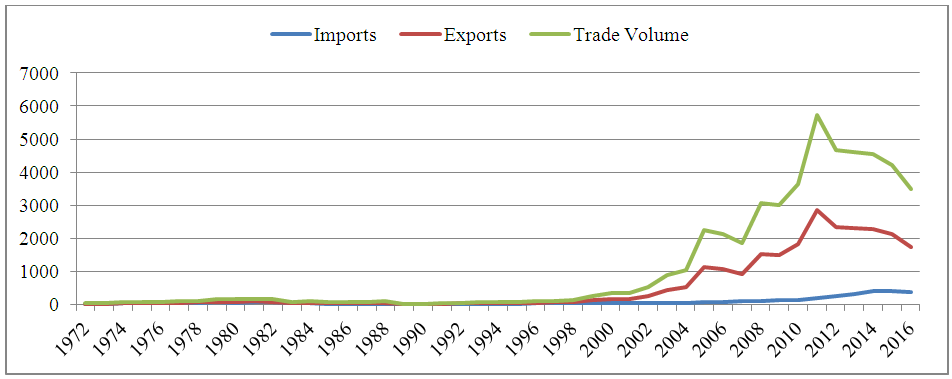
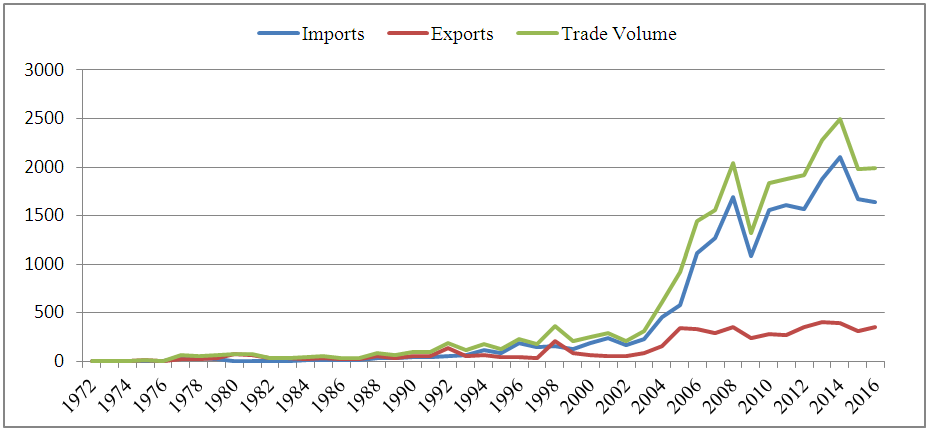
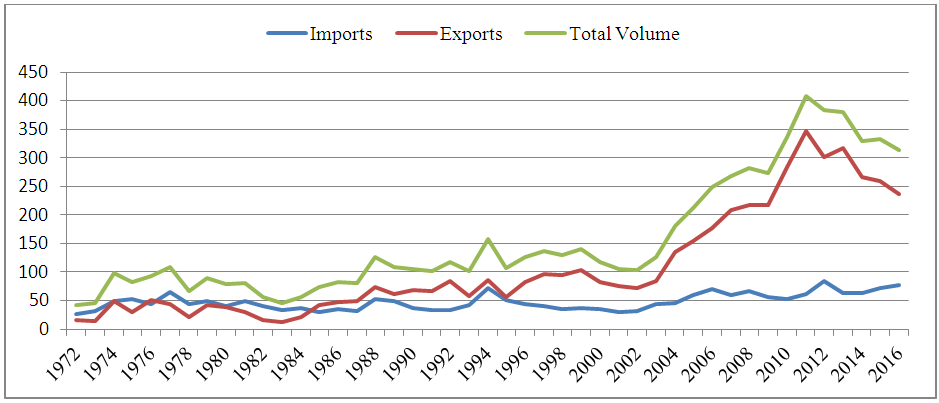
- Pakistan’s trade, imports, exports and trade volume with china before 21st century was very low. As depicted in Figure. 1 Pakistan’s imports, exports and trade volume starts flourishing after signing six agreements between the two countries on 12th May, 2001.
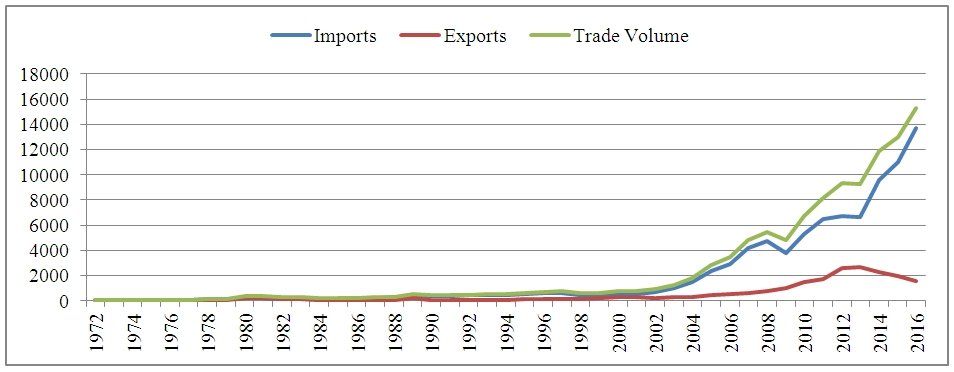 | Figure 1. Pakistan Trade: Imports, Exports and Trade Volume with China, 1972-2016 (In millions of U.S. dollars) |
|
4.3. Trade Performance with Afghanistan
- The trade with Afghanistan is very important for the economy of Pakistan. Fig. 2 shows the trade performance including imports, exports and trade volume of Pakistan from 1972 to 2016. It is observed that the Free Trade Agreement (FTA) plays a pivotal role in the development in trade with Afghanistan. It is observed a tremendous increase in both imports and exports till 2011.
 | Figure 2. Pakistan Trade: Imports, Exports and Trade Volume with Afghanistan, 1972-2016 (in millions of U.S. dollars) |
|
4.4. Trade Performance with Bangladesh
- Fig 3 shows the effect of free trade agreement of Pakistan with Bangladesh. It can be clearly observed that both imports and exports are increasing after 2004. However, exports are increasing with increasing rate and sharply dropped down in 2011. The trade balance of Pakistan with Bangladesh always remains positive. But it was at the maximum during 2010-2011.
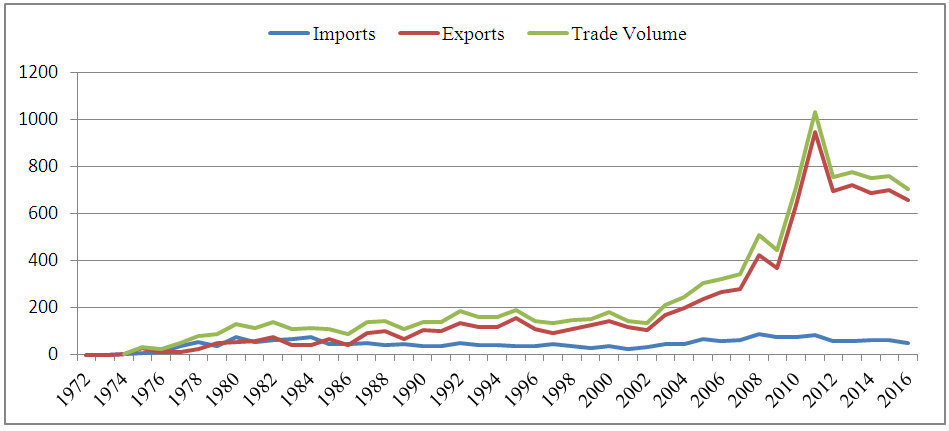 | Figure 3. Pakistan Trade: Imports, Exports and Trade Volume with Bangladesh, 1972-2016 (In millions of U.S. dollars) |
|
4.5. Trade Performance with Bhutan
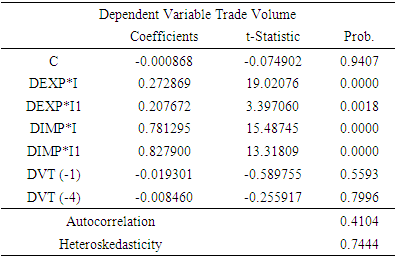
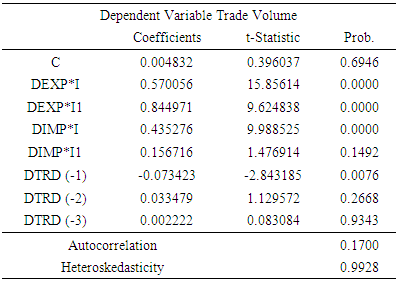
- Table 4 presented the estimated results of the impact of free trade agreement between Pakistan and Bhutan. The coefficients of exports pre and post 2004 are significant to trade volume of Pakistan. On the other hand the coefficients of imports before and after 2004 are also highly significant. These results indicates that one percent increase in exports with Pakistan before free trade agreement lead to increase trade volume by 15.27% but after free trade agreement it has led to increase trade volume by 54%. In addition, with the case of imports before free trade agreement, it has increased trade volume by 43%. While free trade volume it has increase trade volume by only 46%.
|
4.6. Trade Performance with India
- The Pak-India trade performance and effect of FTA is indicated in Fig 4. And can be clearly seen that imports, exports and trade volume are increased after 2004. Pakistan has also experience a huge trade deficit with India. Because soon after FTA Pakistan’s imports increased sharply. We also observed the fluctuations in exports and trade volume, due to political conflicts between the two countries.
 | Figure 4. Pakistan Trade: Imports, Exports and Trade Volume with India, 1972-2016 (In millions of U.S. dollars) |
|
4.7. Trade Performance with Maldives
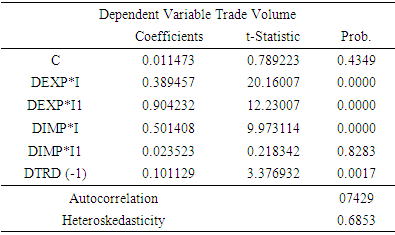
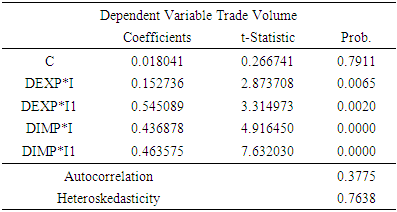
- The impact of free trade agreement on trade volume of Pakistan with Maldives has presented in Table 6. The coefficient of the exports before 2004 is highly significant to the trade volume of Pakistan and leads to increase trade volume by 53%.On the other hand, after 2004s free trade agreements as one percent increase in exports led to increase trade volume by 75%. Additionally, the coefficient of the imports before and after 2004, are also highly significant. In the case of imports, before 2004 one percent increase in imports with Maldives leads to increase trade volume by 24% but after free trade agreement 1% increase in imports lead to increase trade volume of Pakistan by 6%.
|
4.8. Trade Performance with Sri Lanka
- Fig 5 shows the effect of FTA between Pakistan and Sri Lanka. It can be clearly observed that both imports and exports are increasing after 2004. However, exports are increasing with increasing rate and sharply dropped down in 2011.
 | Figure 5. Pakistan Trade: Imports, Exports and Trade Volume with Sri Lanka, 1972-2016 (In millions of U.S. dollars) |
|
5. Conclusions
- This study was aimed to investigate the impact of free trade agreements on trade volume of Pakistan with SAARC countries including: India, Sri Lanka, Maldives, Bhutan and Bangladesh. The study found that before 2004 Pakistan’s exports with China had a share of 27% in trade volume, while after 2004 or free trade agreement the percentage share of exports declined to 20%. For the case of imports, before 2004 it was 78% while after 2004 it is 82%. In the case of Afghanistan, the percentage share of exports before 2004 is 38% and after 2004 it is 90%. While, the imports before 2004 were 50% whereas, after 2004 it is 23% in the trade volume of Pakistan. In addition, in case of Bangladesh the percentage share of the exports in the trade volume of Pakistan was 57% but after 2004 the percentage has increased to 84%. On the other hand, the percentage share of imports was 43% but after 2004 it has decreased to 15% in trade volume of Pakistan. However, in the case of Bhutan the percentage share of exports in trade volume of Pakistan was 15% but after 2004 the percentage has increased to 54%. On the other hand, the percentage share of imports was 43% but after 2004 it has also increased to 15% in trade volume of Pakistan. For the case of India the percentage share of exports in trade volume of Pakistan was 48% but after 2004 the percentage has decreased to 28%. On the other hand, the percentage share of imports was 26% but after 2004 it has also increased to 76% in trade volume of Pakistan. Finally, Pakistan’s exports with Maldives had a percentage share of 53% in trade volume, while after 2004 or free trade agreement the percentage has increased to 75%. For the case of imports, before 2004 it was 24% while after 2004 it has decreased to only 6%. In conclusion, the SAFTA played a pivotal role in the development of trade volume with all its trade partners; however, it deterred trade earnings with India and China. So, Pakistan needs to expand its exports with both countries to bring the stability in the balance of trade.
6. Policy Recommendations
- 1. The government of Pakistan could pursue higher concessions from their trade partners, with whom Pakistan has signed free trade agreements. Specifically for the products that are enjoyable for both, high export potential and competitive advantage in global market. Additionally, the government should negotiate to avail concessions equivalent to what the two countries extend to the remaining FTA/PTA partners.2. Pakistan should start negotiation with China and other trade partners to enhance its exports. Because, currently the major part of the trade volume is imports. Consequently, Pakistan needs to take some actions like increase in tariffs and other duties to make sure in the balance of trade favorable. 3. To support local exporting industries, government should provide subsidize inputs and other facilities, so that, they could compete with the international competitors. 4. Pakistan’s textile industry has enormous potential to boom exports but due to some obstacles like energy crises, lack of research and development, increased production cost, increase cost of doing business, lack of effective policy tools, political instability, law and order situation and external trade barriers. Pakistan needs to take some series actions to address these issues. 5. Export Promotion Bureau and Trade Development Authority of Pakistan (TDAP) need to be active to active and find new markets for exports. This could be an impetus to enjoy the economy of scale.6. It is also important to educate local exporter regarding the innovation to increase the quality of the products. 7. Pakistan needs to pay attention to the trade relations with Afghanistan, as its exports and trade volume has started dropping down after 2011.