-
Paper Information
- Paper Submission
-
Journal Information
- About This Journal
- Editorial Board
- Current Issue
- Archive
- Author Guidelines
- Contact Us
American Journal of Economics
p-ISSN: 2166-4951 e-ISSN: 2166-496X
2018; 8(2): 93-104
doi:10.5923/j.economics.20180802.04

Does Social Capital Determine Household Welfare? An Investigation into the Situation in Sokoto Metropolis
 Abstract
 Reference
 Full-Text PDF
 Full-text HTML
Mohammed Bashir Achida1, Tukur Garba2, Yahya Zakari Abdullahi3
1Department of Economics, Faculty of Social Sciences, Usmanu Danfodiyo University, Sokoto, Nigeria
2Department of Economics, Usmanu Danfodiyo University, Sokoto, Nigeria, Sokoto, Nigeria
3Department of Economics, Faculty of Management and Social Sciences, Federal University Gusau, Gusau, Nigeria
Correspondence to: Tukur Garba, Department of Economics, Usmanu Danfodiyo University, Sokoto, Nigeria, Sokoto, Nigeria.
| Email: |  |
Copyright © 2018 Scientific & Academic Publishing. All Rights Reserved.
This work is licensed under the Creative Commons Attribution International License (CC BY).
http://creativecommons.org/licenses/by/4.0/

This study examines the influence of social capital on household welfare in Sokoto metropolis, Nigeria. To achieve this objective, cross-sectional dataset was collected using a structured questionnaire. Ten households were selected randomly from each of the 23 Wards in the study area using probability sampling method in form of simple random sampling technique, covering a total number of 230 households. The dataset was analyzed using Robust Ordinary Least Squares Regression and Logistic regression with robust standard errors. The findings revealed that among the seven proxies for social capital identified in this study, three are significant and negatively related to household welfare. We therefore conclude that social capital does not enhance welfare in the metropolis but rather reduces it. The implication of these findings is that engagement of households in the three measures of social capital will reduce household welfare among households in Sokoto metropolis. The study therefore recommends that, households in Sokoto metropolis should engage in some other social capital activities other than the ones that have negative influence on their welfare. But some of the control variables have significant impacts on a household’s welfare in the metropolis.
Keywords: Social Capital, Household Welfare, Metropolis
Cite this paper: Mohammed Bashir Achida, Tukur Garba, Yahya Zakari Abdullahi, Does Social Capital Determine Household Welfare? An Investigation into the Situation in Sokoto Metropolis, American Journal of Economics, Vol. 8 No. 2, 2018, pp. 93-104. doi: 10.5923/j.economics.20180802.04.
Article Outline
1. Introduction
- Capital has been considered as one of the factors of production, and a crucial factor in determining economic development and welfare. What remains inconclusive is what constitutes stock of capital and what form of capital aids rapid growth and development than the other. In the past, money, machineries, skills, knowledge and fixed assets (such as land, buildings etc) constituted the stock of capital that could be considered as capital. However, recent literature and findings have proved otherwise. For instance, Grootaert, Oh, & Swamy (1999), Woolcock & Narayan (2000), Kaldaru & Parts (2005) show the important position social capital, i.e., connections and networks that exist among people, occupies in the field of economics (Putnam, 2000).In many countries, the prominence of social capital as a means of welfare enhancement has been recognized for long. Several studies have been conducted in this area of economics. For instance, Johannes (2009) investigates whether social capital determines poverty using evidence from Cameroon household survey. However, in Nigeria, only few studies have been conducted to investigative the influence of social capital on household welfare. Such studies include: Okunmadewa, Yusuf, & Omonona (2005), Yusuf (2008), Lawrence & Yusuf (2011), and Adepoju, Oni, Omonona, & Oyekale (2011). Nonetheless, Adepoju et al. (2011) study is limited to only rural farming households in the Southwest Nigeria, while Lawrence & Yusuf (2011) study the effects of social capital on rural household welfare in south-western states of Nigeria. Moreover, Yusuf (2008) examines the relationship between social capital and household welfare in Kwara, covering six local government areas in the State. But in the northern-western states of Nigeria, to the best knowledge of the authors, there is no a single similar study conducted on metropolitan areas.Increasingly, social capital relevance is gaining more prominence as people in possession of social capital (connections) easily find jobs, get access to the cheapest sources of capital, and get trusted with high responsibilities. Social capital, as a form of capital has been considered to promote community ties, networks and connections, and has been in existence among dwellers in Sokoto metropolis since time immemorial. Contributions such as “Ajo” (contributions given by men folk to their peers during marriage ceremonies), “kudin barka” (contributions given by women folk to their fellows after given birth) and several others, are a classic examples of this type of capital in the metropolis. In addition, people travel from long distance to condole or celebrate with their relations and friends in the event of death or marriage ceremonies respectively. There are many school and work place associations, trade and political unions, etc., which are either formal or informal. However, despite the presence of all these, what may not be known precisely is their impact on welfare enhancement of the members. This may be as a result of the view that social capital can be used for good or for bad (Johnson & Ross, 2009). This implies that the connections and networks that consist social capital could be used for societal benefits or for criminal activities like drug cartels, child trafficking and armed robbery syndicates or groups with very strong ties in order to perpetrate evil, thereby causing harm or hardship to the society. But do all these networks promote household welfare in Sokoto Metropolis?It is against this background that this study investigates the influence of social capital on household welfare with particular reference to Sokoto metropolis. Therefore, the paper is divided into five sections. After this section, section 2 deals with theoretical framework while section 3 concerns with review of related literature. Section 4 dwells on the methodology adopted for this study. Section 5 deals with findings and discussion of results. Finally, section 6 concludes the paper and gives policy implications.
2. Theories of Social Capital
- Many theories have been used to conceptualize social capital but the most prominent are Weak Tie Theory (Granoveeter, 1973), Social Resources Theory (Lin, Vaughn, & Ensel, 1981a) and Structural Hole Theory (Burt, 1992). The Weak Tie Theory, the proponent of which is Granovetter (1973) explains that job opportunities are likely to come from an individual’s weak and strong ties in his network. Strong ties consists of close relations, friends, etc., that provide information which becomes widely available and generally shared within group. However, weak ties are explained by Granovetter (1973) as the cluster of knit networks outside an individual’s direct contact which could provide good information. It was established by Granovetter that weak ties are more likely to provide individual with information on job opportunities than the strong ties. Thus, weak tie theory concentrates more on the characteristics of ties between actors.The second approach is the Structural Hole Theory, propounded by Burt (1992), which identifies gaps that exist between two groups of individuals within a group. These gaps are called “structural holes”. The theory focuses on the pattern of relationships among contacts within an individual’s network. Unlike Weak Tie Theory that concentrates more on the ties characteristics among actors, structural hole theory postulates that actors who possess more structural holes are at advantageous position, both in power, position and upward mobility. Structural Hole Theory centres on social capital and its ability to connect group members that have a complementary form of knowledge or resources together through a third party; probably an entrepreneur. As a result, Burt (1992) is of the belief that Structural Hole Theory addresses social capital more squarely than the weak tie theory. Structural Hole Theory explains how an actor within a group will avail himself with the capability to extend his tie to everyone in the group, no matter the degree of tie. Thus, such an actor tends to benefit more in the group, because he increasingly closes the gap between him and other actors, hence, widening the scope of his ties.The third approach is the Social Resource Theory introduced by Lin et al. (1981a), which postulates that, it is the resources embedded within a network, not actors characteristics that lead to an individual’s mobility (from a lower to a higher position, or from the state of poverty to that of affluence). The contacts that an individual utilises within his group (regardless of the strength of the tie) avails him with the necessary resources to meet his objectives. The key features of Social Resources Theory explain how an actor through his ties within group, will be able to capture some of the resources owned by other actors within the group, being it material or information, for his own betterment. From the three theories, we feel that Social Resource Theory by Lin et al. (1981a, 1981b) will serve as theoretical basis for this study since it portrays how an actor will benefit from the pool of resources within his group in order to achieve his certain objectives.
3. Literature Review
- Conceptually, the term “social capital” was first used by a state rural school supervisor in West Virginia, USA, in person of Hanifan (1916) and he stressed the importance of community involvement in successful school supervision. When an individual meets a group and the group meets other groups, the community will benefit and social capital is being created. This reinforces the view of Lin (1999) who argues that, the rationale behind social capital is investing into relationships in anticipation of future returns.Social capital was initially a sociological concept that was brought into economics. According to Portes (2000) social capital is one of the most important exports from sociology to economics and he considers social capital as an asset to children with family ties and networks of traders, and it explains why some cities are easily governable with economic progress and others are not. However, Knack’s (2002) definition of social capital includes any collective action that is geared towards achieving collective gains, whether the action is taken by the government or civil society. This definition describes social capital as any action that is gain-oriented whether governmental or societal.Similarly, Zadeh, Ahmed, Abdullah, & Abdullah (2010) argue that for people of the same community to have shared norms, values and interest, they must possess the ability to interrelate and interact with one another; and this ability is called social capital. This definition therefore describes social capital as the ability of people to come together and share common values and interest as a community. They further argue that, community development is uniting every community members’ efforts towards improving the wellbeing of the society.In a similar way, Putnam (2000) sees social capital as a link between individuals, a social network and as a culture of reciprocity and associated trust. This definition explains social capital as connections among people that enable them to cultivate social virtues through reciprocation of gestures. As such, social capital does not necessarily have to be organised, rather, it is accumulated through some societal norms. Furthermore, World Bank (1999) foresees social capital to be all institutions, relationships and behaviours that help to enhance the quality of social interactions. This definition views social capital as the people’s capacity to be solidly together and remain so. Apart from conceptualising social capital, there is a need for understanding the concept of welfare. According to Greve (2008) the concept of welfare should be viewed from the historical and cultural perspectives within which it is shrouded. He further asserts that welfare could be seen from economic or sociological perspectives. From economic perspective, it is the amount of money at hand for individual’s spending irrespective of what he purchases. Sociologically, welfare is assumed to be the amount of happiness and wellbeing available to individual, which is measured through some social indicators.Welfare, on the other hand, is seen to be a situation where people are fully aware of their rights and are given their entitlements. It is, as well, a deliberate and organised effort by an institution to better the being of their people (Abbasi, Rehman, & Abbabi, 2010). Moreover, Wikipedia (2010) views welfare to be both financial and non financial assistance provided to people, which differs depending on the country or context. According to this definition, any assistance to people, either monetary or otherwise, is considered to be for the improvement of their wellbeing.Similarly, Monowaruz (2008) sees welfare as the subsidy given by the government to low income group in terms of health, education, cash benefits etc. Going by this definition, welfare is perceived to be any assistance given by the government to low income group in order to enhance their standard of living. For the purpose of this study, we adopt the definition of welfare as given by Greve (2008), from sociological perspective, as the amount of happiness and wellbeing available to individual which is measured through some social indicators.Social Capital and Household WelfareHaddad & Maluccio (2000), using household survey data for 20 different types of groups and applying ordinary least squares estimator, find that participation of a household member in a group (association) increases the per capita expenditure of a household. Similarly, groups with high participation and high trust tend to benefit more than groups with high trust but low participation or low trust with high participation. In addition, the groups with low trust but high participation receive higher returns than those with high trust low participation. Therefore, returns to a group vary with the type of group, degree of participation and level of trust. Haddad & Maluccio (2000) further find that financial group return has no correlation with the degree of participation or trust level because financial groups are regulated by some existing guidelines that may not be influenced by participation or level of trust. Nonetheless, contrary to the financial groups, non-financial group’s returns increase with the degree of participation and level of trust (Haddad & Maluccio 2000).In a similar study that applies ordinary least squares on a survey dataset from Putnam and Aunie E. Casey foundations to examine the relationship between social capital and children’s welfare, the findings, though with complexity, indicate a positive relationship between social capital and the welfare of children (Penning, 2008). Furthermore, Hu & Jones (2004) study the relationship between social capital and a household’s welfare in the villages of Oledai and Agolitom both in Eastern Uganda. Using ordinary least squares (OLS) regression analysis on a household survey dataset for a sample of 250 households in the two villages, they find a significant positive relationship between informal social capital and a household’s welfare. However, the results indicate no significant relationship between organizational social capital and household welfare.Similarly, Yusuf (2008) used descriptive statistics and OLS regression techniques to analyze household survey dataset for a sample of 315 households in six local governments of Kwara state. The findings show a one unit increase in social capital increases household per capita expenditure by 0.15%. The findings further reveal that social capital effect on welfare is attributed to membership and active participation in decision making process of the associations.Furthermore, in examining the effect of social capital on the welfare of rural households in south-western Nigeria, Lawrence & Yusuf (2011) apply descriptive statistics and OLS regression technique to analyze a survey dataset for a sample of 399 households of Ekiti and Osun States. The findings suggest that heterogeneity index and cash contribution by a member to an association have a positive effect on a household’s welfare. These findings suggest that heterogeneity index and cash contribution help household members to have more contacts. Moreover, Kassahun (2010) investigates the role of social capital in community development in Addis Ababa, Ethiopia, using survey dataset for a sample of 497 households in poor localities and applying logistic regression. The findings suggest a positive relationship between participation in local associations and community development. The results therefore, indicate active participants in local associations are more likely to be active in community development activities, which may enhance a household’s welfare. Aker (2005) also examines the effect of household and village-level social capital on a household’s welfare in rural Tanzania, using household and village level dataset for a sample of 311 households of 67 villages and applying OLS, 2SLS, probit and quartile regressions. The findings suggest high levels of social capital are associated with higher levels of per capita expenditures, and that social capital is only a compliment to human capital but not a substitute. The econometric analysis further established a positive significant relationship between social capital and a household’s welfare.Similarly, investigating the effect of individual and community characteristics on subjective wellbeing in Belgium, using single level OLS and multilevel OLS analyses of 2009 SCIF survey and 2006 Belgian ESS sample, the findings reveal that social capital indicators are significantly positively related to subjective wellbeing (Hooghe & Vahoutte, 2011).Johannes (2009) also examines the effects of social capital on the household poverty by applying OLS on 2001 Cameroon household survey dataset. The outcome indicates a significant positive relationship between membership of associations by a household member and the household’s welfare. On the contrary however, in examining the nature of causal relationship between social capital as measured by household membership in formal and informal groups (associations) and a household’s welfare in South Africa, Haddad, Maluccio, & May (1999) use multivariate regression techniques to analyse a set of panel data for a period, 1993-1998. The results revealed that, in 1993 during apartheid regime, social capital had no influence on household’s welfare, but when it was reexamined in 1998, after the apartheid, the results showed a significant positive relationship between social capital and a household’s welfare, and this was attributed to lifting of bans on associations that were banned during the apartheid. On the other hand, Johnson & Ross (2009) study the ties that bind and blind by analyzing data obtained from semi-structured depth interviews with 19 U.S. consumers, who were purposively selected using established theoretical sampling techniques and find negative outcome of social capital. That is, they find that social capital influences unwanted purchases, and bad purchases influenced by social capital may cause trust decay and at times even destroy relationships. Johnson & Ross (2009) findings further suggest that, people at times surprisingly ignore the risk involve in leveraging their relationship for gains, instead they completely focus on the possible gains. Finally, they argue that, although social capital mobilisation frequently results in positive outcomes for individuals, there are situations in which it has negative consequences. Furthermore, Weil, Lee, & Shihadeh (2011) analyse the impact of social capital on stress after disaster stuck using post-Katrina data from a combined series of surveys that were launched roughly 30 days after Hurricane Katrina struck between 2005 and 2007, and applying Pearson’s correlations and multiple regressions. They find that immediately after Katrina, people who are more socially embedded carried the greatest task with respect to helping the displaced persons, thus experienced more stress. Similarly, Antoni (2009) use OLS regression on Italian micro data relating to two different years, 1993 and 2001 to investigate the association between the social structure of personal contacts and individual household’s welfare. The findings reveal that not all encounters produce positive outcome. An encounter can generate a negative outcome as well, such as rancor and hatred. Other Determinants of WelfareDespite the impact of social capital on a household’s welfare, there are other factors that may exert influence on welfare. Using descriptive statistics and 2-stage least square regression estimator to analyze a survey dataset on 186 households in Ekiti state, the findings suggest that educational attainments of household heads and spouses, and gender of household heads are the main determinants of a household’s welfare in the area (Akerele & Adewuyi, 2011).Similarly, investigating the effect of individual and community characteristics on subjective wellbeing in Belgium, using single level OLS and multilevel OLS analyses of 2009 SCIF survey and 2006 Belgian ESS sample, the findings reveal that a person living with a partner (being married) exerts a strong effect on a household’s welfare (Hooghe & Vahoutte, 2011). Using descriptive statistics, Lorenz curve, Gini coefficient and Ordinary Least Squares regression analysis to analyze household survey dataset for a sample of 240 households in Ekiti State of Nigeria, Oluwatayo (2008) finds that marital status is negatively related to a household’s welfare status.Using descriptive statistics, Lorenz curve, Gini coefficient and Ordinary Least Squares regression analysis to analyze household survey dataset for a sample of 240 households in Ekiti State of Nigeria, Oluwatayo (2008) finds that primary occupation is negatively related to a household’s welfare status.Investigating the effect of individual and community characteristics on subjective wellbeing in Belgium, using single level OLS and multilevel OLS analyses of 2009 SCIF survey and 2006 Belgian ESS sample, the findings reveal that age of a person exerts a strong effect on a household’s welfare (Hooghe & Vahoutte, 2011).Ukoha, Mejeha, & Nte (2007) also, analyze the determinants of farmers’ welfare in Ebonyi State of Nigeria, using OLS regression on a survey dataset for a sample of 120 farmers. The findings portray that physical assets have a significant positive effect on the household’s welfare.Ukoha et al. (2007) also, analyze the determinants of farmers’ welfare in Ebonyi State, using OLS regression on a survey dataset for a sample of 120 farmers. The findings portray a significant negative effect of household size on the household’s welfare.Finally, using descriptive statistics, Lorenz curve, Gini coefficient and Ordinary Least Squares regression analysis to analyze household survey dataset for a sample of 240 households, Oluwatayo (2008) finds that household size is positively related to a household’s welfare in Ekiti State of Nigeria, but marital status and primary occupation are negatively related to a household’s welfare status.
4. Methodology
- This section deals with method of data collection, sample size and sampling techniques adopted, variables measurement, method of data analysis and model specification.
4.1. Data
- The main data source for this study is primary in nature. The dataset was collected through the use of structured questionnaire instrument. This is necessitated by both the fact that research in social capital is best done using questionnaire as used in many similar studies conducted in the area. Such studies include Yusuf, (2008), Hu & Jones (2004) Lawrence and Yusuf (2011), Grootaert, Narayan, Jones, and Woolcock (2004) among others. Moreover, the use of questionnaire is justifiable given the fact that there is no set of secondary data on the variables that will be captured in this study. The study therefore adapts Grootaert et al. (2004) questionnaire.
4.2. Sample Size and Sampling Technique
- The population of this study is the entire households in Sokoto metropolis. Sampling frame was gotten from National Bureau of Statistics, Sokoto Office. Ten households were selected from each of the 23 wards in the study area using probability sampling method in form of simple random sampling technique to select 10 households from each of the 23 wards in the study area, amounting to a total number of 230 households in the study area. Household heads constituted the respondents for this study.
4.3. Variables Measurement
- This subsection deals with measurement of all the variables captured for this study.
4.3.1. Social Capital Measurement
- The proxies for social capital are measured as:Heterogeneity index of associations (%): The research identifies that for a household member to benefit from a given social capital he needs to participate in at least three associations. The choice of three associations for each household is premised on the fact that most of the household partake in at least three to eight associations; therefore, three is a good representation of a sample of eight associations. This is rated according to eight criteria: neighborhood group, kin group, occupation group, economic status group, religion group, gender group, age group, and level of education group. On that basis, a score has been constructed ranging from 0 to 8. If a household member belongs to all eight groups (associations) it indicates a strongest level of association. The resulting index is re-scaled from 0 to 100 (whereby 100 corresponds to the highest possible value of the index) this is in line with (Grootaert, et al., 1999) measurement.Associations meeting attendance index (%): This has been measured by the number of household’s members with active participation in associations as a percentage of the number of household members. Following the work of Grootaert, et al. (1999), active participation has been computed by the frequency of meeting attendance of the household members in meetings of the associations.Decision making Index (%): This has been measured by the power of the household members to part take in decision making of associations. This has been computed as the number of household members with official responsibilities in associations as a percentage of total household size. This measurement is borrowed from the work of Narayan & Prichett (1999). Membership density of households in association (%): Narayan & Prichett (1999) measure this variable as the number of memberships of each household in existing associations (as a percentage of the entire population of household members in the associations). Cash contribution index of households to associations (%): This has been measured as the summation of the total cash contributed to the various associations which the household members belong to (as a percentage of the total cash balance of the associations) as measured by Yusuf, (2008). Labour contribution index of households to associations (%): This has been measured as the number of days that household members belonging to associations claimed to have worked for their associations in a year as a percentage of household members of associations (Yusuf, 2008).Aggregate Social Capital Index: This has been obtained by summing density of membership, heterogeneity index and decision making index (Following Grootaert et al. (1999), as cited in Yusuf, 2008). The resultant index is renormalized to maximum value of 100, by dividing the resulting index by 1/3 or 33.333% (Yusuf, 2008). This study also adopts this measurement.
4.3.2. Other Control Variables
- Other variables affecting a household’s welfare are measured as follows:Human Capital (HCi) = Years of formal educational of household head: The human capital variable has been measured in this study as the average years of formal education of a head of the household as measured by Adepoju, et al. (2011) and Ukoha et al. (2007).Household asset endowment (total assets value of a household in Naira): This has been measured as natural log of total value of assets that the household is endowed with. It is captured by finding the natural logarithm of the total value of assets endowment (Adepoju, et al., 2011). This study adopts this measurement.Measures of other Household characteristicsHousehold Head Age = Age of household head (in years) as measured by Ukoha et al. (2007) and Hooghe and Vahoutte (2011).Household Head Age Squared = Age squared of household head to capture nonlinear influence of household head’s age.Household Head Gender = Gender of household head (this is dummy variable measured as 1= for male, 0= otherwise) as measured by Akerele & Adewuyi (2011).Size of a Household = Household size (number of people in a household) as measured by Oluwatayo (2008).Size of a Household Squared = Squared of household size to capture nonlinear influence of a household size.Household Head Marital Status = Marital status of the household head (this is a dummy variable measured as 1= married, 0= otherwise) as measured by Oluwatayo (2008) and Hooghe and Vahoutte (2011).Primary Occupation of a Household Head = Primary occupation (this is a dummy variable taking the value of 1 for farming, and 0 otherwise) as measured by Oluwatayo (2008).
4.3.3. Measure of Household Welfare
- Welfare is measured by different scholars in different ways, thus; Garba, Sanda, Bawa, & Mikailu (2007) used consumption expenditure as a measure of welfare, though, measuring welfare by the use of aggregate consumption is not always straight forward. Quiggin (2008) measures welfare as the ability of household or individual to consume public goods when household members show case altruism. This measure does not see welfare as a process but simply as ability and does not take care of prices and income. In this study, welfare is measured as household per capita expenditure in quantitative terms, and in qualitative terms as a dummy variable taking the value of 1 if a household daily per capita consumptions expenditure is less than $2 equivalent, and 0 otherwise, i.e. 1 "Relatively poor" 0 "Rich".
4.4. Method of Data Analysis
- Our analytical framework for this study includes descriptive and inferential methods. For inferential method, robust ordinary least squares (ROLS) regression, and logistic estimators with robust standard error have been employed in this study. ROLS has been applied after conducting diagnostic test for heteroscedasticity and found the existence of heteroscedasticity problem using Breusch & Pagan (1979)/Cook &Weisberg (1983) test. This problem can be solved by running robust regression (Yaffee, 2002). Multicollinearity test has also been conducted using variance inflation factor and tolerance value (DeCoster, 2005 and Hair, Anderson, & Black, 1995). However, logistic regression has been used in equations where subjective measure of welfare is used as the dependent variable. This is because, when a dependent variables is a categorical in nature, a categorical dependent variable model is applied. According to Hailpern & Visintainer (2003) the popular methods used to analyse binary response (categorical dependent variable) are categorical dependent variable models which include the probit model, discriminant analysis, and logistic regression, among others. However, discriminant analysis may be used to describe differences between groups and to exploit those differences in classifying observations to the groups (StataCorp, 2011). Discriminant analysis assumes that predictor variables are normally distributed and that variables jointly assume a multivariate normal distribution (Hailpern & Visintainer, 2003). In contrast, the logistic regression model makes no assumption about the variable distribution (Hailpern & Visintainer, 2003). Another advantage of the logit model is its ability to provide valid estimates, regardless of study design (Harrell, 2001). Therefore, logistic regression is used more frequently than discriminant function analysis because in the logistic regression such assumptions do not exist (Harrell, 2001).Although both discriminant and logistic methods give comparative and classificatory results when basic assumptions of both methods are met (Hair et al., 1995), logistic regression, however has the edge over discriminant analysis, particularly when the basic assumptions are not met (Hair et al., 1995). The logistic regression can also accommodate other nonmetric (categorical) independent variables together with metric ones (Hair et al., 1995) unlike in the case of discriminant analysis in which only metric independent variables are accommodated. Consequently, this paper applies logistic regression instead of discriminant analysis.
4.5. Model Specification
- Several studies have identified a range of determinants for welfare. For instance World Bank (1999) identified eight factors, viz, family size, schools, local communities, firms, civil society, the public sector, gender and ethnicity. However, some studies identified age, gender, health, family circumstances, education, employment, home-ownership status; attitudes and values, and characteristics of the area in which they reside as determinants of a household’s welfare (Stone and Hughes 2002).However, this study intends to adopt the following household welfare model using ROLS:
 | (1) |
 | (2) |
5. Findings and Discussion of Results
5.1. Descriptive Statistics
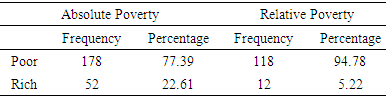
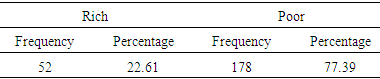
- This section presents the descriptive statistic in order to have a better understanding of the variables captured in the econometric models.Table 1 describes the poverty incidence using quantitative measure of poverty. The results showed that 178 of the households (77.39%) were absolutely poor and 52 households (22.61%) were rich. On the relative poverty, the results indicated that 118 households (94.78%) were relatively poor while 12 households (5.22%) were rich. These findings suggest that majority of the respondents selected were poor.
|
|
|
5.2. Inferential Results
- Before conducting regression test, it is essential to test for multicollinearity. This is necessary in order to avoid high correlation between two or more predictor variables. As high correlations cause problems when trying to draw inferences about relative contribution of each predictor variable to the changes in the dependent variable. The results of multicollinearity test when all the measures of social capital are put in one equation show collinearity among the seven social capital variables, and for this reason, seven regressions were ran and in each regression one alternative measure of social capital has been included.The results of the seven logistic regressions with qualitative measure of relative household poverty are presented in Table 4.1. The findings therefore suggest that none of the measures of social capital has any significant influence on a household’s welfare in Sokoto metropolis. This indicates that social capital does not have any significant influence on a household’s welfare in Sokoto metropolis based on the results of logistic regression as opposed those of robust OLS. However, some of the control variables turn out to have a statistical significant influence on a household’s welfare in Sokoto metropolis. These findings are contrary to those of Penning (2008), Hu & Jones (2004), and Yusuf (2008) who find a statistical significant positive relationship between social capital and a household’s welfare. But they are concur with those of Haddad, Maluccio, & May (1999), and Antoni (2009) who find that it is not always that social capital produces a significant positive outcome on a household’s welfare.
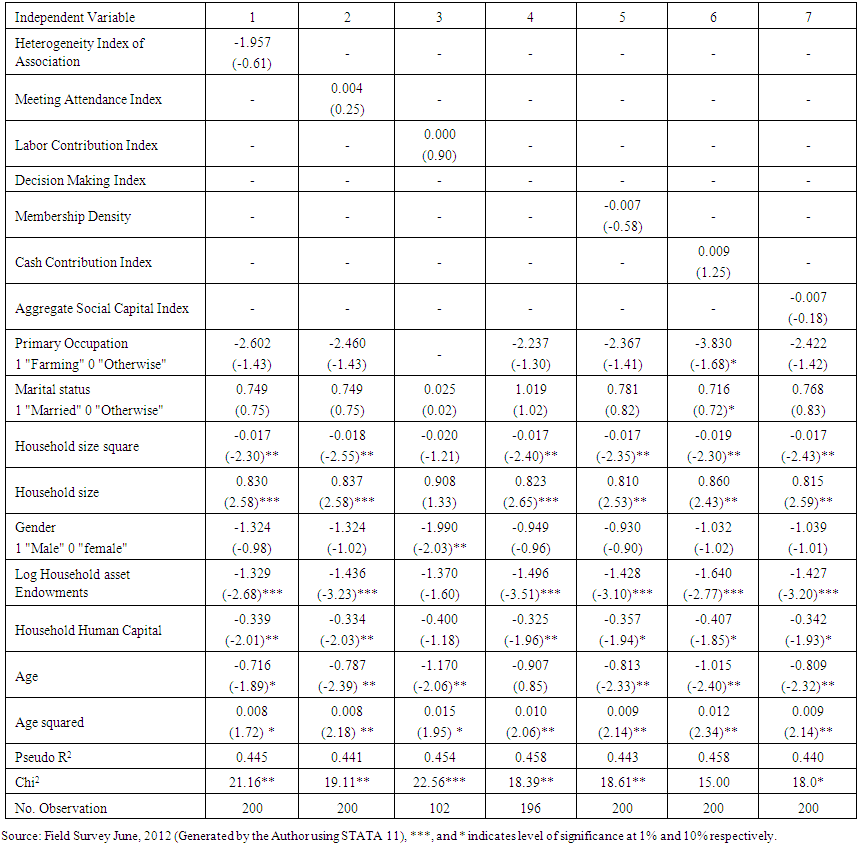 | Table 4.1. Logistic Regression Results, Making the Dependent Variable as Qualitative Measure of Relative Household Poverty (1=Relatively Poor, 0= Rich, as a Measure of a Household Welfare) |
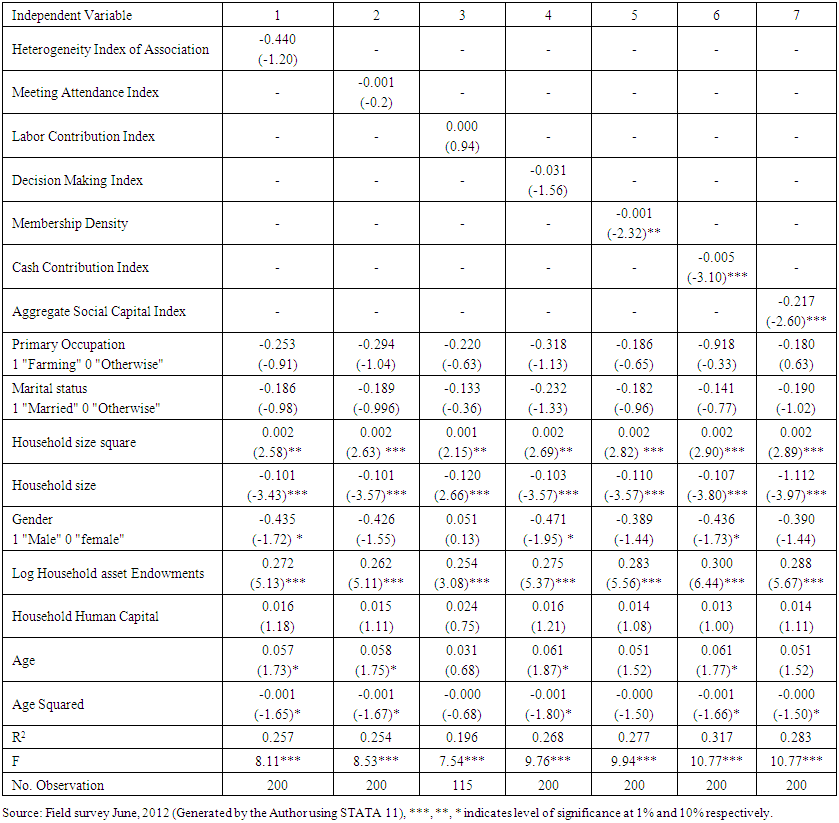 | Table 4.2. Results of Robust Ordinary Least Squares Regressions, Measuring Dependent Variable as Households Daily Per capita Expenditure (Households Welfare) |
6. Conclusions and Policy Implications
- In line with the findings of the study, the following conclusions have been drawn: Heterogeneity index of associations, associations meeting attendance index, decision making Index, and membership density of households in association measures of social capital do not have any significant influence on household welfare in Sokoto metropolis. However, cash contribution index of households to associations, labour contribution index of households to associations, and aggregate social capital index measures of social capital have a significant negative impact on household welfare in Sokoto metropolis. Furthermore, primary occupation of a household head (farming) has no significant influence on a household’s welfare. Similarly, being a household head married, household human capital, and being a male household head do not influence a household’s welfare in Sokoto metropolis. It is also concluded that household size at early stage reduces household per capita expenditure but at a given threshold, any increase in household size increases welfare as the quadratic coefficient indicates. Similarly, household assets endowment enhances a household’s welfare in Sokoto metropolis. But household head age in the long run reduces household per capita expenditure, thereby, decreases a household’s welfare.The implication of the negative impact of cash contribution index of households to associations, labour contribution index of households to associations, and aggregate social capital index on a household’s welfare is that, engagement of households in the three measures of social capital will reduce a household’s welfare among households in Sokoto metropolis. The study therefore recommends that, households in Sokoto metropolis should engage in some other social capital activities other than the ones that have negative influence on their welfare. Moreover, since household assets endowments has positive impact on a household’s welfare, policies that will promote household accumulation of these assets should be pursued.