Nassir Ul Haq Wani1, Jasdeep Kaur Dhami2
1Professor and Head of R&D, Kardan University (IACBE Accredited), Kabul, Afghanistan
2Professor and Director, CT University, Punjab, India
Correspondence to: Nassir Ul Haq Wani, Professor and Head of R&D, Kardan University (IACBE Accredited), Kabul, Afghanistan.
| Email: |  |
Copyright © 2018 Scientific & Academic Publishing. All Rights Reserved.
This work is licensed under the Creative Commons Attribution International License (CC BY).
http://creativecommons.org/licenses/by/4.0/

Abstract
In order to capture the possibilities and limits of meaningful alliances among emerging economies, this article sheds light on the prospective of trade of India against BRCS economies by employing Revealed Comparative Advantage (RCA) and Revealed Import Dependence (RID). The study period is covering 22 years from 1995-2016. The individual RCA and RID values have been calculated for the selected 64 commodities by using Leamer’s classification against BRCS economies. Although, the structure of Indo-BRCS trade relation present a changing environ as with each economy the basket of tradable commodities varies like. Using revealed comparative analysis, statistical analysis, and historical analysis and based on the data of BRICS foreign trade, some problems, as well as the achievements of the BRICS in its foreign trade, have come into limelight. The results show that considerable latency exists on the individual country basis. Apart from the existing level of trade, India also needs to focus on trade from emerging countries that are liberalizing their markets for economic growth, which could form the important avenue for its exports.
Keywords:
BRICS, Trade, RCA and RID
Cite this paper: Nassir Ul Haq Wani, Jasdeep Kaur Dhami, Trade Prospective of India against BRCS Economies: An Empirical Evaluation Based on RCA and RID Approaches, American Journal of Economics, Vol. 8 No. 1, 2018, pp. 31-46. doi: 10.5923/j.economics.20180801.06.
1. Introduction
It is of utmost importance that each country must know the prospective of trade with other countries or other regions in order to be in a stable economic position. In this perspective, India also needs to know its full trade latency with other countries or regions. The policy of trade liberalization started in July 1991, led to the performance of the India’s trade sector. Following this panorama, foreign reserves are accumulating; current account deficits have sharply fallen and a substantial surplus in invisible trade appear to be a sign of improving economic health. India’s shares in world’s exports, imports and total trade are still very low and look unimpressive when compared with other countries including its Asian neighbors. In 2016, India’s exports, imports and trade shares in the world were 2.3 percent, 3.2 percent and 1.4 percent, respectively. Therefore, India must increase its trade volume with the rest of the world for the sake of healthy economy. Hence this article makes an endeavor to categorize the commodities according to their trade potential that could enhance trade relations between India and rest BRCS economies and for the same RCA and RID indices are put into action.In international economics perspective, one of the most powerful propositions of classical trade theory is that the pattern of international trade is determined by comparative advantage. That is, a country with the comparative advantage in a given commodity exports, and the other with the comparative disadvantage imports. Thus, the question has been where then the comparative advantage originates from, and there have been numerous attempts to identify the economic conditions that determine comparative advantage. For the sake of usage, this study identifies the pattern of Revealed Comparative Advantage by using the Balassa Index (1965) for export data.
2. Literature Review
In order to depict the prospective of trade between India and BRCS (Brazil, Russia, China and South Africa) economies, relevant studies covering the dimensions of the objective are taken into contemplation. Although plethora of studies are available that can make a solid base, but very few studies shed light on BRICS considering their Intensity, Similarity and Complementarity in trade. At this decisive juncture, somehow some important studies are taken into considerations which have touched the basic methodology and hence the same methodology is employed in the objective as well. Thus the relevant research studies are summarized as follows:Castro (2012) examined the trade cooperation and inter-BRIC bilateral trade flows. The study analyzed that BRICS were emerging markets and economies with great future potential. The study depicted the trade intensity among BRICs during the period 1995-2009. Calculations were based on the Trade Intensity Index (TII), Complementary Index (CI) and Revealed Comparative Advantage (RCA). The empirical analysis assessed the intensity of bilateral trade flows not only between BRIC countries but also between BRIC and the EU as trade relations with the EU still play a considerable role for each of the BRIC countries. This study revealed that Sino-Brazilian and Sino-Indian trade as a trade with the highest intensity progression. Naude and Rossouw (2008) discussed the export diversification and economic performance of Brazil, China, India and South Africa. The study depicted the association between export diversity and economic performance. The results showed differences in the patterns of diversification in these countries. Confirmation of a U-shape relationship between per capita income and export specialization in China and South Africa, and the results from Granger causality testing were questionable and not robust. From AGE modeling, it was noticed that South Africa differs from the other economies because export diversification has an unambiguously optimistic brunt on economic development while in contrast in Brazil, China and India, it is to a certain extent export specialization that is preferred. Havlik et al. (2009) analysed the BRIC’s and the EU trade in goods and services elaborating on their global trade positions, geographical and sectoral trade compositions. The findings showed a shrinking global market share as well as their share in the BRIC’s market. It was proven that the EU still plays a substantial role in the BRIC’s trade especially by being Russia’s main export partner and China’s import partner. From an industrial competitiveness point of view, only China can represent a possible threat for the EU’s producers. In terms of GDP shares, trade in services represents a minor but an increasing role in BRICS economies. Their services exports showed faster growth rates in comparison to exports. The trends in bilateral EU–BRIC trade were also studied by Castro (2012 a, b) with an evaluation of various trade indices such as RCA, trade intensity, complementarity, similarity and trade introversion. Similar research including further indices such as market share, regional orientation and competitiveness was also elaborated by Singh et al. (2011). This analysis discussed the idea of BRICS forming a union under a PTA. According to the findings, improving indices for most of the BRICS advocate the establishment of such a PTA among the five countries. Hongna and Zengfeng (2011) depicted BRIC’s foreign trade from the perspective of a comparative, statistical and historical analysis. The study focused on trade in goods, and among others, on its composition and destination market discussion with special implications on China. The analysis showed quite high trade dependencies for BRICS (led by China in contrast to the least dependent Brazil), thus facing a risk of trade volatility that could negatively influence these economies. The study concluded that even though BRICS are emerging countries with their own problems, they could be complementary and would embrace a new growth model. In order to study the competitive and complementary position of India and China in the world economy and evaluating bilateral trade in commodities between them, Beretta and Lenti in 2012 found different paths of specialization and an intensification of bilateral trade. India’s comparative advantages were still concentrated in the traditional sector and in some manufacturing sectors, while China had got specialized in mass exports of cheap goods, becoming competitive in exports of electronic goods. India and China complement each other in many areas, as revealed by a growing inter-industry trade, and there is ample room for them to further increase bilateral trade and exchange valuable experience and learning with each other. Wani et.al. (2013) examined India’s trade relations with Brazil and focused on the importance, power and latent for enhancements in trade. The study also analyzed the future potential of the trade between the nations. Regarding the trade potential, India and Brazil were having the intensity for future enhancements in trade. Both the economies dominate the trade in their own specializations. Seema (2014) provided an appraisal of Indo-Brazil trade over the last decade which has grown considerably and has become key determinant of India-Brazil bilateral relations. The study analyzed the trade intensity of India-Brazil trade, exports, imports, balance of trade, share in world’s exports and trade pattern between the two nations during the time period of 2001-2012. The study found that the export Intensity between India and Brazil was quite high, implying huge potential for increasing Indian exports to Brazil and a low intensity of imports was found over the last decade between India and Brazil. Other findings of the study revealed that share of India’s export in world exports is quite stagnant and significantly smaller at around 1-2 per cent over the last decade which was a matter of concern. Share of Brazilian exports in world exports was also stagnant and quite low at 1 per cent over the last decade. Balance of trade has been favorable for India since 2006 except for the year 2009. Sharma (2013) also analysed the relations between India and Brazil. The study outlined that in recent year’s cooperation among India and Brazil had extended to diverse areas such as infrastructure, agriculture, information technology and pharmaceuticals. Brazil’s trade with India had witnessed a ten-fold increase in the last decade and expected to reach US$ 15 billion by 2015. This study attempted to analyse the evolution of trade intensity of India and Brazil trade, and identified its tendencies as one of the factor determining cooperation between the countries. After the examination of Indo-Brazil trade flow, the study confirmed with the policy implication that the Indo-Brazil bilateral trade and economic relations can be improved if tariffs and others barriers were considered through Free Trade Area (FTA).Xiaobo et. al. (2011) made an empirical analysis of the comparative advantages and complementarity of the agricultural trade between BRICS and the United States in terms of sixteen major agricultural products since 1997. The results indicated that exporting agri-products of BRICS and the United States reflected the characteristics of the resource endowment of each country; BRICS agri-product competitiveness had decreased after its WTO accession, while the country’s agri-export structure had been upgraded; Sino-US agri-trade dependency continued to rise, and the U.S. relied more on China than China does on the U.S.; BRICS and the United Sates had good complementarity in the agricultural trade, which strengthened after the China’s accession to the WTO. Gong and Gu (2011) analysed the revealed comparative advantage and structural complementarities of export products of Xinjiang and its neighboring countries. The study indicated that, on the view of revealed comparative advantage, the electronic products, machinery and miscellaneous manufactured products made in Xinjiang and China's mainland had significant comparative advantages; on the view of trade complementarity, the trade complementarity indexes of imports among Xinjiang and its neighboring countries were decreasing, while the trade complementarity indexes of exports among Xinjiang and its neighboring countries shown were ascending; on the view of the revealed comparative advantage and the trade complementarity, the trade structures among Xinjiang and its neighboring economies were mainly complementary, and subsidiary competitive. Yun (2012) evaluated the economic relationships among "BRICS" using several trade indices such as Trade Intensity Index, Revealed Comparative Advantage, Spearman Coefficients and Trade Complementarity Index. The results showed that "BRICS" member countries were different in resource endowment and comparative advantage, however the economic relationships were not very close and there exists competition within "BRICS". With the development of the co-operation of "BRICS", the member countries could compete upon the process of reallocation on resources and interests.
3. Research Methodology
Keeping in mind the nature of study, secondary data has been collected. Different indices and models have been used to find out the trade prospective of India against BRCS economies by employing Revealed Comparative advantage (RCA) and Revealed Import Dependence (RID).
3.1. Revealed Comparative Advantage Index
The major innovation with regard to how to measure the comparative advantage was done by Balassa (1965) in order to capture the degree of trade specialization of a country. On the basis of this index, a country is defined as being specialized in exports of a certain product if its market share in that product is higher than the average or, equivalently, if the weight of the product of the country's exports is higher than its weight of the exports of the reference area. A country reveals comparative advantages in products for which this indicator is higher than 1, showing that its exports of those products are more than expected on the basis of its importance in total exports of the reference area. In order to assess the export potential of a country Revealed Comparative Advantage is used. The index has been calculated at the commodity level using SITC Revision 3-digit level classification. The RCA connotes whether a country is in the process of extending the products in which it has a trade potential. RCA measures, if estimated at high levels of product disaggregation, can focus attention on the other non-traditional products that might be successfully exported. The RCA index of country I for the product J is often measured by the products share in the country’s exports in relation to its share in world trade. RCAij = (Xij/Xit) / (Xwj/Xwt)Where Xij and Xwj are the values of country’s exports of product j and world’s exports of product j and where Xit and Xwt refer to the country’s total exports and world total exports.Explanation:A given country is considered to have comparative advantage in commodity, when the commodity’s exports market size of country in terms of its total national exports market size is greater (less) than the commodity’s world exports market size in terms of the world total exports market size, i.e. RCA index is greater than unity. Thus, the comparative advantage point is when the value is equal to unity or above, i.e. when the size-wise importance of commodity’s market in the country is as big as that in the world export market. The Balassa Index method is basically comparing a given sector’s export performance of a given country and that “expected in a world in which world exports of the given sector are distributed among countries in proportion to their share of world exports”.
3.2. Revealed Import Dependence Index
The index identifies the commodities, which have import dependence on the partner countries. The RID index is also known as Revealed comparative disadvantage Index. The RID index gives the commodity-wise structure of imports in the countries. The RID is defined as commodity i’s share in country’s total imports vis-a-vis its share in total world imports. The RID index can be computed as followsRIDi = (Mia/Ma) / (Miw/Mw)Where Mia is equal to imports of commodity i from country a, Ma is equal to total imports of country a, Miw is equal to total value of the world imports of commodity i and Mw is equal to total world imports. An RID index exceeding one suggests a strong dependence of the country on the import of the specific item in a reference period and vice-versa.While an RCA analysis tell us about the comparative advantage that a country enjoys in the export of certain commodities in general, it does not necessarily tell us about the specific import requirements of the countries being focused for exports. So, although India may have a comparative advantage in the export of certain commodities, it may not be necessary that other (Brazil, Russia, China and South Africa) has a requirement for the same commodities. A comparison of the RCA of commodities in India with the RID value of commodities in Brazil, Russia, China and South Africa will give a more reliable picture of the export potential of the Indian goods in Brazil, Russia, China and South Africa and vice-versa. If for a certain commodity India has a RCA index greater than one, and for the same commodity Brazil, Russia, China and South Africa has a RID greater than one, then such a commodity is considered to have a strong export potential in that particular country. The RCA and RID values for India and other BRCS economies are calculated and matched to assess the commodity potential for commodity trade between the nations.The organization of the rest article is as follows: section 2 depicts the identification of potential commodities between India and BRCS economies and lastly, section 3 brings out the overall conclusions with the necessary policy implications.
4. Findings and Analysis
4.1. Analysis of Identification of Potential Commodities between India and Brazil and Vice-versa
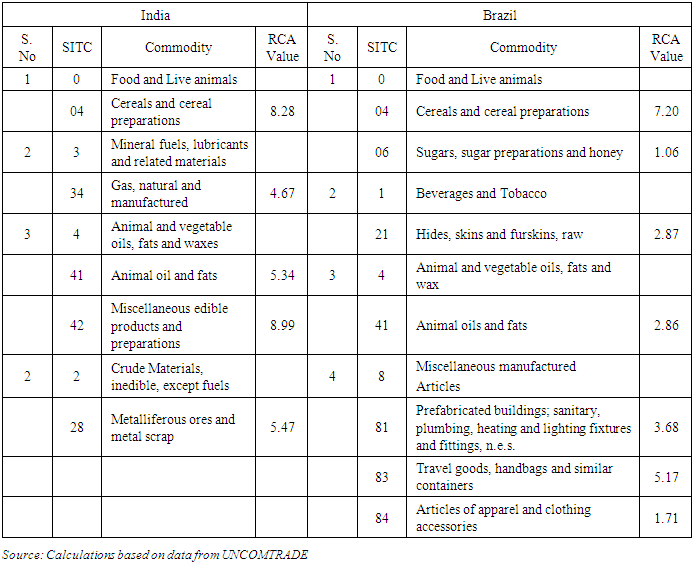
To meet the requirement for assessing the identification of potential commodities, this section identifies the pattern of RCA by using the Balassa index (1965) for export data and revealed import dependence (RID) for import data as has been used by Wani and Dhami in 2014. RCA indices use the trade pattern to identify the commodities in which an economy has a comparative advantage, by comparing the country of interests’ trade profile with the world average. Both the indices (RCA and RID) have been calculated for the time period of 22 years, that is, 1995–2016 and the average value is presented for the purpose of analysis which would provide a clear picture regarding the commodity trade of India and Brazil. A comparison of RCA index of the various commodities between India and Brazil helps us in identifying the commodities, which are either competitive or complementary in nature. First, the items having RCA index greater than 1 for Brazil and India are presented in Table 1.Table 1. Commodities with RCA >1 for India and Brazil (1995-2016 Average value)
 |
| |
|
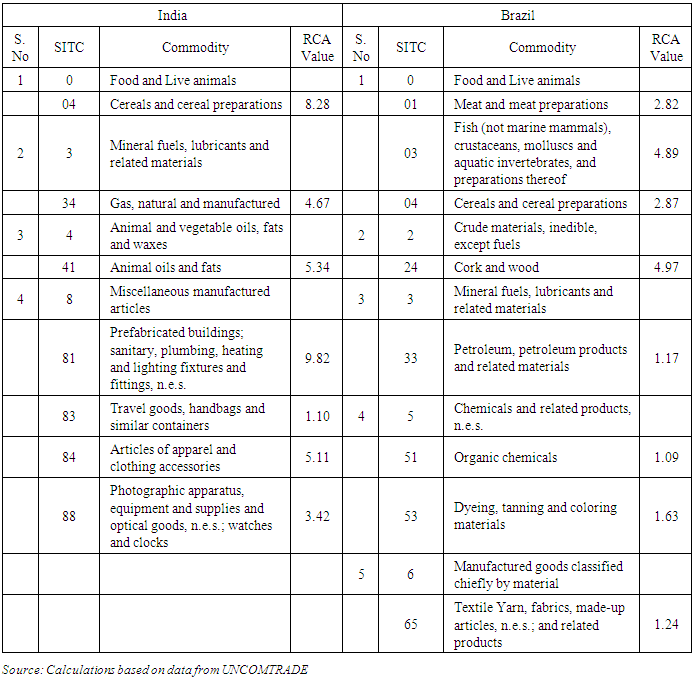
Table 1 presents that Brazil enjoys RCA in four categories and the RCA index is greater than 1 with respect to 7 commodities and for India RCA is visible in two categories and a total of 5 commodities exhibited RCA index greater than 1. In case of Brazilian economy, the commodities having RCA greater than 1 prove as an important source of generating revenue. Out of the 7 commodities, (04) Cereals and cereal preparations, (06) Sugars, sugar preparations and honey, (21) Hides, skins and furskins, raw, (41) Animal oils and fats, (81) Prefabricated buildings; sanitary, plumbing, heating and lighting fixtures and fittings, n.e.s., (83) Travel goods, handbags and similar containers and (84) Articles of apparel and clothing accessories exhibit the noted values, thus indicating the comparative advantage enjoyed by Brazil, and in case of India, (04) Cereals and cereal preparations, (34) Gas, natural and manufactured, (41) Animal oil and fats, (42) Miscellaneous edible products and preparations and (28) Metalliferous ores and metal scrap prove as the potential commodities. From the above analysis, it is clear that India dominates in agricultural exportations and Brazil regarding as the best performer in manufacturing commodities.Now assessing and identifying the commodities, which have import dependence on the partner countries, Revealed Import Dependence (RID) is employed. The RID index is also known as RCD (Revealed Comparative Disadvantage) index. The RID index gives us the commodity-wise structure of imports in the countries. In this regard Table 2 presents the RID of India and Brazil among the 64 commodities analyzed for the purpose. The commodities with RID value greater than 1 imply the RCD. Five such commodity classifications for Brazil with 8 commodities and four such commodity classifications for India with 7 commodities present the import pattern of these commodities. For Brazil, a total of 8 commodities out of 64 commodities analyzed were imported and presented in five categories, viz. (0) Food and Live animals, (2) Crude materials, inedible, except fuels, (3) Mineral fuels, lubricants and related materials, (5) Chemicals and related products, n.e.s. and (6) Manufactured goods classified chiefly by material.Table 2. Commodities with RID >1 for India and Brazil (1995-2016 Average value)
 |
| |
|
From the above Table 2, it is clear that in case of Brazilian imports, (01) Meat and meat preparations, (03) Fish (not marine mammals), crustaceans, molluscs and aquatic invertebrates, and preparations thereof, (04) Cereals and cereal preparations, (24) Cork and wood, (33) Petroleum, petroleum products and related materials, (51) Organic chemicals, (53) Dyeing, tanning and coloring materials and (65) Textile Yarn, fabrics, made-up articles, n.e.s.; and related products have shown the highest RID values, and thus present the import pattern. With respect to India, the highest RID value is described by (04) Cereals and cereal preparations, (34) Gas, natural and manufactured, (41) Animal oils and fats, (81) Prefabricated buildings; sanitary, plumbing, heating and lighting fixtures and fittings, n.e.s. (83) Travel goods, handbags and similar containers, (84) Articles of apparel and clothing accessories and (88) Photographic apparatus, equipment and supplies and optical goods, n.e.s.; watches and clocks.
4.1.1. Commodities with Trade Potential between India and Brazil and Vice-versa
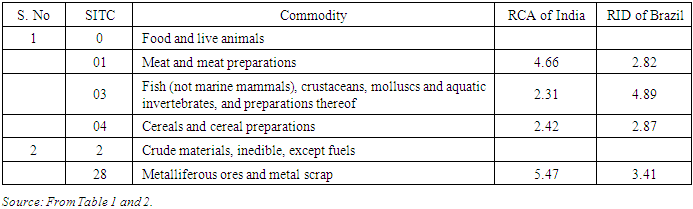
For the sake of export promotion, developed countries follow protectionist trade practices, but the developing world needs an edge to find out ways to guide their exports in the global market. The strategy according to Dr. Joseph Stieglitz (Chief Economist at World Bank) is to create internal market for their products within the peripheries of their reach. When huge internal demand arises, that results in real growth of the economy. Besides, opening of the trade sector itself attracts higher doses of investment as FDI (foreign direct investment) is now increasingly connected with trading opportunity.The commodities with potential for trade (RCA > 1) for India are matched with the commodities with RCD of Brazil (RID > 1) and vice versa are depicted in Tables 1 and 2 respectively. From the analysis, a total of 13 commodities exhibit good trade potentiality between the two nations. In this connection, Table 3 presents that a total of 5 commodities which prove as mutually amicable trade between India and Brazil as for these commodities India has RCA (RCA > 1) and Brazil has RCD (RID > 1) which state that the commodities can be traded between the two countries. The commodities which are having the vast scope for trade include: (01) Meat and meat preparations, (03) Fish (not marine mammals), crustaceans, molluscs and aquatic invertebrates, and preparations thereof (04) Cereals and cereal preparations and (28) Metalliferous ores and metal scrap.Table 3. Commodities with RCA>1 for India and RID>1 for Brazil
 |
| |
|
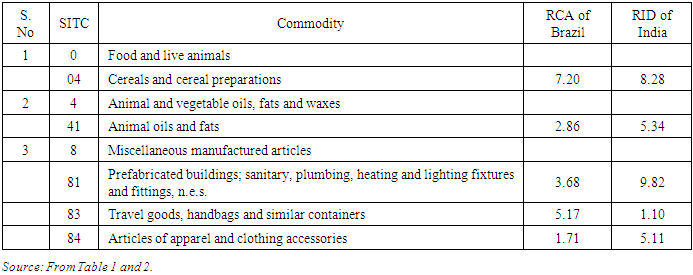
Table 4 presents a list of 8 commodities which prove as mutually amicable tradable commodities between Brazil and India as for these commodities Brazil has RCA (RCA > 1) and India has RCD (RID > 1) which state that the commodities can be traded between the two countries. Brazil and India play an important role in world trade. In 2008, the combined exports of both countries comprised 2.4 per cent and 3.5 per cent of the world exports in goods and services, respectively. India is among the world’s 15 leading exporters and importers of services, while Brazil continues to expand its services trade from a relatively small base. India and Brazil enjoy comparative advantage for labour- and resource-intensive sectors in the global market. India enjoys comparative advantage in the exports of labour-intensive items such as textiles and scale-intensive items such as chemicals and iron and steel while Brazil enjoys advantage in manufacturing goods such as instruments, sanitary fittings and capital-intensive products. Given the proper policies and political will of Brazil and India, dynamic complementarities can be built between both strategic possibilities. It is important for Brazil to understand clearly India’s current challenges and perspectives, both domestically and internationally. A greater cooperation between India and Brazil, two of the world’s largest democracies, are in order and benefit each other, since their economies share enormous synergies and supplement each other, particularly in agriculture, where Brazil, a major exporter, can become a reliable partner for India. Great partnerships only happen after many successful negotiations take place. It is time to negotiate and secure greater cooperation.Table 4. Commodities with RCA>1 for Brazil and RID>1 for India
 |
| |
|
4.2. Analysis of Identification of Potential Commodities between India and Russia and Vice-versa
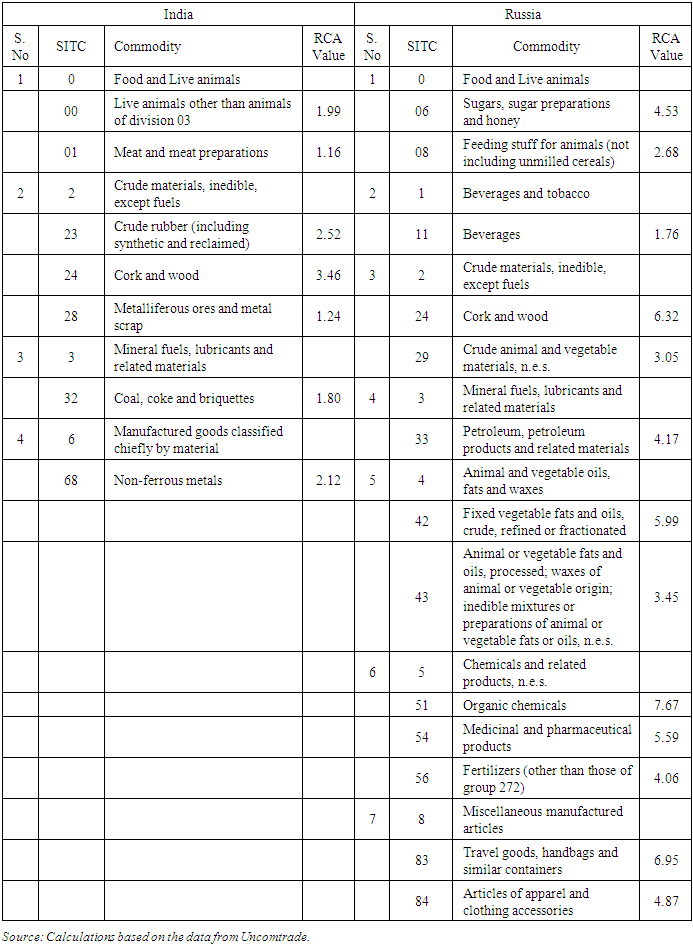
Undoubtedly, both India and Russia are sovereign countries and would be looking after their own in the first instance. The understanding between Russia and India flowed from the complimentarily of their interests both in historical, geopolitical and futuristic terms. Whether it was the question of trade or other sorts of decision, the Russian and Indian interests generally tended to coincide and there is certain empathy for each other. There is therefore, an intrinsic value in the Indo-Russia ties. This does not exclude differences of approach on certain specific issues but the general and overall parallelism of interests has been evident. The two sides so far have soft understanding of each other's concerns while retaining their autonomy of action and expanding their relations with diverse other countries. There is thus a common vision between the two countries that seems to be re-emerging as the test of bilateral ties lies in the commonality of approach to problems and conflicts. To discuss the latency of Indo-Russia Merchandise trade, a comparison of RCA index of the various commodities between India and Russia is done for identifying the commodities, which are either competitive or complementary in nature. First, the items having RCA index greater than 1 for Russia and India are presented in Table 5.Table 5. Commodities with RCA >1 for India and Russia (1995-2016 Average value)
 |
| |
|
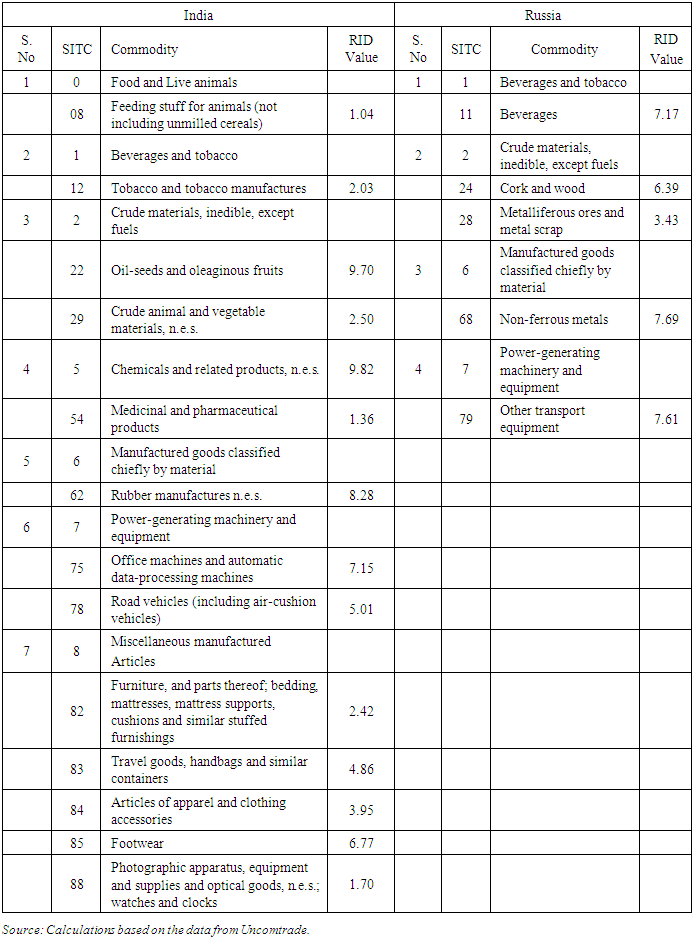
Table 5 presents that Russia enjoys RCA in seven categories and the RCA index is greater than 1 with respect to 14 commodities and for India RCA is visible in four categories and a total of 8 commodities exhibited RCA index greater than 1. In case of Russian economy, the commodities having RCA greater than 1 prove as an important source of engendering revenue. Out of the 64 commodities, (06) Sugars, sugar preparations and honey, (08) Feeding stuff for animals (not including unmilled cereals), (11) Beverages, (24) Cork and wood, (29) Crude animal and vegetable materials, n.e.s., (33) Petroleum, petroleum products and related materials, (42) Fixed vegetable fats and oils, crude, refined or fractionated, (43) Animal or vegetable fats and oils, processed; waxes of animal or vegetable origin; inedible mixtures or preparations of animal or vegetable fats or oils, n.e.s., (51) Organic chemicals, (54) Medicinal and pharmaceutical products, (56) Fertilizers (other than those of group 272, (83) Travel goods, handbags and similar containers and (84) Articles of apparel and clothing accessories exhibit the noted values, thus indicating the comparative advantage enjoyed by Russia, and in case of India, (00) Live animals other than animals of division 03, (01) Meat and meat preparations, (23) Crude rubber (including synthetic and reclaimed), (24) Cork and wood, (28) Metalliferous ores and metal scrap, (32) Coal, coke and briquettes and (68) Non-ferrous metals prove as the potential commodities. From the above analysis, it is clear that India dominates in agricultural exportations and also in manufacturing commodities and Russia dominates in the manufacturing base.Now in order to assess and identify the commodities, which have import dependence on the partner countries. For that purpose, Revealed Import Dependence (RID) is employed. The RID index is also known as RCD (Revealed Comparative Disadvantage) index. The RID index will give us the commodity-wise structure of imports in the countries. In this regard Table 6 presents the RID of India and Russia among the 64 commodities analyzed for the purpose. The commodities with RID value greater than 1 imply the RCD. Four such commodity classifications for Russia with 5 commodities and seven such commodity classifications for India with 13 commodities present the import pattern of these commodities. For Russia, a total of 5 commodities out of 64 commodities analyzed were imported and presented in five categories, viz. (1) Beverages, (2) Crude materials, inedible, except fuels, (6) Manufactured goods classified chiefly by material and (7) Power generating machinery and equipment.Table 6. Commodities with RID >1 for India and Russia (1995-2016 Average value)
 |
| |
|
From the above Table 6, it is clear that in case of Russian imports, (11) Beverages, (24) Cork and wood, (04) Cereals and cereal preparations, (24) Cork and wood, (28) Metalliferous ores and metal scrap, (68) Non-ferrous metals and (79) Other transport equipment have shown the highest RID values, and thus present the import pattern. With respect to India, the highest RID value is described by (08) Feeding stuff for animals (not including unmilled cereals), (12) Tobacco and tobacco manufactures, (82) Furniture, and parts thereof; bedding, mattresses, mattress supports, cushions and similar stuffed furnishings, (83) Travel goods, handbags and similar containers, (84) Articles of apparel and clothing accessories, (85) Footwear and (88) Photographic apparatus, equipment and supplies and optical goods, n.e.s.; watches and clocks.
4.2.1. Commodities with Trade Potential between India and Russia and Vice-versa
Every economy is in quench of promoting its exports, but the specification is to meet the ends meet. For meeting the export promotion policies, developed countries follow protectionist trade practices (imposition of tariffs, quotas, taxes etc.), but the developing economies need a rim to find out ways to channel their exports in the worldwide market. The strategy is to create internal market for their products within the peripheries of their reach at lowest possible prices which would be competitive enough to gauge the external market. When huge internal demand arises, that results in real growth of the economy. Besides, opening of the trade sector will by itself attract higher doses of investment as FDI (foreign direct investment) is now increasingly connected with trading opportunity. The commodities with potential for trade (RCA > 1) for India are matched with the commodities with RCD of Russia (RID > 1) and vice versa are depicted in Table 7. From the analysis, a total of 9 commodities exhibit good trade potentiality between the two nations.Table 7. Commodities with RCA>1 for India and RID>1 for Russia
 |
| |
|
Table 8 below presents that a total of 5 commodities which prove as mutually amicable trade between India and Russia as for these commodities India has RCA (RCA > 1) and Russia has RCD (RID > 1) which state that the commodities can be traded between the two countries. The commodities which are having the vast scope for trade include: (24) Cork and wood, (28) Metalliferous ores and metal scrap, (68) Non-ferrous metals, (83) Travel goods, handbags and similar containers and (84) Articles of apparel and clothing accessories.Table 8. Commodities with RCA>1 for Russia and RID>1 for India
 |
| |
|
Thus the prospects of trade relations between the two countries in the twenty-first century certainly imply coordinate actions taken in response to the challenges of the new century. There is a need to coordinate the actions. Because with the advent of the new century the international environment in which these two states play the part of sovereign actors has become more intricate and complicated. The commonality of the key national interests and the long-term friendly relations in the field of economy, culture, science and technology create a real possibility for cooperation between three great Eurasian powers. Thus, there is a need of revitalizing the existing economic links between these two giant economies.
4.3. Analysis of Identification of Potential Commodities between India and China and Vice-versa
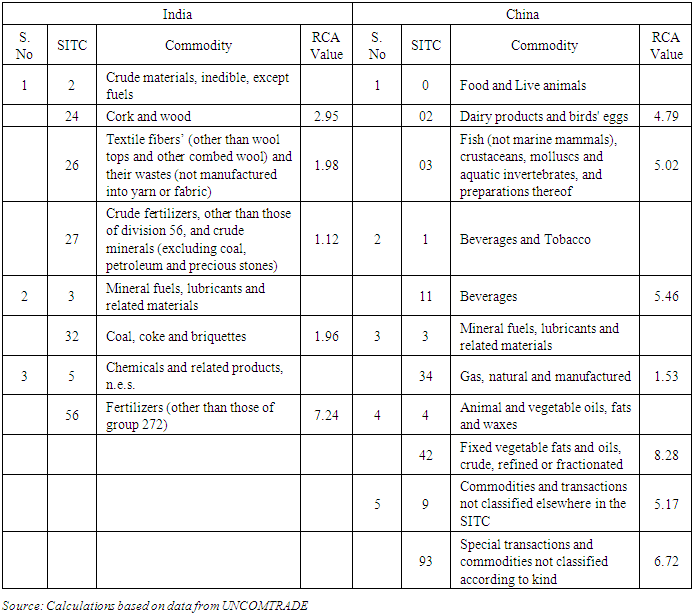
This section aims at understanding the possibility of commodity trade between India and China. The identification of commodities which enjoy RCA would enable policy makers to formulate an appropriate strategy, which would help to accelerate exports of the specified commodities. An attempt has been made here to identify those products in which India and China enjoy comparative advantage against one another. Both the indices (RCA and RID) have been calculated for the time period of 22 years, that is, 1995-2016 and the average value is presented for the purpose of analysis which would provide a clear picture regarding the commodity trade of India and China. A comparison of RCA index of the various commodities between India and China helps us in identifying the commodities, which are either competitive or complementary in nature. First, the items having RCA index greater than 1 for India and China are presented in Table 9.Table 9. Commodities with RCA >1 for India and China (1995-2016 Average value)
 |
| |
|
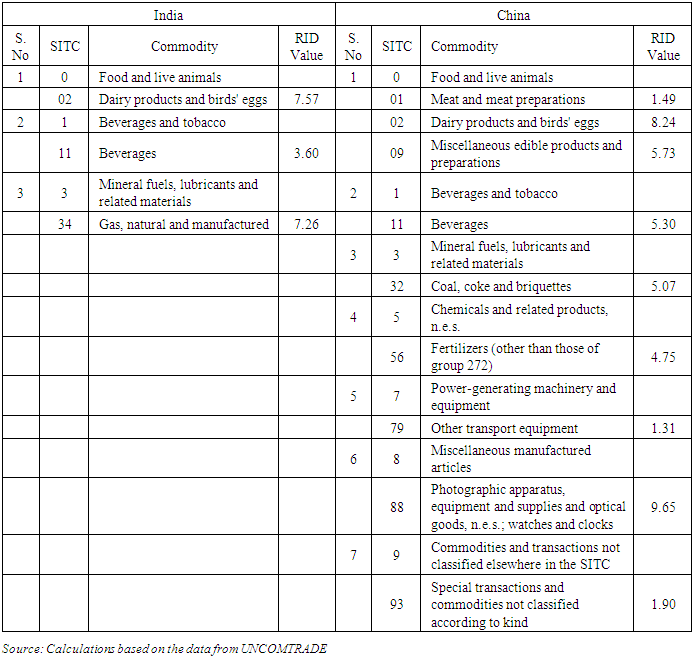
Table 9 presents that India enjoys RCA in three categories and the RCA index is greater than 1 with respect to 5 commodities and for China RCA is visible in five categories and a total of 6 commodities exhibited RCA index greater than 1. In case of China, the commodities having RCA greater than 1 prove as an important source of generating revenue. Out of the 6 commodities, (02) Dairy products and birds' eggs, (03) Fish (not marine mammals), crustaceans, molluscs and aquatic invertebrates, and preparations thereof, (11) Beverages, (34) Gas, natural and manufactured, (42) Fixed vegetable fats and oils, crude, refined or fractionated and (93) Special transactions and commodities not classified according to kind exhibit the noted values, thus indicating the comparative advantage enjoyed by China, and in case of India, (24) Cork and wood, (26) Textile fibers’ (other than wool tops and other combed wool) and their wastes (not manufactured into yarn or fabric), (27) Crude fertilizers, other than those of division 56, and crude minerals (excluding coal, petroleum and precious stones), (32) Coal, coke and briquettes and (56) Fertilizers (other than those of group 272) prove as the potential commodities. From the above analysis, it is clear that India dominates in agricultural exportations and China regarded as the best performer in manufacturing commodities with vast diversification base.Now in order to assess and identify the commodities, which have import dependence on the partner countries, Revealed Import Dependence (RID) is employed. In this regard Table 10 presents the RID of India and China among the 64 commodities analyzed for the purpose. The commodities with RID value greater than 1 imply the RCD. Seven commodity classifications for China with 9 commodities and three commodity classifications for India with 3 commodities present the import pattern of these commodities. For China, a total of 9 commodities out of 64 commodities analyzed were imported and presented in seven categories, viz. (0) Food and Live animals, (1) Beverages and tobacco, (3) Mineral fuels, lubricants and related materials, (5) Chemicals and related products, n.e.s., (5) Power generating machinery and equipment, (8) Miscellaneous manufactured articles and (9) Commodities and transactions not classified elsewhere in the SITC.Table 10. Commodities with RID >1 for India and China (1995 -2016 Average value)
 |
| |
|
From the above Table 10, it is clear that in case of China’s imports, (01) Meat and meat preparations, (02) Dairy products and birds' eggs, (09) Miscellaneous edible products and preparations, (11) Beverages, (32) Coal, coke and briquettes, (56) Fertilizers (other than those of group 272), (79) Other transport equipment, (88) Photographic apparatus, equipment and supplies and optical goods, n.e.s.; watches and clocks and (93) Special transactions and commodities not classified according to kind have shown the highest RID values, and thus present the import pattern. With respect to India, the highest RID value is described by (02) Dairy products and birds' eggs, (11) Beverages and (34) Gas, natural and manufactured.
4.3.1. Commodities with Trade Potential between India and China and Vice-versa
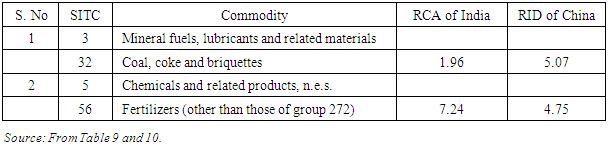
India must adopt a forward looking strategy aimed both at neutralizing Chinese competition by making Indian goods more competitive as well as pushing Indian exports into Chinese market. To enhance trade complementarities, India needs to diversify into medium and high-technology products. Moreover, the attempts must also be made to strengthen the intra-industry trade between the two countries. The RCA index for sectors like petroleum, forest products, and machinery is less than unity. The RCA index of labour intensive manufacture sector is also less than unity though both countries are labor abundant. India’s comparative advantage is focused in sectors like raw materials, tropical agricultural products, animal products, cereals, capital intensive manufacture, and chemicals. Similarly, China’s comparative advantage is focused in sectors like raw materials, tropical agricultural products, animal products, labour intensive manufactures, capital intensive manufactures, cereals, machinery, and chemicals. The commodities with potential for trade (RCA > 1) for India are matched with the commodities with RCD of China (RID > 1) and vice versa are depicted in Tables 9 and 10 respectively. From the analysis, a total of 9 commodities exhibit good trade potentiality between the two nations. Table 11 presents that a total of 2 commodities which prove as mutually amicable trade between India and China as for these commodities India has RCA (RCA > 1) and China has RCD (RID > 1) which state that the commodities can be traded between the two countries. The commodities which are having the vast scope for trade include: (32) Coal, coke and briquettes, (56) Fertilizers (other than those of group 272).Table 11. Commodities with RCA>1 for India and RID>1 for China
 |
| |
|
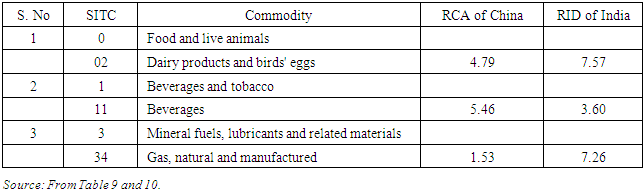
From the above Table 11, India enjoys comparative advantage in two commodities namely Coal, coke and briquettes (32) and Fertilizers (other than those of group 272) (56). Table 12 presents that a total of 3 commodities prove as mutually amicable potential items between China and India as for these commodities has RCA (RCA > 1) and India has RCD (RID > 1) which state that the commodities can be traded between the two countries. The commodities which are having the vast scope for trade include: (02) Dairy products and birds' eggs, (11) Beverages and (34) Gas, natural and manufactured. The structure of comparative advantage enjoyed by India and China with one another in a comparative framework is presenting a zig-zag trend. Out of 64 products, there are some products in which India as well as China have revealed comparative advantage. India and China both enjoy maximum advantage in the category of raw material. The RCA index for sectors like petro, forest products, and machinery is less than unity. The RCA index of labour intensive manufacturing sector is also less than unity. Both countries are labor abundant, with a total population of 1.34 billion people in China and 1.26 billion people in India. India’s comparative advantage is focused in sectors like raw materials, tropical agricultural products, animal products, cereals, capital intensive manufacture, and chemicals. Similarly, China’s comparative advantage is focused in sectors like raw materials, tropical agricultural products, animal products, labour intensive manufactures, capital intensive manufactures, cereals, machinery, and chemicals. There is a huge prospects to enhance economic cooperation between India and China and to identify sub-sectors where potential exists for mutual economic cooperation. On the basis of the observations, there is lot of untapped greater cooperation between the two countries. However, both countries face the same task of removing obstacles to growth, ensuring optimum utilization of resources and correcting the earlier misallocations. Consequently, both have a lot to learn from each other. Table 12. Commodities with RCA>1 for China and RID>1 for India
 |
| |
|
Hence, this section has specified certain lines of action which would be helpful in gaining the maximum benefit from mutual economic interactions between India and China. Further, the two countries are also looking for free trade arrangement, which will boost the economic ties between the two. Both stand to gain significantly by striking synergies in trade and business. By coming together and drawing on their advantages, India and China can not only make a strong regional impact but also make a mark in the world, by giving shape to a new economic world order and thereby making the 21st century a truly Asian one.
4.4. Analysis of Identification of Potential Commodities between India and South Africa and Vice-versa
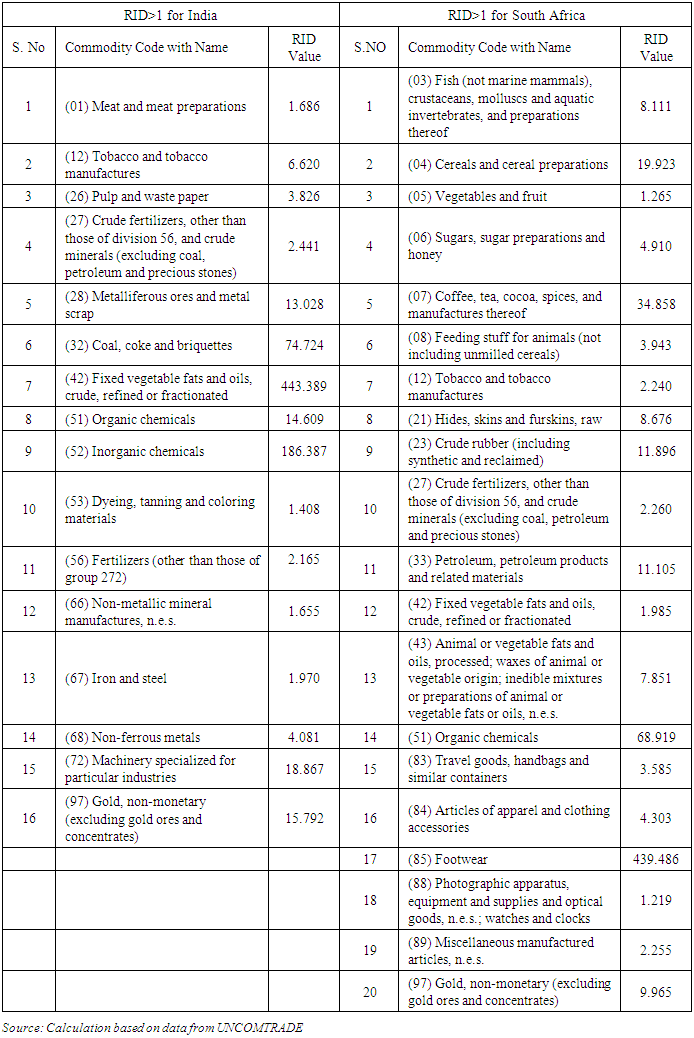
In the era of multilateralism it is proven that regionalism has not lost its importance. Proving this India has emerged as one of the largest trading partner of South Africa. With stupendous success in achieving amplified growth, India and South Africa are the fastest growing emerging powers. Both countries are regarded as economic and political drivers of the international economy, particularly in the trade arena. Sprouting up of India and South Africa as emerging economies since early 1990’s was only after these countries had followed liberal policy regime and removed the restrictive trade barriers to integrate with rest of the world. In the past few years there has been a significant rise in India’s economic engagement with South Africa in terms of commerce and investments interactions. This section aims at understanding the possibility of commodity trade between India and South Africa. An attempt has been made here to identify those products in which India and South Africa enjoy comparative advantage against one another. Both the indices (RCA and RID) have been calculated for the time period of seventeen years, that is, 2000-2016 and the average value is presented for the purpose of analysis which would provide a clear picture regarding the commodity trade of India and South Africa (as data is not available from 1995 to 1999 for South Africa). A comparison of RCA index of the various commodities between India and South Africa helps us in identifying the commodities, which are either competitive or complementary in nature. First, the items having RCA index greater than 1 for India and South Africa are presented as follows.The descriptive analysis of India’s comparative advantage against South Africa and vice-versa is that India enjoys comparative advantage in 5 commodities i.e. (02) Dairy products and birds' eggs, (00) Live animals other than animals of division 03, (08) Feeding stuff for animals (not including unmilled cereals), (06) Sugars, sugar preparations and honey, (82) Furniture, and parts thereof; bedding, mattresses, mattress supports, cushions and similar stuffed furnishings, whereas 11 commodities (02) Dairy products and birds' eggs, (03) Fish (not marine mammals), crustaceans, molluscs and aquatic invertebrates, and preparations thereof, (07) Coffee, tea, cocoa, spices, and manufactures thereof, (08) Feeding stuff for animals (not including unmilled cereals), (12) Tobacco and tobacco manufactures, (29) Crude animal and vegetable materials, n.e.s., (33) Petroleum, petroleum products and related materials, (53) Dyeing, tanning and coloring materials, (64) Paper, paperboard and articles of paper pulp, of paper or of paperboard, (73) Metalworking machinery, (97) Gold, non-monetary (excluding gold ores and concentrates) from South African side have comparative advantage against India. South Africa's exports to India are concentrated in a narrow range of products, exporting countries, but showing signs of diversification. An interesting feature is quiet visible that some commodities (02) Dairy products and birds' eggs and (08) Feeding stuff for animals (not including unmilled cereals) acts as a common pool of commodities in which both the commodities are enjoying comparative advantage against one other. This is actually because of export-re-export promotion policy.Table 13. Commodities with RID Index Value >1 for India and South Africa (2000-2016)
 |
| |
|
Based on RID value, India has import dependence on 16 commodities from South Africa and South Africa relies on 20 commodities from India. The 16 commodities which India imports from South Africa include: (68) Non-ferrous metals, (53) Dyeing, tanning and coloring materials (52) Inorganic chemicals (66) Non-metallic mineral manufactures, n.e.s., (01) Meat and meat preparations (67) Iron and steel, (12) Tobacco and tobacco manufactures, (26) Pulp and waste paper, (56) Fertilizers (other than those of group 272), (28) Metalliferous ores and metal scrap, (32) Coal, coke and briquettes, (42) Fixed vegetable fats and oils crude, refined or fractionated, (51) Organic chemicals, (72) Machinery specialized for particular industries, (97) Gold non –monetary including ores and concentrates are showing significant values, whereas South Africa imports 20 commodities from India which include: (03) Fish (not marine mammals), crustaceans, molluscs and aquatic invertebrates, and preparations thereof, (04) Cereals and cereal preparations, (05) Vegetables and fruit, (06) Sugars, sugar preparations and honey, (07) Coffee, tea, cocoa, spices, and manufactures thereof, (08) Feeding stuff for animals (not including unmilled cereals), (12) Tobacco and tobacco manufactures, (21) Hides, skins and furskins, raw (23) Crude rubber (including synthetic and reclaimed), (27) Crude fertilizers, other than those of division 56, and crude minerals (excluding coal, petroleum and precious stones) (33) Petroleum, petroleum products, (42) Fixed vegetable fats and oils, crude, refined or fractionated, (43) Animal or vegetable fats and oils, processed; waxes of animal or vegetable origin; inedible mixtures or preparations of animal or vegetable fats or oils, n.e.s. (51) Organic chemicals, (83) Travel goods, handbags and similar containers, (84) Articles of apparel and clothing accessories, (84) Articles of apparel and clothing accessories, (85) Footwear, (88) Photographic apparatus, equipment and supplies and optical goods, n.e.s.; watches and clocks, (89) Miscellaneous manufactured articles, n.e.s. (97) Gold, non-monetary (excluding gold ores and concentrates).According to Adam Smith, each nation should look for absolute advantage. However, what can nations do when they do not possess Absolute advantage? Thus the final call is death for absolute advantage. Despite the seemingly abstract reasoning, a theory of Comparative advantage is practical. Relative to other previous theories, the theory seems counter-intuitive. In response to this, famous British Economist David Ricardo developed a theory of Comparative advantage in 1817. Comparative advantage is defined as the relative (not absolute) advantage in one economic activity that one nation enjoys in comparison with other nations. It is quiet visible that the modes of entry into one another market depends on the domestic demand and factor endowments. Although India is an agricultural driven economy and hence exporting agricultural products whereas, South Africa is having strong manufacturing base, thus importing labor-intensive commodities from Indian market. An interesting feature which seems to be of immense importance for both the economies is the inclusion of common pool of commodities which are imported by one another against each other. The commodities which entail this process are: (12) Tobacco and tobacco manufactures, (42) Fixed vegetable fats and oils, crude, refined or fractionated, (51) Organic chemicals, (52) Inorganic chemicals, (53) Dyeing, tanning and coloring materials, (66) Non-metallic mineral manufactures, n.e.s., (67) Iron and steel, (68) Non-ferrous metals, (72) Machinery specialized for particular industries and (97) Gold, non-monetary (excluding gold ores and concentrates). Both India and South Africa are seeking to derive economic benefit from their trade interactions, and this is largely reflected in the patterns of their exports and imports. The trade between India and African continent hatch’s a new dimension to trade policy analysts; as it is being projected that the level of trade could increase to US$ 80 billion by 2020, with South Africa having a large proportion (Biswas, 2016). The emergence of Africa as a strategic trading partner for India has been rapid and dramatic. In 2005, South Africa accounted for 3.5 per cent of India's total imports - a share that more than doubled to 8.6 per cent by 2011. In terms of product specialization, crude oil and gas account for over two-thirds of exports to India, gold and other precious metals accounting for another 16 per cent of exports. The top six products viz. crude oil (60 per cent), gold (15 per cent), phosphoric acid (3.8 per cent), coal (3.5 per cent), liquefied natural gas (2.7 per cent) and shelled cashew (2.6 per cent), account for over 87 per cent of total African exports to India. As most of these are commodities, African exports are linked heavily to the movement of global commodity prices. Due to the persistent rise in global commodity prices, besides the sharp decline in 2009, commodity exporters in South Africa has seen their export receipts rise faster than the volume of exports. Oil exports have nearly doubled between 2005 and 2016. Similarly, the price of gold, a major export commodity of South Africa to India, has more than tripled between 2005 and 2014. Exports from South Africa to India are predominantly of gold and coal. India is the world's largest importer of gold and South Africa supplies over 11 per cent of India's overall gold imports.
4.4.1. Commodities with Trade Potential between India and South Africa and Vice versa
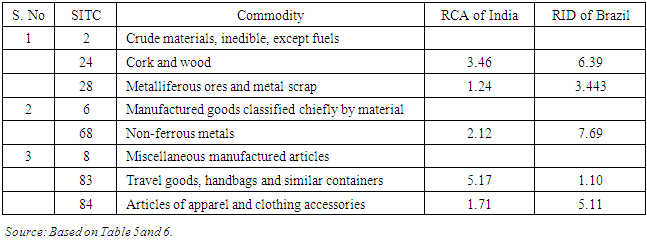
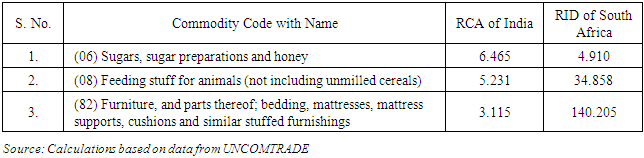
The increase in Indo –South African trade is partly the result of official coordination between India and South Africa, such as the launch of the duty free tariff preference scheme for LDCs in 2008. For the sake of export promotion, developed countries follow protectionist trade practices, but the developing world needs an edge to find out ways to guide their exports in the global market. One of the ways is to channel and create internal market for their products within the peripheries of their reach. When huge internal demand arises, that results in real growth of the economy. The emergence of South Africa as a strategic trading partner for India has been dramatic and rapid. Trade flows from the heart of economic diplomacy, particularly when it relates to commercial activities. Both Indian and African economies are too much aligned to regional processes, even though they strongly adhere to the multilateral process. The commodities with potential for trade (RCA > 1) for India are matched with the commodities with RCD of South Africa (RID > 1) and vice versa are depicted in Table 14 and 15 respectively. From table 14, only three commodities exhibit good trade potentiality from Indian side and from Table 15 only one commodity proves as a potential commodity for South Africa.Table 14. Commodities with RCA>1 for India and RID > 1 South Africa
 |
| |
|
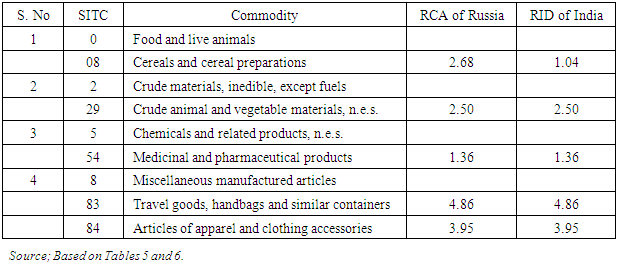
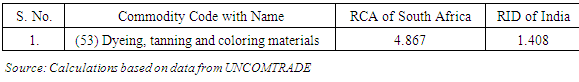
Table 15. Commodities with RCA >1 for South Africa and RID > 1 India
 |
| |
|
The commodities which are having the vast scope for trade include: (SITC 06) Sugars, sugar preparations and honey, Feeding stuff for animals (not including unmilled cereals (SITC 08), Furniture, and parts thereof; bedding, mattresses, mattress supports, cushions and similar stuffed furnishings (SITC 82), Dyeing, tanning and coloring materials with (SITC 53) that could be matched for exploring further opportunities of trade between the countries under study which were presented in Table 15 (RCA > 1) for South Africa and (RID > 1) for India. The analysis finds that out of the 64 commodities that were taken for the study, 4 commodities found a mutually potential market between India and South Africa. In the global world marketplace, India and South Africa enjoy comparative advantages for labor and resource intensive sector. India has privilege advantage in exporting agricultural items such as live animals other than animals of division 03, Feeding stuff for animals (not including unmilled cereals), Sugars, sugar preparations and honey and South Africa specializes in manufacturing items such as paper and pulp, metalworking machinery. This reveals that India dominates in agricultural exportations and South Africa do well in manufacturing commodities. In year 2015-2016, India’s total export of agricultural commodities to South Africa was of the order of US $ 470.35 million. South Africa import baskets consist of many commodities for which country has to depend on India to import the commodities. Commodities such as feeding stuff for animals (not including unmilled cereals), furniture, and parts thereof; bedding, mattresses, mattress supports, cushions and similar stuffed furnishings matches the trade potential between India and South Africa. Admittedly these commodities prove as reciprocally exclusive for trade between two countries. The common pool of commodities between India and South Africa having RCA value greater than unity includes agricultural products. Therefore, there is a lucrative opportunity for both nations to re-export these items. On the other side, in common pool basket of India and South Africa imports, manufacturing items are of prime importance and both countries lack resources for these commodities. For the import of the commodities India and South Africa have to depend on some other countries which have abundant supply of these resources. There is a need to build economic cooperation between India and South Africa which would benefit in pushing bilateral relations in positive direction.
5. Conclusions and Policy Suggestions
This article examined the identification of potential commodities between India and other BRCS economies. The analysis has been covered by taking into consideration the RCA and RID. The structure of Indo-BRCS trade relation present a changing environ as with each economy the basket of tradable commodities vary. Thus overall among BRCS, Russia tops the list followed by Brazil, then by China and finally South Africa. Hongna and Zengfeng (2011) in their study have also depicted that after 20 years of the 20th century and the first 10 years of the 21st century, foreign trade in BRIC countries - China, Brazil, Russia, India and South Africa - as the representative of the development of emerging economies have played a pivotal role and would become the new economies to an important channel for international economic cycle. By knowing the trade prospective, countries could engage in bilateral and multilateral processes to make efforts to minimize or at least mitigate the effect of existing restrictive measures to trade growth. For policy purposes, it is rational to define potential and prospective trade as the maximum possible trade that can occur between any two countries, which have liberalized trade restrictions the most, given the determinants of trade. Thus from the results it should be taken into consideration that the respective sectors should be given priority in order to reap the benefits. The results show that considerable potential exists on individual country basis. Apart from the existing level of trade, India also needs to focus on trade from emerging countries that are liberalizing their markets for economic growth, which could form important avenue for its exports. The study can also act as a base for identification of latent sectors for further enhancement in trade by following the specified methods and can be done in other country perspective as well.
References
| [1] | Balassa, B. (1965). Trade Liberalisation and ‘Revealed’ Comparative Advantage. The Manchester School, 99-123. |
| [2] | Biswas, A. (2016). Indian investors seeking markets and business prospects. In A. K. Biswas, India and Africa's Partnership: A Vision for a New Future (pp. 41-60). New Delhi: Springer (India) Pvt. Ltd. |
| [3] | Castro, T. D. (2012). Trade cooperation indicators: Development of BRIC bilateral trade flows. International Review of Business Research Papers, 211-223. |
| [4] | Gong, X., & Gu, C. (2011). A study on trade of complementarity among Xinjiang and its neighboring Countries. Asian Social Science , 1-5. |
| [5] | Havlik, P., Pindyuk, O., & Stollinger, R (2009). Trade in Goods and Services between the EU and the BRICs. Vienna: Vienna Institute for International Economic Studies. |
| [6] | Hongna, Y. & Zengfeng, Z. (2011). Comparative analysis on foreign trade of the BRICs. M & D Forum, pp. 166-172. |
| [7] | Liesner, H. H. (1958). The European common market and British industry. The Economic Journal, 302-316. |
| [8] | Naude, W., & Rossouw, R. (2008). Export diversification and specialization in South Africa: Extent and impact. Hamburg, Germany: United Nations University (UNU), World Institute for Development. |
| [9] | Seema. (2014). An analysis of India-Brazil trade over the last decade. Zenith International Journal of Business Economics & Management Research, 137-144. |
| [10] | Sharma, H. (2013). Indo-Brazil trade: Recent experience and future opportunities. Asian Resonance, 1-6. |
| [11] | Singh, A., Dhania, R., Upasani, R., & Mathur, S.K. (2011). Analyzing the Trade Flows for Brazil, Russia, India, China and South Africa (BRICS). [Online], accessed 15. 08. 2016. Available at: <https://www.scribd.com/doc/63710945/Analyzing-the-trade-flows-for-BRICS>. |
| [12] | Wani, N.U.H,. Mir, A. S., & Dhami, J.K. (2013). The experience and future potentialities of BRICS as a trading bloc. Asian Journal of Research in Buisness Economics and Management., 271-289. |
| [13] | Wani, N. U. H & Dhami, J.K. (2014). Economic concert, collaboration and prospective of trade between India and Brazil. Foreign Trade Review, 1-14. |
| [14] | Xiaobo, Z., Jin, Y., & Shenglin, W. (2011). China has Reached the Lewis Turning Point. China Economic Review, 542-554. |
| [15] | Yun, W.J. (2012). Competition or complementarity? An empirical study on economic relationship among "BRICS". International Buisness, 1-11. |

 Abstract
 Reference
 Full-Text PDF
 Full-text HTML