-
Paper Information
- Paper Submission
-
Journal Information
- About This Journal
- Editorial Board
- Current Issue
- Archive
- Author Guidelines
- Contact Us
American Journal of Economics
p-ISSN: 2166-4951 e-ISSN: 2166-496X
2017; 7(5): 201-210
doi:10.5923/j.economics.20170705.01

Exchange Rate Pass-Through Elasticity to Domestic Consumer Prices in Nigeria and Taylor’s Hypothesis: A Structural Vector Auto Regression Analysis
 Abstract
 Reference
 Full-Text PDF
 Full-text HTML
Abdullahi Ahmed Mohammed 1, Sagiru Mati 2, Mustapha Hussaini 3
1Department of Economics, Northwest University, Kano, Nigeria
2Department of Economics, Northwest University, Kano, Nigeria.
3School of Preliminary Studies, Sule Lamido University, Jigawa, Nigeria
Correspondence to: Abdullahi Ahmed Mohammed , Department of Economics, Northwest University, Kano, Nigeria.
| Email: |  |
Copyright © 2017 Scientific & Academic Publishing. All Rights Reserved.
This work is licensed under the Creative Commons Attribution International License (CC BY).
http://creativecommons.org/licenses/by/4.0/

This study examines the degree and extent of exchange rate pass through into domestic consumer price inflation in the Nigerian economy between 1986Q1 and 2013Q1 using structural vector auto regression (SVAR) methodology. The results from impulse response analysis show that the exchange rate pass through to consumer prices is incomplete, higher in the early decades of the sample and relatively low in the subsequent decades of the sample and below the average range. Yielding a dynamic exchange rate pass through elasticity coefficient of 0.33. Therefore, there seems to be positive relationship between ERPT and inflation for the Nigerian economy: As inflation declines (rises) overtime the ERPT becomes lower (higher). This vindicates a strong evidence that is consistent with Taylor’s (2000) proposition that high or average pass through is associated with high inflation and vice versa. Overall, the results offer supportive evidence in favour of the exchange rate channel, and monetary policy rate to be conceivable track for monetary policy transmission mechanism in the Nigerian economy.
Keywords: Exchange Rate Pass Through, Inflation, Taylor’s hypothesis, Structural VAR, Nigeria
Cite this paper: Abdullahi Ahmed Mohammed , Sagiru Mati , Mustapha Hussaini , Exchange Rate Pass-Through Elasticity to Domestic Consumer Prices in Nigeria and Taylor’s Hypothesis: A Structural Vector Auto Regression Analysis, American Journal of Economics, Vol. 7 No. 5, 2017, pp. 201-210. doi: 10.5923/j.economics.20170705.01.
Article Outline
1. Introduction
- Empirical literature divides the determinants of exchange rate pass through into two, micro and macro determinants (see for example Campa and Golberg, 2002)1. By micro factors, we simply mean the microeconomic state of the market structure and industry composition of a country’s import bundle. In perfectly competitive markets, firms absorb exchange rate shocks by not passing exchange rate changes into consumer prices in order to maintain a proportion of the market share in the market. Therefore, firms only adjust their mark up, this phenomenal behaviour is known as pricing to market (PTM)2. In contrast, by macro factors we simply denote that ERPT relates and remain influence by macroeconomic conditions endogenous to the economy. For example low inflation environment (see Taylor, 2000), monetary policy credibility, size and trade openness of the economy, difference in exchange rate regimes, exchange rate volatility, and the time horizon of the analysis, (i.e whether the economy is in the short or long run. Evidently pass through is almost complete in the long run). In order to test the Taylor hypothesis3 as a macro phenomenon, we therefore examine the inflation and exchange rate dynamic ın Nigeria. Figure one shows the relationship between the nominal exchange rate (USD: Naira) and inflation in Nigeria. An increase in the exchange rate means an appreciation, while a decrease indicates depreciation of the exchange rate, which is shown on the vertical axis from figure 1. Despite the numerous efforts by the government to stabilise the exchange rate, the value of naira depreciated throughout 1980’s. For instance, it depreciated from 1.75 to 7.4 between 1986 and 1989 with corresponding inflation rate of 5.7 to 50.4 respectively. Overall, the Nigerian naira has depreciated. More especially between 1986 and 1994 when the exchange rate depreciation was around 21.9 percent, which leads to record high inflation of 57 percent in the economy (see figure 1). For instance, the inflation rate averaged about 8 percent between 2006 and 2012, corresponding to the period with relatively stable exchange rate. The managed floating exchange rate regime or arrangement i.e. the Retail Dutch Auction System (RDAS) and Wholesale Dutch Auction System (WDAS) adopted in 2002 and 2006 respectively. This caused a slight appreciation of the exchange rate that makes inflation relatively lower compared to the past decades as indicated in figure 1 below.
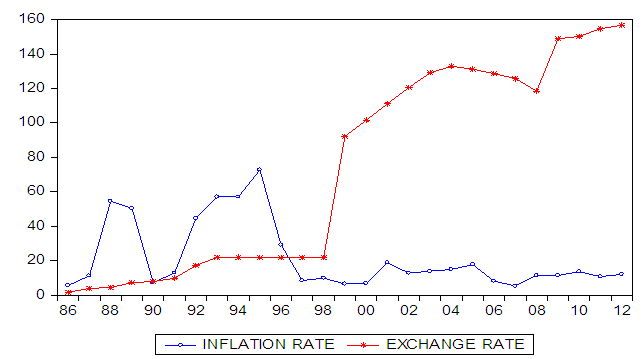 | Figure 1. Nominal Exchange Rate (Nigerian Naira per US Dollar) and Inflation Developments 1986-2012 |
2. Literature Survey
- Empirical literature on the exchange rate pass-through is wide ranging. Apparently robust stylized fact from this literature revealed that exchange rate pass-through (ERPT) is incomplete, although the degree pass through tend not to be the same across countries. ERPT is expected to be incomplete if the import, export and consumer prices variation is less than one. Whether the exchange rate pass through (ERPT) is incomplete or persistent, it is foreseeable that an appreciation of currency diminishes import prices, and the reverse arises in case of a depreciation (Hooper and Mann, 1989; Goldberg and Knetter, 1997; Menon, 1995; Anderton, 2003; Frankel et al. 2005; Krugman, 1987). Variations in import prices, then, in turn affect domestic consumer prices. A more contemporary body of literature (McCarthy, 2000; Mihailov, 2005; Choudhri and Hakura, 2006; Campa and Golberg, 2005; Cazorzi and et al. 2007; Akofio-Sowah, 2009; and Razafimahefa, 2012) with their cross-country investigation scrutinizes the impact of exchange rate on different prices. Overall, these studies have analysed the extent of exchange rate pass-through to consumer prices, which is crucial for several reasons, for example, knowledge of pass through ease the prediction of the real exchange rate volatility. It sheds light on the transmission mechanism of international macroeconomic shocks, and it assists in the coordination of international macroeconomic policy to enhance competitiveness. More so, the knowledge of the association between the nominal exchange rates and inflation in developing economies may give a good picture of the extent to which inflation contributes to economic distortions. Additionally, the extent of exchange rate pass-through is central in the determination of appropriate monetary policies, which enable the monetary authorities to device the right monetary policy response for exchange rate movements.Both theoretical and empirical literatures have concentrated mostly on advanced economies, mostly the USA, Japan, Canada, and Germany, to mention a few. However, developing economies such as Nigeria attracts few empirical researches. But there has been an increased interest to analyse exchange rate pass through (ERPT) in developing economies in the recent years (e.g. Ogun, 2000; Choudhri and Hakura, 2001; Bhundia, 2002; Mwase, 2006; Akofio- Sowah, 2009; Aliyu et al. 2009; Frimpong and Adams, 2010; Sanusi, 2010; Adedayo, 2012; and Razafimahefa, 2012). Specifically, for the Nigerian economy, Adedayo (2012) examined the channel for exchange rate pass through. Findings from this study revealed that interest rate channel is the significant path of exchange rate pass through in Nigeria. The study suggested that monetary authorities should at all-time guide the fluctuations of the exchange rate and its effects on the macroeconomic prices in Nigeria. Another study conducted on the Nigerian economy is Aliyu et al. (2009). This study conducted an extensive empirical investigation from the first quarter of 1986 to the fourth quarter of 2007 on exchange rate pass through for the Nigerian economy. The study employed vector error correction model (VECM) and their findings suggested that exchange rate pass through in Nigeria is low, even though it is to some extent high in import than in the consumer prices. According to these researchers exchange rate pass through in Nigeria has declined along the price chain, which partly overturns the conventional wisdom in the literature that ERPT is always considerably high in the developing and emerging economies than in the developed economies. Most of the empirical findings on ERPT related to the Nigerian economy have focused mainly on examining the degree of exchange rate pass through that is whether it is low or high, complete or incomplete. However, justifications in favour or disfavour of low pass through is yet uncovered according to the conventional determinant of exchange rate pass through as whether it is a micro or macro phenomenon. One side of the motivation of this study is to establish a standpoint that would highlight the degree of exchange rate pass through (ERPT) as a function of micro or macro determinant.
3. Econometric Methodology
- The SVAR methodology makes use of economic theory to trace the contemporaneous association between the variables of interest (Sims, 1986; Bernanke, 1986; McCarthy, 2000; Ito and Sato, 2007; Bache, 2007). The model requires an “identification assumption” to allow contemporaneous correlations to be causally identified. For example, exchange rate and the inflation rate are expected to influence each order in most if not all theoretical models. In order to determine the role of exchange rate fluctuations in causing movements on domestic consumer prices it is most appropriate to estimate a system that will treat them as endogenous. Similarly, monetary policy affects exchange rate and inflation simultaneously. For instance in the floating exchange rate regime, the exchange rate is an endogenous variable that responds to economic policies (Ito and Sato, 2007). Fluctuations in the exchange rate have large effects on macroeconomic variables SVAR therefore, is a useful approach that permits such interactions among the exchange rate and other macroeconomic variables.The SVAR analysis of the exchange rate pass-through has advantages over a single equation analysis. First, SVAR approach allows us to identify structural shocks through a structural decomposition of innovations. Moreover, empirical investigation ensued to examine the effects of structural shocks to other macroeconomic variables on domestic inflation under a SVAR framework. Previous studies typically analyse the exchange rate pass-through into a single price index by using a single-equation-based approach. In contrast, SVAR approach allows us to investigate dynamically the exchange rate pass-through elasticity into domestic consumer prices.The SVAR model is represented as follows6
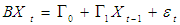 | (1) |
 are (nxn) and
  is an (nx1) matrices. To normalize the vector appearing on the LHS of this equation, we need to multiply the equation by the inverse of the matrix B. The multiplication by B inverse allows us to obtain VAR in standard form (unstructured VAR)7 as follows:
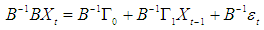 | (2) |
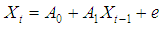 | (3) |
 = [Δy Δm2 Δmpr Δneer Δcpı] is a 5×1 row vector of the endogenous variables observed at time t, where Δy is log nominal output, Δm2 denotes the log of a monetary aggregate such as m2, and Δmpr gives the monetary policy rate, Δneer represents the log of nominal effective exchange rate, Δcpı is the log Consumer price index.Hence equation (2) and (3) are equal
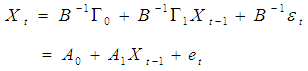 | (4) |
 ,
,  ,
,  . Therefore, the vector
  of the reduced form errors is related to the vector
  of innovations by the following system of structural8 equations:
  | (5) |
 We obtain here a 5×1 row vector of error terms, they are assumed to be serially independent moreover, the structural shock (εt) i.e. the innovations are also assumed to be independently and normally distributed with mean zero and variance-covariance matrix i.e.
  . The
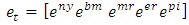
. The  innovation could be called “shocks” and they are economically identifiable (i.e., can be output shocks, money supply shocks, monetary policy rate shocks, exchange rate shocks, and consumer price inflation shocks). Therefore, the structural shocks vector is represented by:
 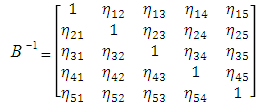 Where:
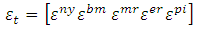 For
For 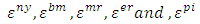 represent the output, broad money, monetary policy rate, and nominal exchange rate and consumer price index shocks respectively. Once we identify and impose restrictions on
  matrix in a recursive order.
  is transform to a triangular matrix form thus:
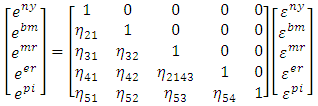 As such
  is assumed to have zero mean, constant variances, and are serially uncorrelated, but because of the matrix
  there has to be contemporaneous correlation between innovations. SVAR model is useful in identifying shocks and trace them out by employing impulse response analysis and forecast error variance decomposition (FEVD) by imposing restrictions on the matrices A and/or B. SVAR model is a structural model, it departs from a reduced form standard VAR model and only restrictions for A and B can be added. It should be noted that the reduced form residuals can be retrieved from a SVAR model by
  and its variance-covariance matrix is thus;
 Since
Since  is symmetric, it is important to note that without some restrictions, the parameters in the SVAR are not identified. We assume that the model contains n variables (excluding the constant term). For identification purposes, at least n2 independent restrictions on parameters of the structural form are needed to exactly identify the system. Structural shocks are supposed to be mutually uncorrelated; therefore the variance-covariance matrix of the structural shocks is required to be diagonal. Without loss of generality, assuming all structural shocks are mutually independent, the standard deviations of the structural shocks are normalized to one. That is, the variance-covariance matrix of the structural shocks is set to the identity matrix, which yields n(n +1)/2 restrictions. Consequently, it is clear that we need n2_n(n+1)/2=n(n−1)/2 restrictions are needed9. These restrictions can now be impose either on the contemporaneous or on the short run properties of the system.
 4. Estimation Results
4.1. Data and Structural VAR (SVAR) Estimation Results
- In this section, we commence by briefly presenting our data. The macroeconomic data set used in this study is taken from the IMF's International Financial Statistics (IFS) database, and Central Bank of Nigeria (CBN) statistical bulletin and Report. We have used quarterly observations extending from 1986Q1 to 2013Q1. The sample period we choose is more appropriate because of the structural changes and we exclude the period of rigidly fixed exchange rate regime. Hence, beginning of the period corresponds to the inception Structural Adjustment Program (SAP, 1986). The end period of the sample includes the period when inflation targeting was formally adopted, i.e., between 2007 and 2009. Our data set include Output (Y) which stands for GDP taken in real terms, and the CPI is expressed on the base (2005=100), the CPI measures the average change overtime in the prices paid by consumers for a market basket of consumer goods and services, the monetary policy rate (MPR) reflects the official interest rate set as a benchmark interest rate by the Monetary Policy Committee (MPC) of Central Bank of Nigeria (CBN). Nominal effective exchange rate (NEER) is measured in nominal terms which reflect the value of Naira in terms of US dollar ($/₦). A decrease in the NEER variable is termed nominal depreciation of the currency and vice versa. The M2 represent the broad money, which is a narrow monetary aggregate M1 plus quasi money. In the next step, we have performed unit root test to examine the time series properties of the data.10We start by investigating the time series properties of the data as an initial step to the VAR analysis. We proceed with Preliminary analysis of the data for their orders of integration before conducting the cointegration analysis. With the exception of the NEER, all of the three tests indicate that all the series are integrated of order, I(1). Thus, the series are non-stationary in levels but stationary in first differences. For the NEER, while the PP test results suggest that the variable is stationary in levels, the ADF and KPSS test results suggest otherwise.11The cointegration tests show no evidence of cointegrating vectors in the macro system. Thus, for the rest of the analysis the VAR model is carried out in first differences and no error-correction terms are included. According to VAR literature, when there are cointegrating relationships among the variables, that is, when data are I(1) and cointegrated, one can estimate a VAR/SVAR model in levels. However, if the variables involved are not found to be cointegrated, the VAR/SVAR is specified in first differences. Therefore, we are able specify our VAR model in first difference.Since all the variables are stationary in the model, we estimated a reduced form vector auto regression (VAR) model using econometric procedure. The order of the VAR ıis inıtially determined by information criteria. The lag length was selected using the Likelihood Ratio (LR) criterion, the Akaike Information Criterion (AIC), and the Final Prediction Error (FPE) criteiron. Since all of these criteria suggested 4 as the order of the unrestricted VAR model in first difference, a lag length of 4 was used in the study.The VAR also fulfills the stability condition, indicating that all roots of the characteristic polynomial lie within the unit circle, and hence pointing to stationarity. Diagnostic tests are conducted to further assess the nature of the residual errors. The Lagrange multiplier (LM) or the Breusch-Godfrey test could not reject the hypothesis of no serial autocorrelation at lags between 1 and 12 with a high p-value greater 5. While Jarque-Bera normality test rejects the null hypothesis of normality due to excess kurtosis in the residuals. A visual inspection indicates that the residuals display a number of outliers (see Figure A2 in the Appendix). It is of relevance to note that when the normality assumption is rejected, Monte Carlo tests for serial autocorrelation should still be very accurate, though not exact (see Lutkepohl, 1991 and Mackinnon, 2005).The likelihood ratio test (LR-test) is computed for the SVAR model. That is whether the covariance matrix of the residual for SVAR model is diagonal. They were found to be non-zero. The relevance of this test is, if the covariance of the matrix residuals are zero there is no point using contemporaneous restrictions to identify the SVAR system (see Sanusi, 2010). The LR statistic is found to be greater than the critical value, so we reject the null hypothesis that the restrictions are not valid. Therefore, we can accept the imposed identification restrictions within matrix
 . Similarly, this suggests that shocks in the entire equations have contemporaneous correlation in the system12 and thus, the unrestricted VAR model would have neglected the contemporaneous correlation among the variables.13
4.2. Impulse Response (IR) Analysis ERPT Elasticity
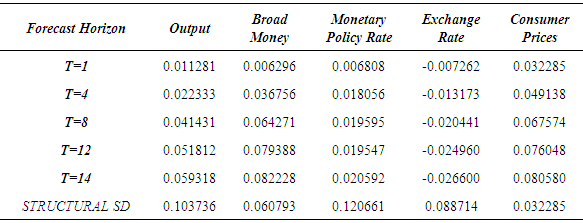
- The exchange rate pass through to domestic prices is calculated from the impulse response function results. The pass through can be define as the accumulated effect of a structural one standard deviation to the nominal effective exchange rate in period t on domestic consumer prices in period t. Note that the accumulated response measures the effects of exchange rate changes on the domestic consumer prices. The dynamic pass through elasticity (φ) at time t is given by:
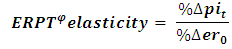 The numerator is the percentage change in the level of the consumer prices inflation between period zero, when the initial exchange rate shock strikes, and at time t. The denominator is the percentage change in the nominal effective exchange rate at time 0.
|
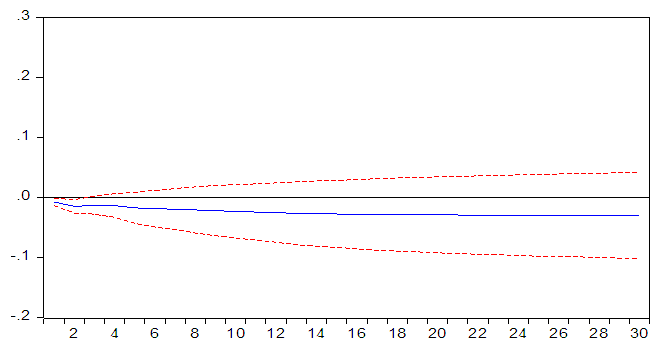 | Figure 2a. Response of CPI to Exchange Rate and Exchange Rate |
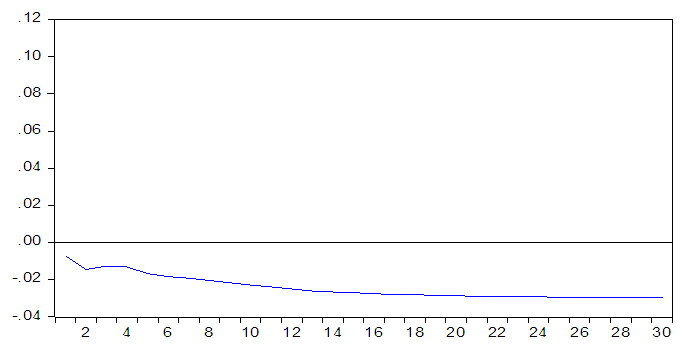 | Figure 2b. Dynamic Exchange Rate Pass through Elasticity |
5. Conclusions
- This study examines the degree and extent of exchange rate pass through into consumer price inflation in the Nigerian economy between 1986Q1 and 2013Q1 using SVAR methodology. This methodology potentially allows one to identify specific “structural” shocks affecting the system, which pave way for specifying the embedded features of an economy. The estimations are carried out using a fully-fledged system of five variables that include output, money supply, monetary policy rate, nominal exchange rate and consumer price index. The results from impulse response analysis shows that the exchange rate pass through to consumer prices is incomplete, higher in the early decades of the sample and relatively low in the subsequent decades of the sample and below the average range. Yielding a dynamic exchange rate pass through elasticity coefficient of 0.33. Therefore, there seems to be positive relationship between ERPT and inflation for the Nigerian economy: As inflation declines (rises) overtime the ERPT becomes lower (higher). This vindicates a strong evidence that is consistent with Taylor’s (2000) proposition that high or average pass through is associated with high inflation and vice versa. Overall, the results offer supportive evidence in favour of the exchange rate channel, and monetary policy rate to be conceivable track for monetary policy transmission mechanism in the Nigerian economy. The positive money supply and output shocks indicate positive consumer price inflation over time, signalling an inflationary environment. This also vindicates a strong evidence that is consistent with Taylor’s (2000) proposition that high or average pass through is associated with high inflation and vice versa.
Appendix A
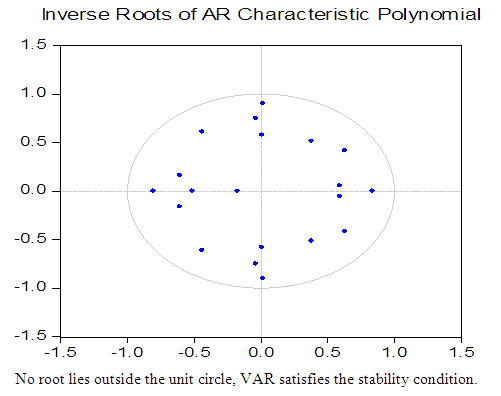 | Figure A1. VAR Stability Condition |
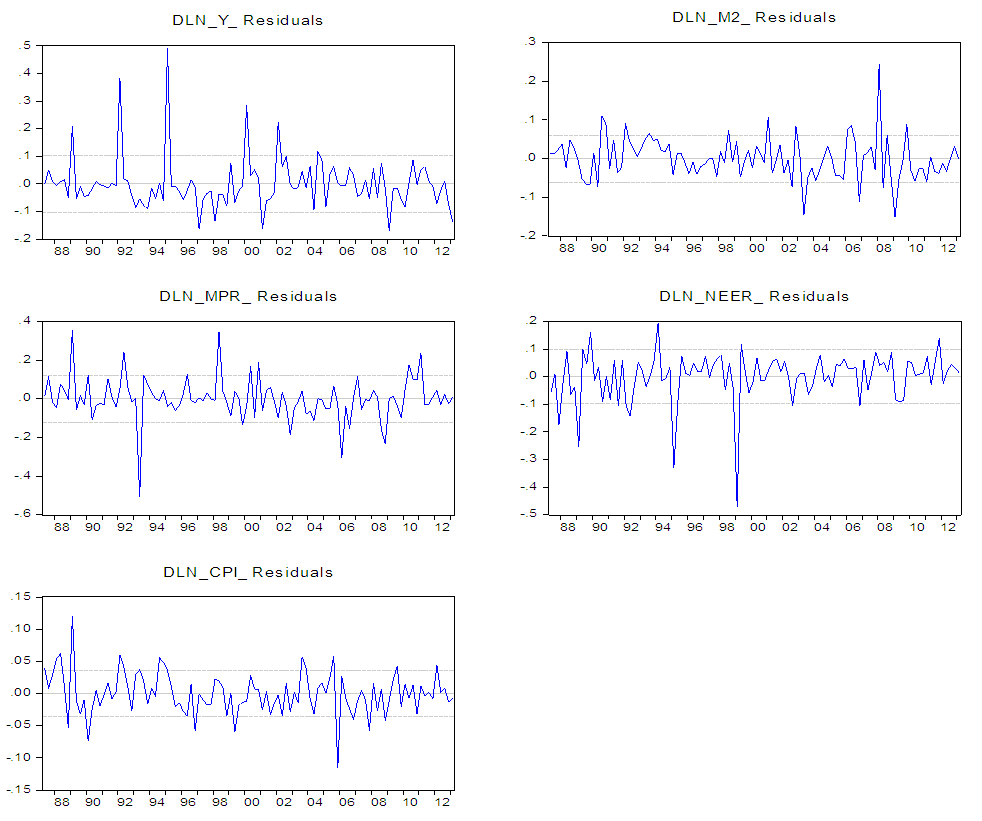 | Figure A2. Residual Graphs |
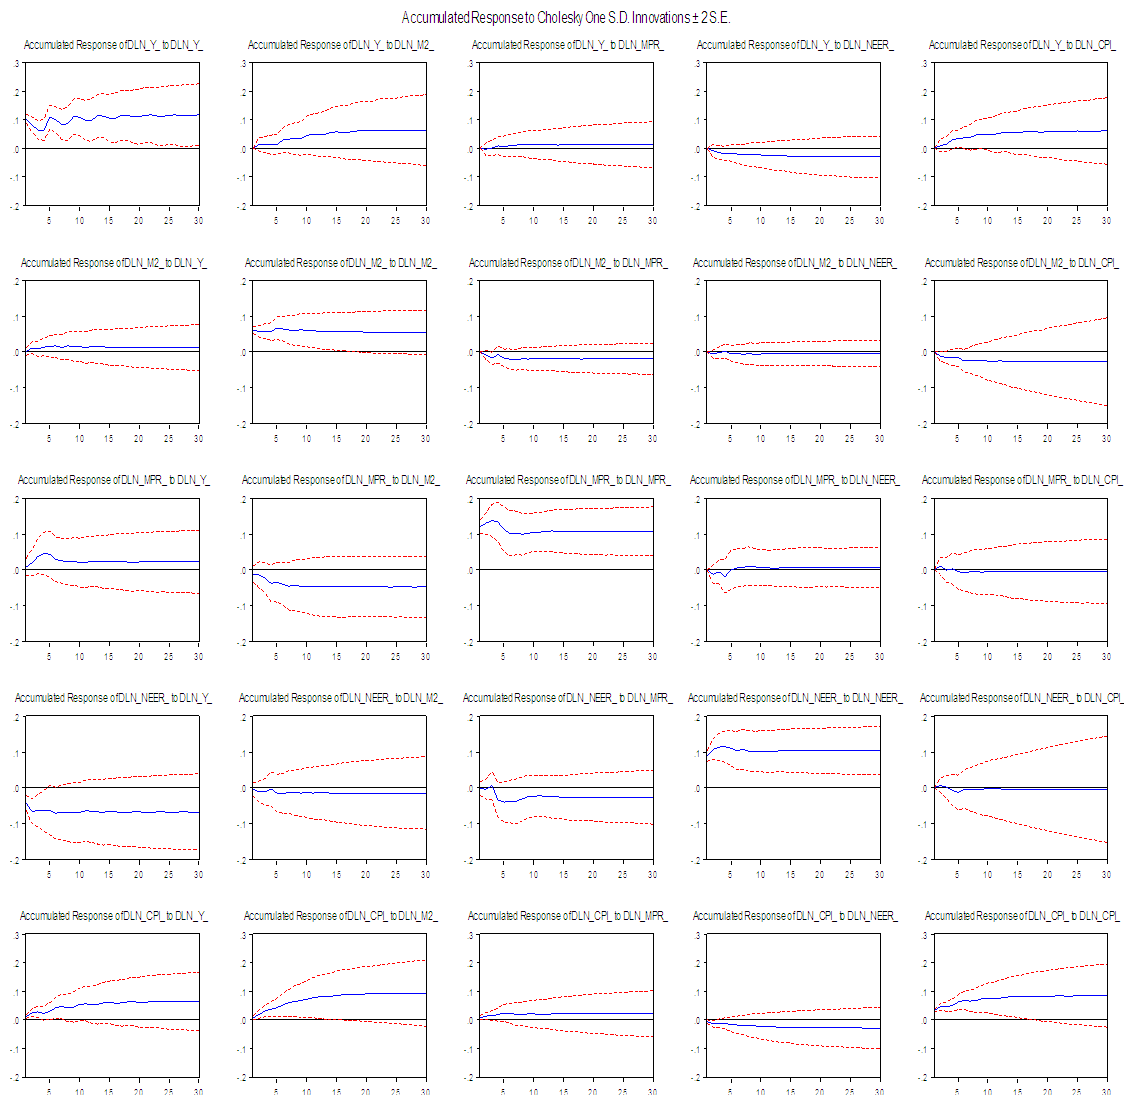 | Figure A3. Impulse Response Graphs |
Notes
- * The author is grateful to Professor Mehmet Yazici and Asst Prof Aysegul Eruygur of the Department Of Economics, Cankaya University, Turkey for their valuable comments and suggestions. 1. Campa and Goldberg (2002) introduced this distinction.2. PTM is the ability of monopolistically competitive firms practice price discrimination, setting different prices for different destination markets in to intentional market.3. More commonly, the paper finds broad validation for a positive relationship between the degree of the exchange rate pass through (ERPT) and inflation, in line with Taylor’s hypothesis, both in advance, markets and developing economies. The hypothesis states that a low inflationary environment leads to a low exchange rate pass through to domestic prices and vice versa.4. To the author’s knowledge, a Structural VAR estimation method has not been applied to this issue, to study the Nigerian economy nor test Taylor’s hypothesis (2000).5. More commonly, this paper finds broad validation for a positive relationship between the degree of the exchange rate pass through (ERPT) and inflation, in line with Taylor’s hypothesis, as found both in advance markets and developing economies.6. See Enders, (2004).7. For a further detail review and discussion on the methodology, advantages and disadvantages of alternative unstructured VAR and structural VAR (see Stock and Watson, 2001).8. For a review of the SVAR methodology (see Bache, 2007) on econometrics of exchange rate pass through.9. Necessary condition for exact identification.10. All variables are were put into their natural logarithm before the analysis. 11. The Lag length of the ADF regression was selected according to the schwartz Bayesian Information Criterion (SBC). In practice, the SBC will select a more parsimonious model than will either AIC or t-test (Enders, 2004; 193). Once a tentative lag length has been determined diagnostic checking should be conducted. Plotting the residuals is a most important diagnostic tool. There should be always being absence of evidence of structural change and serial autocorrelation. Therefore, the correlogram of the residual should be examined and should appear to be a white noise process (Enders, 2004; 192). In line with this reasoning, we examine the correlogram of the levels and first differences of all the series. It indicates that the residuals are white noise process. 12. Hence this gives justification for structural VAR to take into consideration the contemporaneous correlation among the variables.13. The rest of the impulse response plot of the entire system is shown in Figure A3 in the Appendix.14. (See Razafimahefa, 2012) who found high exchange rate pass through elasticity for some Sub-Saharan African countries. For example 0.887 for Ethiopia, 0.865 for Mali, 0.797 for Guınea Bissau, 0.607 for Angola, 0.554 for Cameroun, and 0.536 for Gabon.15. Similarly, other comparable results for central and East European countries by (Beirne and Bijsterbosch, 2009). There study found pass through elasticity of 0.698 for Bulgaria, 0.505 for Czech Republic, 0.925 for Estonia, 0.370 for Slovakia 0.436 for Romania, 0.969 for Latvia, 0.634 and 0.469 Hungary and Poland respectively. Therefore, the result for exchange rate pass through elasticity found for the Nigerian economy is broadly in line with some of studies, for countries that have not achieve low overtime.