Abdullah Hussein Al-Hashedi1, Sanad Ahmed Abkar2
1Department of Information Technology, University of Science and Technology, Sana'a, Yemen
2Department of Business Administration, Open University Malaysia, Malaysia
Correspondence to: Abdullah Hussein Al-Hashedi, Department of Information Technology, University of Science and Technology, Sana'a, Yemen.
| Email: |  |
Copyright © 2017 Scientific & Academic Publishing. All Rights Reserved.
This work is licensed under the Creative Commons Attribution International License (CC BY).
http://creativecommons.org/licenses/by/4.0/

Abstract
Customer satisfaction becomes the most important factor for business success in most industries. The telecom mobile companies in Yemen face a problem of decreasing customers’ satisfaction with their services. Service quality can provide a good measurement tool to predict customer satisfaction. However, there is scarcity in studies related to this field in Yemen that can help telecom mobile companies to understand and measure the satisfaction level of customers toward services that provide. Thus, this study aims to analyse the impact of perceived service quality on customer satisfaction in Yemeni telecom mobile companies through finding a valid and reliable instrument to measure customer perceived service from functional quality and technical quality perspectives. SERVPERF model is utilized to measure service quality from functional aspects. Network quality dimension is newly added to measure service quality from technical aspects. Six independent variables (tangibles, reliability, responsiveness, assurance, empathy and network quality) are proposed to help predict the customer satisfaction. The proposed model is empirically tested using appropriate sampling size. Data collected from 356 respondents through an online and on-field survey. Using hierarchical regression, result shows that four dimensions of service quality (network quality, empathy, reliability and assurance) are revealed significantly positive impact on customer satisfaction while tangibles and responsiveness have no impact on customer satisfaction. The network quality has the highest impact on customer satisfaction and Yemeni telecom mobile companies must consider about superior network quality as perceived service quality from customers to judge the quality of services in telecom mobile network.
Keywords:
Service Quality, Customer Satisfaction, Telecommunication, Yemen
Cite this paper: Abdullah Hussein Al-Hashedi, Sanad Ahmed Abkar, The Impact of Service Quality Dimensions on Customer Satisfaction in Telecom Mobile Companies in Yemen, American Journal of Economics, Vol. 7 No. 4, 2017, pp. 186-193. doi: 10.5923/j.economics.20170704.04.
1. Introduction
In the competitive market, customers have many available options to select among a telecom mobile companies. Therefore, the companies should look for factors to attract and retain their customers. Customer satisfaction is considered one of the most important concepts to keep the telecom mobile companies survive on the market. As mobile telecommunication network has developed over several successful generations, technology plays an important role in this context. Technology enhances service quality particularly in making a video call. Hence, these companies can use service quality as a measure to appraise their customers’ satisfaction continuously. This can help companies to formulate appropriate strategies for customer satisfaction [1, 2]. Yemen telecommunication sector consists of three private operators companies (Sabafon, MTN, and Y-Telecom) and one public operator company (Yemen Mobile). Sabafon and MTN established in Feb-2001, Yemen Mobile established in Sep-2004 and Y-telecom established in 2007. Based on Yemen National Information (NIC) reports, the number of subscribers who are using mobile in Yemen reached to 17,423,000 with mobile penetration 69.04% in the end of 2013. Thus, the usage of mobile phone technologies became widespread by society, and it is very clearly seen across all walks of life in Yemen.
2. Literature Review and Related Work
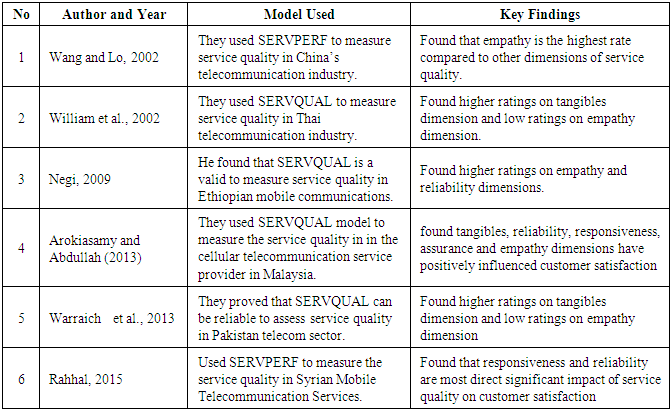
Researchers believe that the service quality theory have relation with customer satisfaction and product quality [3]. There are many service quality models and different dimensions based on various service sectors [4]. But in this study, it focused on most popular models: SERVQUAL and SERVPERF. Table 1 provides a summary of most popular models (SERVQUAL or SERVPERF) used by researchers to measure service quality in telecommunication industry.Table 1. Models for Service Quality in Telecommunication industry
 |
| |
|
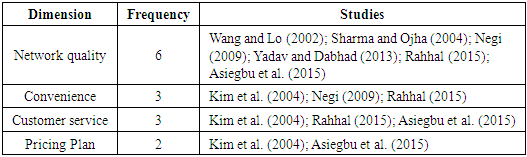
Nevertheless SERVQUAL [5] has many criticisms because it is based on the difference between the expectations and performance. So many authors [6-10] asked for its reliability and validity. On the basis of that, they found the SERVPERF scale to outperform the SERVQUAL scale in terms of both reliability and validity. Hence, this study used dimensions of SERVPERF model (Tangibles, Reliability, Responsiveness, Assurance and Empathy) as functional dimensions of service quality to measure their impact on customer satisfaction in Yemeni mobile telecom companies.On the other hand, some authors added other dimensions of service quality beside of SERVQUAL/SERVPERF dimensions which can effect on customer satisfaction. Table 2 summarizes most additional dimensions which were used to measure service quality as well in mobile telecommunication industry.Table 2. Dimensions of Service Quality in Telecommunication Industry
 |
| |
|
Accordingly, this study was conducted most frequently used dimension which is network quality as technical dimension for service quality to measure its impact on customer satisfaction.
3. Research Model and Hypotheses
The tangibles, reliability, responsiveness, assurance and empathy associated with service quality are antecedents to perceived service quality [11]. Subsequently, the service quality dimensions could be antecedent to customer satisfaction [8, 12] and proved by several researchers [13]. Based on the key findings in Table 1, this study adapted same idea and the following hypotheses raised based on SERVPERF model:H1: Tangibles of perceived service quality will have a positive significant on customer satisfaction.H2: Reliability of perceived service quality will have a positive significant with Customer Satisfaction.H3: Responsiveness of perceived service quality will have a positive significant with Customer Satisfaction.H4: Assurance of perceived service quality will have a positive significant with Customer Satisfaction.H5: Empathy of perceived service quality will have a positive significant with Customer Satisfaction.On the other hand, several researchers found that network quality was most important factor of service quality especially in telecommunication industry that can effect on customer satisfaction. According to [11, 13, 14], they found that network quality was one of the most drivers to contribute overall service quality in telecommunication industry. Similarity, [15] found that network-based service performance was one of distinct constituents to measure service performance in mobile communication industry. Again, [16] found broad network coverage as utmost priority of customers. Also [17] found network coverage and availability of service significantly affected the quality of service of cellular mobile network operators in Nigeria. Therefore, this study conducted the following hypothesis as well:H6: Network quality of perceived service quality will have a positive significant on customer satisfaction.A framework of this study was formulated accordingly as shown in Figure 1. In the framework, the customer satisfaction is a dependent variable and service quality dimensions is an independent variable.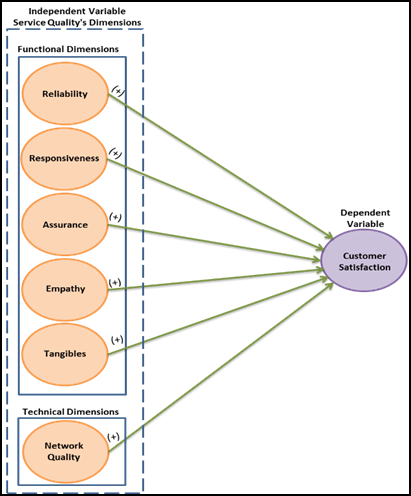 | Figure 1. Study’s Conceptual framework |
4. Research Design and Methodology
This study focused on the variable service quality and its characteristics that effect on customer satisfaction, so a descriptive study was conducted. The scope of this study was specifically limited into telecommunication industry only. Based on similar studies [11, 14] this study hypothesized with six hypotheses which are proposed to represent the effect of service quality dimensions on customer satisfaction from functional and technical perspectives.
4.1. Population and Sampling
The target population for this study was customers of MTN, Sabafon and Yemen Mobile residents in Sana’a city only. The Sana’a city is a capital of Yemen and it is considered a biggest city and it has large population estimated by 3,931,750 subscribers according to NIC (1,444,250 subscribers from MTN; 1,355,250 subscribers from Sabafon; and 1,132,250 subscribers from Yemen Mobile). This study was conducted to use simple random sampling because all customers of mobile telecommunication are considered and each one has an equal chance of being chosen [18]. Based on [19], the sample size was 384. Therefore, the sampling should be 37% from MTN, 34% from Sabafon and 29% from Yemen mobile in order to be compatible with statistics of subscribers exist in Sana’a city.
4.2. Data Collection Method
This study used a questionnaire instrument to collect data from respondents which was adapted from [5, 13, 14] to fit in the context of the Yemeni settings. The questionnaire consisted of 32 items where 27 items was for service quality and 5 items was for customer satisfaction. The questionnaire was translated by an expert of the language from English into Arabic to ensure the Arabic expressions were correctly written.This questionnaires distributed through two ways: online survey and field survey. An online survey was collected from 153 respondents through 34 days. So that, 14 questionnaires uncompleted were rejected while 139 questionnaires were valid and entered in SPSS for further analysis.On the other hand, a field survey was conducted and distributed in several service points of (MTN, Sabafon and Yemen Mobile) and Sana’a University. The distribution was for 250 questionnaires and 236 were collected back through totally 30 days. From collected questionnaires, 19 questionnaires were rejected and 217 questionnaires were valid and entered into SPSS. Therefore, the total valid questionnaires were 356 which used in this study for analysing.
5. Data Analysis and Results
5.1. Demographic Profiles of Respondents
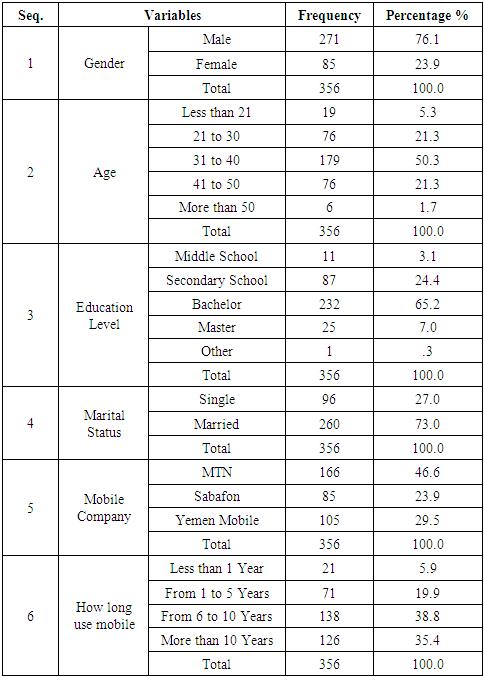
The demographic profiles of 356 respondents is as shown below in Table 3.Table 3. Demographics Profiles of Respondents
 |
| |
|
5.2. Factor Analysis
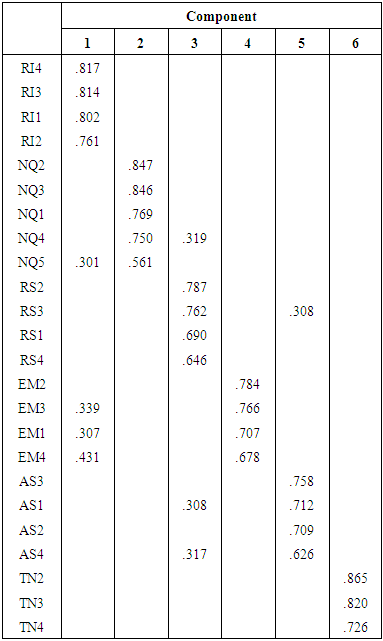
This study used principle components analysis (PCA) method in the exploratory factory analysis to identify (extract) the number of underlying factors or dimensions. Also the study used Varimax method in the exploratory factory analysis for rotation method which attempted to minimize the number of variables that have high loadings on each factor.Therefore, the exploratory factor analysis was applied on 27 items of the dimensions of independent variable (Tangibles, Reliability, Responsiveness, Assurance, Empathy and Network Quality). Six factors were extracted which represented 6 dimensions which explained 70.372% from total variance. All items were loaded into intended factors with loading greater than 0.5 except three items RI5, EM5 and TN1. Finally, the number of items became 24 items instead of 27 items by excluding items RI5, EM5 and TN1. Then, by applying exploratory factor analysis again on 24 items only, the rotated component matrix became as shown in Table 4.Table 4. Rotated Component Matrix
 |
| |
|
5.3. Descriptive Analysis
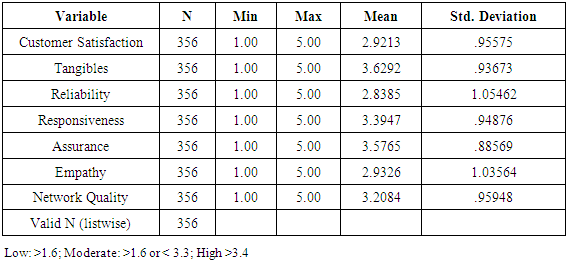
As shown in Table 5, all variables had 1 for the minimum value, 5 for the maximum value and all mean values of variables were in moderate value except tangibles and assurance which they were in high value. This means that, customers satisfied with tangibles and assurance of service quality and not satisfied enough with reliability, empathy, responsiveness and network quality of service quality.Table 5. Descriptive Statistics
 |
| |
|
Furthermore, the value of dependent variable (customer satisfaction) was in moderate which means that customer satisfaction may have more clearly relation with these four dimensions of service quality (reliability, empathy, responsiveness and network quality) rather than two dimensions of service quality (tangibles and Assurance).
5.4. Correlation Analysis
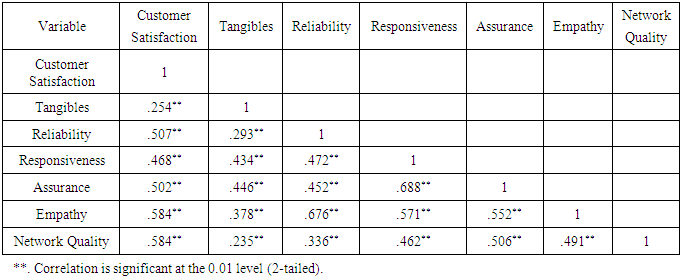
Pearson correlation analysis was used to describe the strength and direct relation of the linear relationship between two variables. There are two issues in correlation analysis to take them in consideration which are the sign and the absolute value. Based on the correlation analysis in Table 6, there are positive correlation between dependent variable and independent variables with highest correlation with Empathy and Network Quality. On the other hand, there are positive correlation among all dimensions of independent variable whereas the lowest correlation is always with Network Quality. However, more statistics analysis is needed to more understanding.Table 6. Correlations
 |
| |
|
5.5. ANOVA
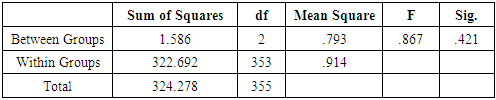
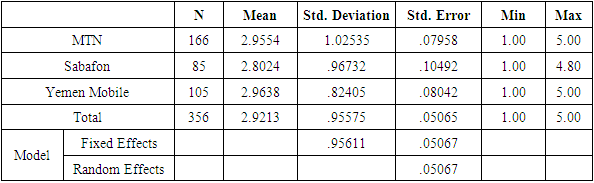
Based on Table 7, the significant was 0.421 which represented that there was no variance between customer satisfactions among mobile companies.Table 7. ANOVA Test of Mobile Company
 |
| |
|
Table 8 represents the mean value of customer satisfaction for each mobile company (MTN, Sabafon and Yemen Mobile). Therefore the variance is very small and all means are in moderate values which means that the customers are not satisfied with service provided by these companies. So further statistical analysis is needed to more understanding about obstacles to increase satisfaction level of customers.Table 8. Descriptive of Customer Satisfaction
 |
| |
|
5.6. Regression Analysis & Hypotheses Testing
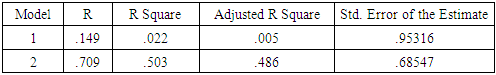
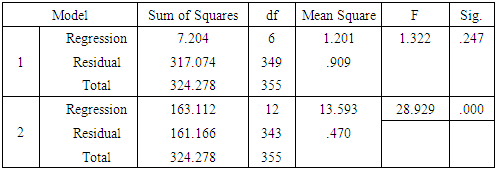
Linear multiple regressions analysis was conducted to determine which dimensions of independent variable (service quality) explained the variability in dependent variable (customer satisfaction) [2]. As shown in Tables 9 and 10, the regression analysis was conducted in model one on the control variables for Gender, Age, Education Level, Marital Status, Mobile Company and How long use mobile. The model one was not significant with R-square = 0.022, R = 0.149 and F value = 1.322. Hence, it was represented only 2% of variability in the dependent variable without statistical significant. In model two, the regression analysis was conducted on all control variables and all independent variables together to measure whether they can predict the dependent variable. This model significantly improved with R-square = 0.503, R = 0.709 and F value = 28.929 as shown in tables 9 and 10. Hence, it was represented only 50% of variability in the dependent variable with statistical significant.Table 9. Model Summary
 |
| |
|
Table 10. ANOVA
 |
| |
|
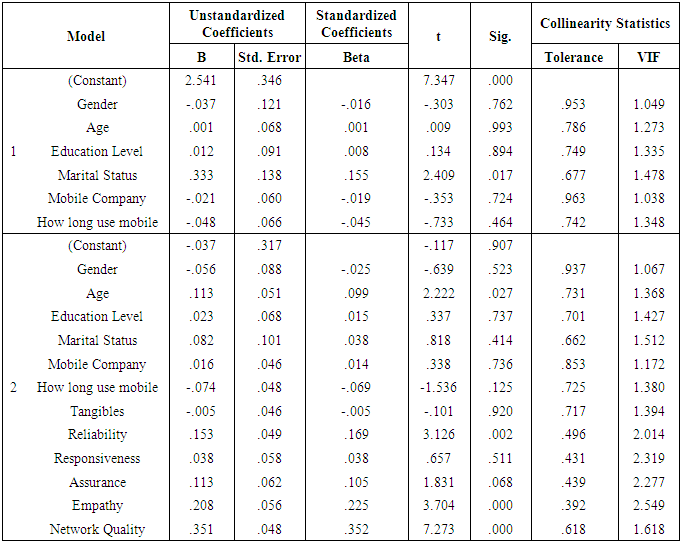
As shown in Table 11, only one control variable for Age was significant with β=0.099, P < 0.05. Generally, testing the significance of control variable is not as interesting as regulating the control variables to test the relationship between independent variables and the dependent variable. The following four continuous variables out of the six independent variables significantly contribute to the dependent variable: Reliability (β=0.169, P<0.05), Empathy (β=0.225, P<0.05), Network Quality (β=0.352, P<0.05) and Assurance (β=0.105, P< 0.10). The result of second model showed that H2, H4, H5 and H6 are supported while H1 and H3 are not supported.Table 11. Coefficients
 |
| |
|
6. Conclusions
This study aims to investigate the impact of perceived service quality on satisfaction level of mobile users in Yemeni telecom mobile companies from functional and technical perspectives. Hence, this study used six dimensions for service quality whereas five dimensions from SERVPERF scale were used to measure service quality from the functional perspective, and network quality was added as a new dimension to measure service quality from the technical perspective. This study distributed questionnaires by on-line and field survey. The data were collected from 356 valid respondents. Furthermore, the study highlighted the contribution of each service quality dimension in forecasting overall customer satisfaction. Network quality scored the highest (standardized β = 0.352, P<0.01), followed by three dimensions Empathy (standardized β = 0.225, P<0.01) Reliability (standardized β = 0.169, P < 0.05), and Assurance (β = 0.105, P< 0.10). So that, this study found SERVPERF model is still valid and applicable to measure perceived service quality of mobile telecom companies in Yemen.Findings of this study provide helpful guidelines for telecom mobile companies in understanding key drivers of customer satisfaction. Accordingly, network quality was highest significant, which means that customers cared about technical quality of perceived service more than any other functional factors.
6.1. Managerial Implications
This study highlighted the importance of service quality dimensions and their impacts on customer satisfaction. The following implications may be drawn into the management of telecom mobile companies in Yemen: 1. Customers perceived network quality of service quality as the first important factor in predicting overall customer satisfaction. Accordingly, the telecom mobile companies should put by a large amount of investments in network upgrade and expansion in order to improve network coverage and voice quality, reduce call drop and network congestion in social occasions, and increase data speed rate. 2. Customers perceived empathy, reliability and assurance of service quality as the second, third and fourth important factors respectively in predicting overall customer satisfaction. Accordingly, the telecom mobile companies should consider the service quality from functional perspective. The mobile companies should provide loyalty programs as message for their customers. Moreover, they should try to reduce service outage by doing enough tests before launch new services as well as to do more analyzing for running services to address major potential problems before happens. Furthermore, they should focus on emotional satisfaction to their customers which expressed by their employees’ behavior through conventional greetings, smiling, eye contact, voice and intonation. 3. Responsiveness should not be neglected for telecom mobile companies by having programs contain a document about frequently asked questions in order to respond to customers’ inquiries quickly and accurately as well.
References
| [1] | Lim, H.; Widdows, R.; Park, J. (2006). "M-loyalty: winning strategies for mobile carriers." Journal of Consumer Marketing 23(4): 208-218. |
| [2] | Hashed Ahmed Nasser. M, Salniza Bt Md. Salleh and Hamid mahmood Gelaidan (2012). “Factors Affecting Customer Satisfaction of Mobile Services in Yemen”. American Journal of Economics 2012, 2(7): 171-184. |
| [3] | Brady, M. K., & Cronin, J. J. (2001). Some new thoughts on conceptualizing perceived service quality: A hierarchical approach. Journal of Marketing, 65(3), 34-49. |
| [4] | Pollack, B. L. (2009). Linking the hierarchical service quality model to customer satisfaction and loyalty. Journal of Services Marketing, 23(1), 42-50. |
| [5] | Parasuraman, A., Zeithaml, V.A. and Berry, L.L. (1988). “SERVQUAL: a multiple item scale for measuring customer perceptions of service quality”, Journal of Retailing, Vol. 64, pp. 12-40. |
| [6] | Carman, J. M. (1990), “Consumer Perceptions of Service: An Assessment of SERVQUAL Dimensions,” Journal of Retailing, 66 (Spring), pp. 33-55. |
| [7] | Babakus, E. and G. W. Boller (1992), “An Empirical Assessment of the SERVQUAL Scale,” Journal of Business Research, 24, pp. 253-268. |
| [8] | Cronin, J.J. Jr and Taylor, S.A. (1992), “Measuring service quality: a reexamination and extension”, Journal of Marketing, Vol. 56, pp. 55-68. |
| [9] | Strandvik, T. and V. Lijander (1994). “A Comparison of Episode performance and relationship performance for a discrete service,” Paper presented at the 3rd Service Marketing Workshop, Berlin, Germany. |
| [10] | Jain, S K and Gupta, Garima (2004), "Measuring Service Quality: SERVQUAL vs. SERVPERF Scales", Vikalpa, The Journal for Decision Makers, Vol.29, No.2, pp. 25-37. |
| [11] | Wang Y., and Po Lo H., (2002), “Service Quality, Customer Satisfaction and behavior intentions-Evidence from China’s Telecommunication Industry”, The Journal of Policy Regulation and Strategy for telecommunication Information and Media, Vol.4, No.6, pp.50-60. |
| [12] | Oliver, R.L. (1993) "Cognitive, affective and attribute bases of the satisfaction response", Journal of Consumer Research, Vol. 20, pp. 418–430. |
| [13] | Negi R., (2009). "Determining Customer Satisfaction Through Perceived Service Quality: A Study Of Ethiopian Mobile Users" International Journal of Mobile Marketing, Vol.4, No.1, P31-38. |
| [14] | Rahhal, W (2015), "The Effects of Service Quality Dimensions on Customer Satisfaction: An Empirical Investigation in Syrian Mobile Telecommunication Services", International Journal of Business and Management Invention, Volume 4 Issue, PP-81-89. |
| [15] | Sharma N., and Ojha S., (2004). Measuring Performance in Mobile Communications, Service Industries Journal, Vol.24, No.6, pp. 109-128. |
| [16] | Yadav Rajesh K. & Dabhade Nishant (2013). Impact of service quality on customer satisfaction of mobile users - A case study of Airtel" International journal of innovative research and studies, Volume: 2, Issue: 5, May 2013, pp. 139-163 ISSN - 2319-9725. |
| [17] | Asiegbu B.C., Ohuabunwa A.E., Nwakanma I.C., and Ezeh G.N. (2015), Assessment of Factors Affecting Quality of Service of Cellular Mobile Network Operators in Nigeria for the Period 2010 to 2014. International Journal of Engineering Research and Management, Vol. 2, No 5 PP.294-299. |
| [18] | Sekaran, U., & Bougie, R. (2010). Research Methods for Business: A Skill Building Approach (5th edition). New Jersey: John Wiley and Sons. |
| [19] | Krejcie, R., & Morgan, D. (1970). Determining sample size for research activities. Educational and Psychological Measurement, 30, 607–610. |

 Abstract
 Reference
 Full-Text PDF
 Full-text HTML