-
Paper Information
- Previous Paper
- Paper Submission
-
Journal Information
- About This Journal
- Editorial Board
- Current Issue
- Archive
- Author Guidelines
- Contact Us
American Journal of Economics
p-ISSN: 2166-4951 e-ISSN: 2166-496X
2017; 7(3): 143-154
doi:10.5923/j.economics.20170703.05

Comparison of Macroeconomics Variables among European Union and East Asian Countries
 Abstract
 Reference
 Full-Text PDF
 Full-text HTML
Isaque Manteiga Joaquim
PhD Scholar, School of Economics, Shandong University, Jinan, China
Correspondence to: Isaque Manteiga Joaquim, PhD Scholar, School of Economics, Shandong University, Jinan, China.
| Email: |  |
Copyright © 2017 Scientific & Academic Publishing. All Rights Reserved.
This work is licensed under the Creative Commons Attribution International License (CC BY).
http://creativecommons.org/licenses/by/4.0/

European Union is extremely integrated market with more than 500 million consumers searching for quality goods. EU trading bloc is largest exporter to more than 80 countries and 71 per cent imports enter in EU region at reduced or sometimes at zero tariffs. Still EU has having motivated agenda with other world for a number of trade agreements in the pipeline. Basic idea behind this research study is, whether EU trading bloc has improved the performance of member countries or not? Research study finds that EU trading bloc has increased the production and welfare of the peoples in EU region. Now, it is suggestion for East Asian countries to make East Asian Trading Bloc (EATB) for improved performance and better wellbeing of the people in near future. This study presents the new regression estimates of relationship among openness of trade and Foreign Direct Investment inflows for Bangladesh, China, India, Malaysia, Nepal, New Zealand, Pakistan, Philippines, Sri Lanka and Thailand over the period 1982-2013. Fixed effect and Pooled OLS techniques are used to analyze the panel data for measuring individual country effects, group effects and time effects while exploring the relationship among openness of trade and FDI inflows. Results showed that higher openness of trade have significant positive impact on FDI inflows. The results also investigated that FDI inflows seem to be affected significantly by conventional determinants like as Exchange rate and GDP per capita etc. Based on results the authors have concluded that increase in trade openness would be a better option for more and sustained FDI inflows for the long run and also improving the welfare of the people.
Keywords: Trade openness, FDI, Exchange Rate, Time effects, Group effects, Country effects
Cite this paper: Isaque Manteiga Joaquim, Comparison of Macroeconomics Variables among European Union and East Asian Countries, American Journal of Economics, Vol. 7 No. 3, 2017, pp. 143-154. doi: 10.5923/j.economics.20170703.05.
Article Outline
1. Introduction
- European Union has achieved a well-built position with one voice by acting together on the global state, rather than with 28 disconnected trade strategies. European Union is a composition of 28 member countries; most of the countries included from Central and Eastern Europe. EU member countries adopt common set of policies on social, economic and political issues. EU has regional development funds, possibly known as structural funds, having the second largest provision of budget. EU member countries are a single market through which capital, goods and people can move freely with common trade and agriculture policies. European Union has become extremely integrated market into the globe. They have more than 500 million consumers searching for quality goods. EU is most open international market not only for developing but also for developed countries. EU is a single largest market of the world with transparent rules and regulations and also secures the legal investment framework. Know with modern transportation and communication, it is easier to produce, sell and buy products around the whole world. Foreign Direct Investment and trade are often seen as imperative economic indicators. Trade openness contributes positively to FDI inflows [14]. According to World Bank databank in 2013, trade openness in last 5 years (from 2008 to 2012) is increasing in India and Pakistan but FDI inflows are decreasing in the same years for India & Pakistan. All studied countries have specific boundaries, different political systems, policies and having separate currency units. Initially, the developing and developed countries of the world followed the policies of restricted trade but with the passage of time, and with globalization emergence, all the countries realize the importance of trade liberalization. Country’s trade is a key determinant for not only industrialization but it also improves the technologies. It is important, how much the trade policies are liberalized because it affects the level of output and economic activity also. On the other hand, the willingness of foreign investor for investing his/her resources is always toward favorable polices, market and good infrastructure facilities. Hence, foreign direct investment (FDI) inflows are purely induced by the host country environment. If host countries are successful in providing large consumer markets, favorable polices and good infrastructure facilities then they cause great economies of scale and economies of scope along with cost efficiency. If country is unable in providing such facilities explained above then low attraction for FDI inflows. Due to restricted trade policy framework, until 1991 FDI inflows were not significant in Pakistan [17]. The potential role of multinational corporations can be acknowledged as they spread the foreign knowledge and also help in fostering economic growth and development also. FDI comprises more capital and new technologies hence increase the knowledge level [7]. FDI inflows raises the process of competition, raises the amount of stock capital and transfer of technologies [9].In different times FDI has different impacts on the host countries’ economies. Technology transfer in developing countries is especially important as they lack the essential infrastructure in terms of liberalized market, socially and economically stable economies. Apart from technologies, knowledge, capital; Foreign Direct Investment inflows frequently contains a bunch of resources, containing administrative and organizational skills, know-how with entry to international markets through the way of networks of Multinational Organizations [13]. In this way, FDI plays a two-fold role by capital accumulation/formation and by increasing the total factor productivity 15. In contrast, if the country is totally dependent in FDI inflows then it is expected to have negative effects on economic growth and development. FDI creates industrial structures in which the monopoly is predominant [6]. Because economic control by foreign persons would not be developed purely [4], FDI posits positive as well as some negative impacts on countries.Does a country go for trade liberalization or not? Does trade openness increase the FDI inflows which in turn increase the wellbeing of the people? For last three decades, most debated issues are regarding trade policies [12]. Trade openness along with the combinations of others, enhance the FDI inflows. Trade openness is likely to influence the inflows of international capital [2]. In last, free trade referred as engine of economic growth. Expending trade activities or trade liberalization act as a stimulus in growing the level of demand at local that then establishes the large scale industries through FDI inflows.
2. Literature Review
- Trade openness and FDI inflows have been addressed theoretically and also empirically. Liargovas et al in 2012 examine the significance of openness of trade for attracting the Foreign Direct Investment inflows while studying 36 countries from developing world for the time period 1990-2008. They found that trade openness positively affects the FDI inflows. Kakar and Khilji in 2011, examine the FDI and trade openness with special relation with economic growth for Malaysia and Pakistan for time period 1980-2010. They found that trade openness significantly positively affects the economic growth of Malaysia and Pakistan in the long run. Neumayer & Soysa in 2004 examine the affiliation between trade openness, FDI and child labor. They found that country more open towards the trade have higher stock of FDI inflows and this also lowers the incidence of child labor thus globalization is linked with reduced not additional child labor. Trevino and Mixon in 2004 explore the relationship between strategic factors and FDI for seven Latin American countries. They found that MNEs invest in those countries where distance between home and host country is not wide. Abrego in 1999, explore the relationship between trade liberalization and FDI while studying the economy of Costa Rica and OECD countries for the period of 1990-91. He investigated that complete trade liberalization ends up with reduced welfare as it leads to capital outflows and loss of tax revenue. Froot and Stein in 1991 explore the effect of official exchange rate on FDI. They found a country with weaker currency attracts more FDI inflows.Barlow in 2006 finds that trade liberalization positively impacts the growth. Jenkins and Sen in 2006 inspect the impact of FDI and openness of trade for employment and maintenance for developing nations. Ynikkaya in 2003 indicates that trade openness is significantly related with increased per capita income growth. Wacziarg in 2001 finds that Trade openness has greater importance for long-run economic growth. Edwards in 1998 indicates that growth in poor countries does not depended on trade openness, knowledge but skills and production cost also plays a key role. Thus, different researcher fined dissimilar status for trade openness.
3. Data and Methodology
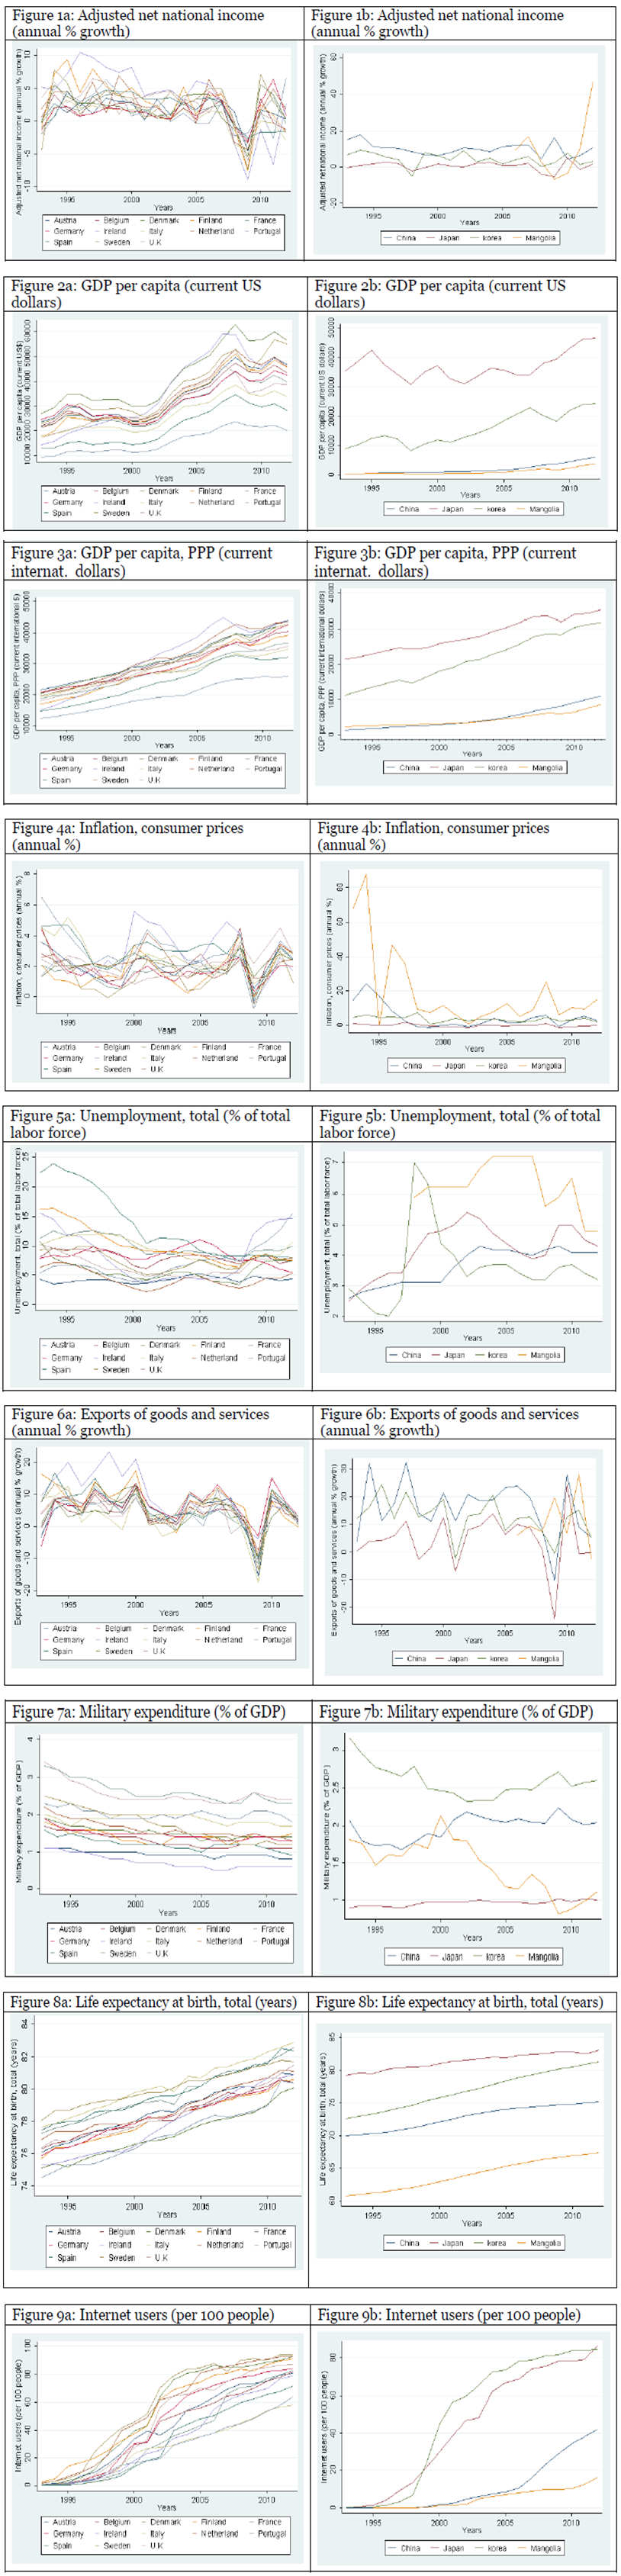
- EU trading and economic bloc consists of 28 member countries but data is taken only for 13 member countries. For best explanation of data analysis those members are selected who have membership before 1996 except Luxemburg (Luxemburg is performing as an outlier). From East Asia countries data is also collected for only four countries (Japan, China, Korea and Mongolia). The data set consists of 20 years period from 1993 to 2012. Basic purpose of data analysis is to check whether EU trading and economic bloc have improved the performance of member countries or not. The data set consists of the period 1982 to 2013, which is thirty two (32) years. The observed data was time series as well as cross sectional data, which is converted to Panel data/Pooled data.
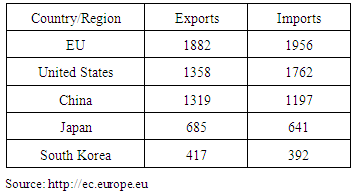
|

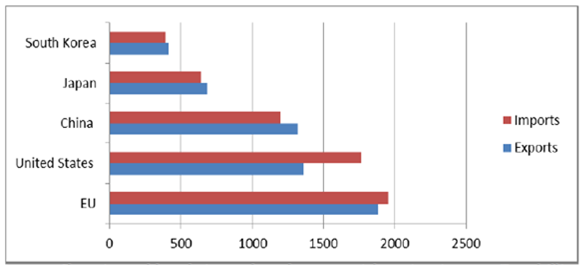 | Figure 1. Share in world trade in goods and commercial services in 2012, Euro billions (from Table 2) Source: http//ec.europa.eu |
|
 | (1) |
 is that
 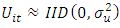 , i.e. errors are independently identically distributed with zero mean and stable variances. Empirical panel data can be analyzed through three different methods. First: the Ordinary Least Square (OLS), second: Random Effect Model, third: Fixed Effect Model. Akbar, et al, in 2011 has used OLS, FEM and REM for the estimation of GDP per capita for nine (9) Asian and Pacific countries. OLS is used to estimates the equations of regression. But this type of estimation may create a problem of interpretation when we want to study the country specific characteristics like as, Policy changes; political regimes and good governance that affects the FDI inflows are not considered. The methodology is further divided into four subsections which are presented below.
 3.1. Group Effects with Constant Slope Coefficients
- The baseline model in order to check the group effects, where all coefficients are constant across time and countries, would be written as:
 | (2) |
3.2. Country Effects with Constant Slope Coefficients
- For checking the individuality of each country, let the intercept vary for all ten countries but still we have to assume that the slope coefficients of respective countries are still constant. To see this model would be of following format:
 | (3) |
 to
to  represents the dummies for Bangladesh, India, Malaysia, Nepal, New Zealand, Pakistan, Philippines, Sri Lanka and Thailand respectively.
 3.3. Time Effects with Constant Slope Coefficients
- For checking the time effects, time dummies are introduced. As data set is for 32 years from 1982 to 2013, so we introduce only 31 dummies for preventing from dummy variable trap. The model would be of following type:
 | (4) |
 take the 1 value for observation in year 1983 and takes zero (0) otherwise, etc. Here, 1982 is treating as a base year that’s intercept value is
  .
. 3.4. All Coefficients (Intercept & Slope) Vary Across Countries
- Here, intercepts and slopes coefficients are different for all ten countries. Here the slope dummies or interaction terms are used and they are account for differences in slope coefficients. We will multiply country dummies by each of the regressors. This can be shown in the following model:
 | (5) |
 are differential slope coefficients just like
  are differential intercepts. If one or more than one
  coefficients are presenting the value that is statistically significant, then it can be said that slope coefficients are different than base group.
 4. Results
- After conducting a panel data analysis we see some interesting results. For choosing the best model between FEM and REM, Hausman in 1978 test is used, which favors in all for FEM (Fixed Effect Model). The results are distributed further in four sections, which are as follows:
4.1. Group Effects with Constant Slope Coefficients
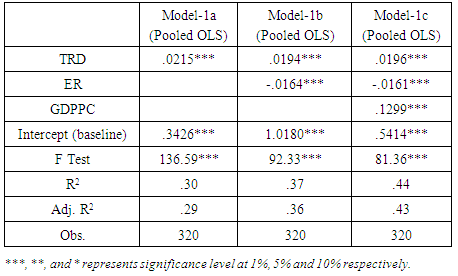
- Results for all coefficients constant across countries and/or time are presented in Table 3 Concluded fact is that null hypothesis cannot be rejected that explanatory variables in study does not enlighten the FDI inflows. Pooled OLS Model-1a fits the data in a well way and significant at the 1% level. Adjusted R2 of .30 says that Model-1a accounts for 30 percent of the total variance in the FDI. In Model-1a, for 1 percent increase in trade openness the total FDI inflows for selected all ten countries are expected to increase 0.0215, holding all other variables and intercept constant. A good-ness of fit measure R2 is increasing with the addition of more regressors which means that the included variables are going to response more for better explanation of the model.
|
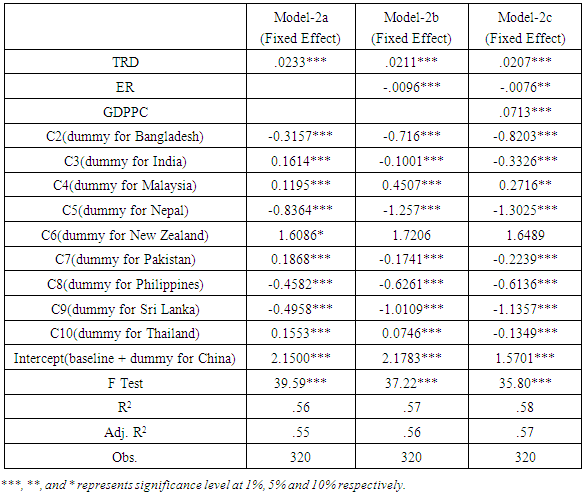
4.2. Individual Country Effects with Constant Slope Coefficients
- After conducting the Fixed Effect Model (FEM) with the technique of Least Square Dummy Variables (LSDV), results are presented in three models form Model-2a to Model-2c in Table 4 to check the exact nature of relationship among FDI and openness of trade and some of the other explanatory variables.As we are interested in finding the country effects that are due to different political systems, different monetary and fiscal policies and different managerial abilities, so we are using the dummies to estimates the Country fixed effects, Which is also known as Least-Square Dummy Variables (LSDV) model in literature. Here we examine the fixed group effects by introducing group (country) dummy variables. Here the results are obtained for c2 to c10 because we have to include only nine dummies to prevent from dummy variable trap. The differential intercept coefficient tells by how many the other countries are different from the intercept of China. In short, we can say China is a comparison country. Akbar et al, in 2011 uses Pakistan for comparison country. This fixed effect model posits that each country has its own intercepts but share the same slopes of explanatory variables (i.e., trade openness, exchange rate and GDP per capita). The parameter estimate of c1 (dropped dummy) presented in Model-2a is 2.15, which is the intercept of baseline for China. c2 to c10 dummies intercepts have deviation from its group specific intercept that is the baseline intercept (intercept for China). These differences in country intercepts are due to the unique features of managerial talent or managerial style etc.
|
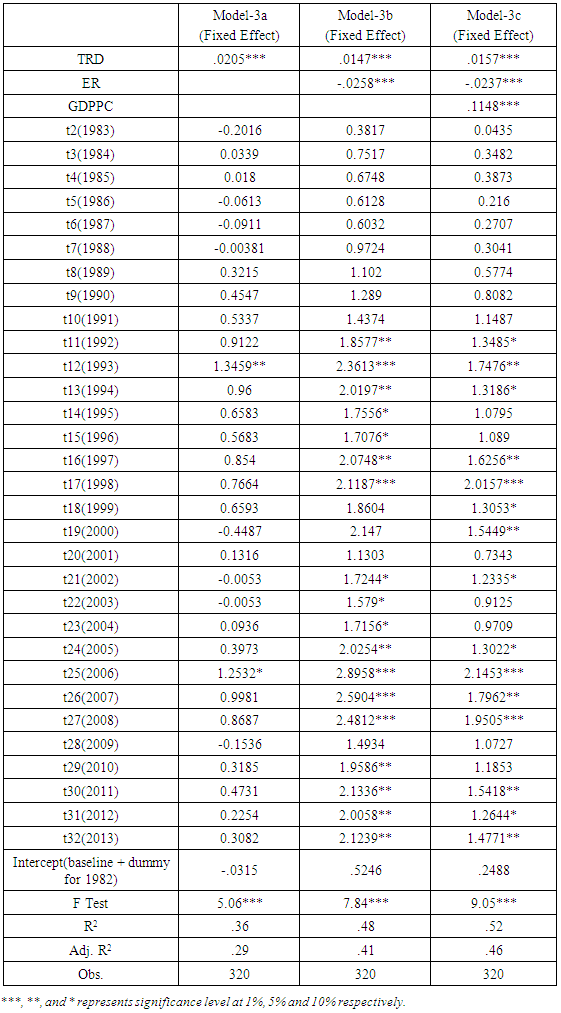
4.3. Time Effects with Constant Slope Coefficients
- Results for fixed effect model are presented in Table 5; it is marked that F-Test is significant at the level of 1 per cent in all models from Model-3a to Model-3c. Therefore, it is concluded that we cannot reject the null hypothesis that regressors variables does not clarify the FDI inflows and the selected determinants can be considered enough in order to explain the FDI inflows. Trade openness plays a very important role in determining the FDI inflows. In 2007, total inflows of Foreign Direct Investment (FDI) were US$ 1833324 million in the world, only 27.3 per cent for developing and rest for developed world. Dummy variables can also be used in checking for the time effects with making a sense that changes occurs in different countries over a time, due to the factors like change in government regulatory, tax policies, technological changes, changes in overall education level and sometimes outdoor effects like as wars and other conflicts.
|
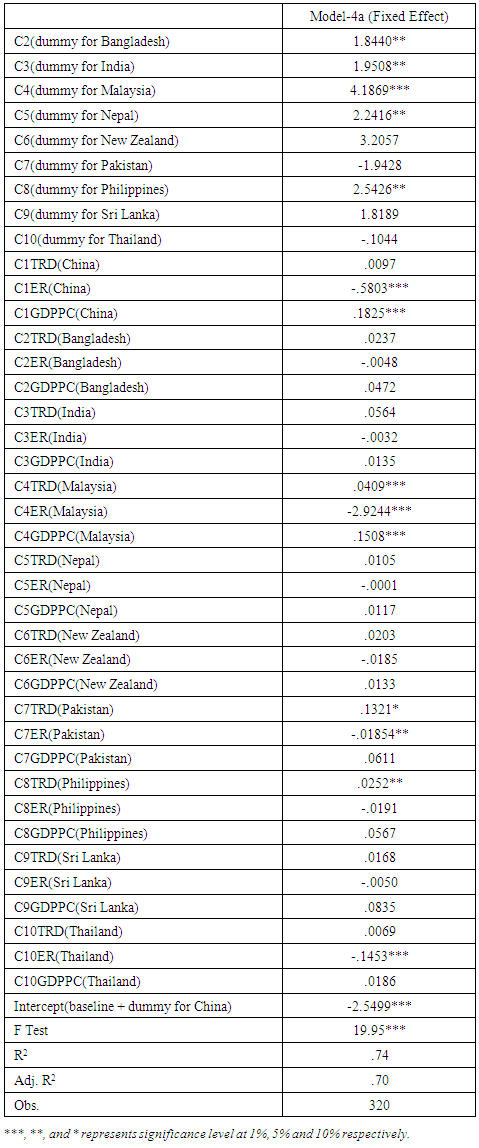
4.4. All Coefficients (Intercept & Slope) Varies Across Countries
- Table 6. presents the estimated FDI inflows where all the studied co-efficients vary across countries. Some of the differential slope coefficients are also statistically significant. In Model-4a for 1 percent increase in trade openness of Pakistan, FDI inflows for selected countries are expected to increase by .1321 units, holding all other variables constant.
|
5. Limitations
- In terms of policy implications, the issues that are central in the exploration of the trade openness should also be investigated. Although analysis presented and empirical models constructed for research are as complete and comprehensive as possible but still there are some limitations causing further suggestions for future research, one of them is analysis covers only ten (10) countries thus the results only presents the realities of ten selected countries only.
6. Conclusions
- Trading bloc not only improves single country’s performance but it also increases the overall performance of the region. Thus, trading bloc means regional growth and development. Trading bloc increases co-operation among the countries. After EU trading bloc the performance of every EU member country is increased, so here, a suggestion for East Asian countries to make East Asian Trading Bloc (EATB). We have used panel data of ten selected developing and developed countries Bangladesh, China, India, Malaysia, Nepal, New Zealand, Pakistan, Philippines, Sri Lanka and Thailand to capture time and country effects of trade openness on FDI inflows. Considering our data set of nine countries between 1982 and 2013 periods, we have consistently found that high trade openness causes the increase in FDI inflows in all models. Research study first presents the importance of trade openness phenomenon. As we saw the FDI is very heatedly discussed in national as well as international level. FDI inflows of Bangladesh, China, India, Malaysia, Nepal, New Zealand, Pakistan, Philippines, Sri Lanka and Thailand are influenced by trade openness. All in all, the research study supports the view that there is scope for developing and developed countries in order to correcting and maintaining the economic development indicators, so the FDI inflows would be sustainable. Research conclusion underlines the importance of trade openness to the FDI inflows, both on global and as well as on local level. Hence, the conclusion indicates that increased trade openness increases the FDI inflow in the short-run and as well as in long-run.
Appendix Graphical Presentation
 | Figure 3.1. FDI differences between among studied countries |
 | Figure 3.2. Trade openness differences between among studied countries |
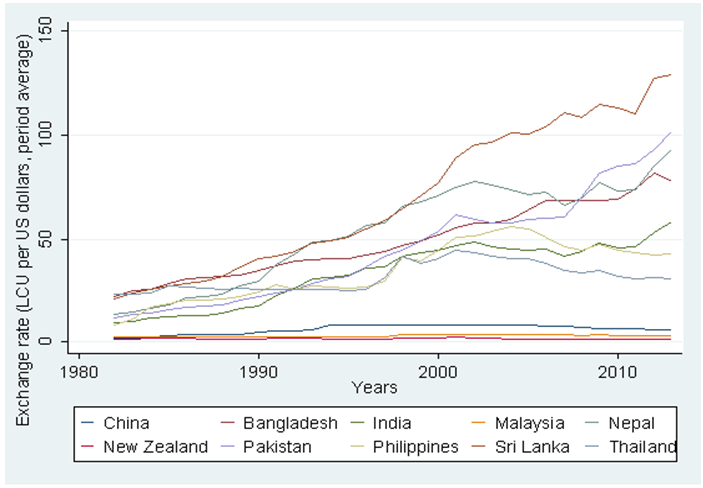 | Figure 3.3. Exchange Rate differences among studied countries |
 | Figure 3.4. GDP per capita differences between among studied countries |
 | Figure 3.5 |
Notes
- 1. Synthesis Report, DGRegional Policy, Evaluation Unit, December, Brussels. CEC (2004b), “The Mid- Term Evaluation in Objective 1 and 2 Regions – Growing Evaluation Capacity: Final Report”.2. UNCTAD, 2009. World Investment Report 2009: Transnational Corporations, Agricultural Production and Development. New York: United Nations Centre on Transnational Corporations.