Maryam Zare
Islamic Azad University of Shiraz, Iran
Correspondence to: Maryam Zare, Islamic Azad University of Shiraz, Iran.
| Email: |  |
Copyright © 2017 Scientific & Academic Publishing. All Rights Reserved.
This work is licensed under the Creative Commons Attribution International License (CC BY).
http://creativecommons.org/licenses/by/4.0/

Abstract
Stock market has always attracted the attention of economist and stock managers. Also, higher stock prices reflect an increase in the discounted expected earnings, providing potentially useful information about future economic growth. Hence, the factors affecting on this market are examined in Iran during 1996-2015. For this reason, ARDL approach is applied for Data analysis. The results examine that while exchange rate, inflation rate and financial index rate have a positive significant effect, interest rate has a negative significant on real stock prices.
Keywords:
Stock prices, Monetary policy, Financial index, Inflation rate, Exchange rate
Cite this paper: Maryam Zare, Factors Affecting the Long-Run Stock Prices Performance in Iran, American Journal of Economics, Vol. 7 No. 3, 2017, pp. 125-130. doi: 10.5923/j.economics.20170703.03.
1. Introduction
In developing countries, economic depression due to stock market crash are more significant than developed countries. Since there are concerns of drawdown and economic instability. Changes in the investment return risk due to fluctuations of macroeconomic variables can be affect the investment options.In this study, we investigate stock return in Iran stock exchange with respect to macroeconomic variables of inflation rate, exchange rate, financial index and interest rate.
2. Review of Literature
Musai et al, (2010) in a study titled “The relationship between stock market and macroeconomic variables” tried to investigate Cointegration and causality relationship between macroeconomic variables and total stock prices index during 1990-2005. For this purpose, quarterly data related to the index and macroeconomic variables of money supply, GPD and exchange rate were used. To investigate short-run and long-run relationship among the variables, they applied Engle-Granger approach, ARDL, Johansen test and the error correction. The model is defined as follows:  Where, LPs refers to logarithm of total stock prices index, LM is logarithm of money supply, LGDP is logarithm of GDP, LBMER is logarithm of exchange rate and ‘u’ is the error term. The results show that there is a long – run relationship between the variables and total stock prices index. According to the results, while money supply (central bank's monetary policy) has the greatest impact on the stock prices changes, the effect of exchange rate and GDP on stock exchange shows uncertainty. In addition, based on Granger approach, total stock prices index have an insignificant effect on GDP while macroeconomic variables can lead to growth or depression. This conclusion shows that total stock prices index can’t be utilized to predict GDP. Also, stock prices do not completely follow random walks as the efficient market hypothesis predicts.Taheri H et al (2011), in a study titled” Evaluation of the relationship between exchange rate and Tehran stock exchange index using ARDL approach” used ARDL model to examine long-run relationship between stock prices index in Tehran stock exchange and exchange rate. They also used monthly data during 2000-2007. The model is defined as follows:
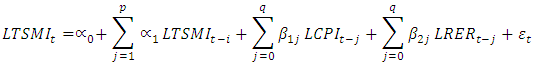 Where LTSMI is logarithm of Tehran stock exchange index, LCPI is logarithm of consumer price index, LPER is logarithm of exchange rate and
  is the error term. It is necessary to assess the stability of the variables before estimation of the model. For this purpose, Augmented Dicky-Fuller test can be used.The results examined that there is a positive relationship between stock exchange index and real exchange rate. The estimated coefficient is equal to 1.5 which satisfies theoretical models. Analyzing the direct relationship between real exchange rate and stock exchange index shows that the related companies cause raise in the exchange rate, the challenge of exporting increases and as a result, increase in the exports of goods, services and primary income will improve their efficiency. In this case, as the real exchange rate increases and the income improve, the demand for shares and also, the stock exchange index will increase. With regard to the direct effect of exchange rate on stock exchange index which called “Thermometers of Economy”, the central bank policies need to be considered substantially. Heidary H and Bashiri S (2012), in a study titled” Evaluation of the relationship between real exchange rate uncertainty and Tehran stock exchange: Evidence from VAR-GARCH model” tried to investigate the relationship between real exchange rate fluctuations and Tehran stock exchange during 2000-2010. They used MGARCH (1, 1) - VAR (1) model to estimate conditional mean, variance and covariance of real exchange rate and stock price index variables, simultaneously. The parameter of equation according to two-variable model are given as follows:
 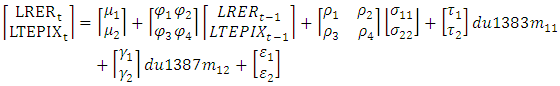 Where LPER and LTEPIX refer to logarithm of real exchange rate and logarithm of stock prices index, respectively.
  And
And  are the error terms. Since the results of structural breaks tests shows a failure in the variables, hence, complex variables used in 2004 (which stock exchange index plummeted and stock market bubble taken place) and 2008 (which oil revenue dropped due to global financial crisis).The results examine that real exchange rate uncertainty has a negative significant impact on price. Furthermore, according to the results, there is no significant relationship between stock prices uncertainty and real exchange rate. Since, on one hand, real exchange rate uncertainty leads to currency speculation and to liquidity transfer and on the other hand, causes to stock companies prices increase, decrease in stock prices and also depression would be expected. Therefore, the policies which cause fluctuations and uncertainties must be avoided to provide market shares and price index growth. The complex variables used in the model, have a significant effect on stock price. Also, the complex variable which used in 2008 global financial crisis has remarkable effect on real exchange rate.Shaki S and Tofighi H (2012), in a study titled “effect of exchange rate fluctuations on Iran Stock exchange” tried to examine the relationship between exchange rate fluctuations and Iran Stock exchange. They also defined oil price and consumer price index (CPI) as the explanatory variable besides the exchange rate fluctuations. In this research, monthly data during March 1998-April 2008 have been analyzed. In order to check the stationary time series, Augmented Dickey–Fuller test has been used. The exchange rate fluctuations have estimated using the generalized autoregressive conditional heteroskedasticity (GARCH) process. Then, the relationship among the variables has been determined using Johansen test and autoregressive distributed lag model.The model is defined as follows:
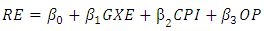 Where, RE refers to stock market return, GXE, OP, and CPI are the exchange rate fluctuations, oil price in Iran and consumer price index, respectively.The results of Cointegration analysis interpret that there is a short-run relationship among the variables (stock market return, exchange rate fluctuations, oil price and consumer price index) which is positive between stock market returns, exchange rate fluctuations and CPI and the relationship is negative between stock exchange return and oil price which is compatible with theories. In other word, it can be concluded that the exchange rate shocks can change the competitive position of domestic producers. Increase in exchange rate causes to domestic productions are able to compete with imported goods and also causes to the exports which leads to increase in national production, occupation and domestic and foreign investments, income of selling currency for government stock exchange growth and etc. Also tax and tourism revenues increase due to manufacturing activity development. There is a negative correlation between fluctuations in oil prices and stock return. As the oil price increases, both currency revenue and imports increases. Therefore, imports of foreign goods affect the producers’ activity and profit of the companies falls due to decline in sales and also, stock prices and stock exchange return.Yahyazadefar et al (2012), in a study titled “The effect of oil price and revenue shocks on stock’s real return in listed companies of Tehran stock exchange“ tried to investigate the effect of oil price and revenue shocks on stock’s real return. Furthermore, the effect of factors of GDP, inflation rate, trading volume, exchange rate and money supply were analyzed. Quarterly data during 1995-2010 were used and ARDL method was applied. The cases study are as follows: food, chemical, metal fabrication, non-metal, wood and textile industries.The effect of economic variables are evaluated as the following model which Oil price and oil price shock (complex variable) are used in equation (1) and oil revenue and oil revenue shock (complex variable) are used in equation (2) as oil fluctuations index:
 | (1) |
 | (2) |
Where  refers to real stock return, GDP is gross domestic product, M is money supply (liquidity), POIL is oil price, ROIL is oil revenue, DP is oil price shock, DR is oil income shock, ER is nominal exchange rate, INF is inflation rate, TT is trading volume and
  is the error terms.The results showed that the effect of oil price and revenue shocks on real returns of food, chemical and non-metal industries were negative and significant. Furthermore, the effect of exchange rate on real returns of mentioned industries was positive and significant. In addition, the effect of inflation rate on food industry is positive. Overall, none of the trading volume, cash volume and GDP variables didn’t a significant contributions on stock’s real return fluctuations. In addition, there variables didn’t have any effect on real returns of wood and metal industries.A.M. Ishfaq and R. Rehman, A. Raoof (2010), in a study titled "Do Interest Rate, Exchange Rate effect Stock Returns? A Pakistani Perspective” examined the relationship between stock return, interest rate and exchange rates in Pakistani economy during 1998-2009. A multiple regression model is applied to test the significance of change in interest rate and exchange on stock returns. The model is defined is as follows:
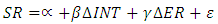 Where, SE refers to stock returns,
  is change in interest rate,
  is change in exchange rate and
  is the error term. The sample period which have been selected for this study is important because in that decade we have witnessed a phenomenon growth in stock market as well as very stable interest and exchange rate in Pakistan. Changes in interest and exchange rate affected stock returns significantly. The results showed that the average stock market return over the period of twelve years is 20%. The coefficient of change in exchange is 2.62 which showed a positive relationship with stock return. The test statistics showed that the change in exchange rate had had a significant impact on stock market but in positive direction. On the other hand, the change interest rate coefficient is -1.56 showed its negative relationship with stock returns.Y. Li and L. Huang, (2010) in a study titled” On relationship between stock return and exchange rate: evidence on china “tried to investigate the relationship between RMB exchange rate and A-share stock returns in China, in particular in Shanghai stock market during 2005-2008. The Engle-Granger Cointegration test was performed. The unit root and Cointegration tests were performed before conducting the Granger causality test to measure the changes in the existence and directions of causality. The model is defined as follows:
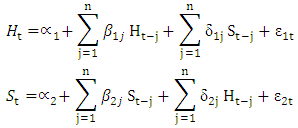 Where H refers to nominal exchange rate, S is stock returns,
  and
and  are the error terms. The results suggested that there was not a long-run equilibrium relationship between stock returns and RMB exchange rates. However, there was strong evidence suggesting that there was a short-run uni-directional causality relationship from the nominal exchange rate to the stock returns at 5% significance level.D. Harjito and B. McGowan, (2011) in a study titled “Stock Prices And Exchange Rate Causality: The Case Of Four ASEAN Countries” tried to investigate the statistical relationship between stock prices and exchange rates using Granger causality and Johansen Cointegration tests in four ASEAN countries (Indonesia, the Philippines, Singapore, and Thailand) over the period 1993-2002. The model is defined as follows:
 Where STOCK refers to stock prices, EXCH is exchange rate,
  and
and  are the error terms. The results of this study, suggested that the important role that might be played by the exchange rates and the stock prices in the ASEAN countries economy in the long-run. Furthermore, there was unilateral economy relationship between the exchange rates and the stock prices. The bi-directional Granger-causality between the exchange rates and the stock prices in the certain country (Singapore, and Thailand) indicated that the economic growth in this country influenced by these variables. Also, the bi-directional causality between two countries indicated that there was bilateral economy relationship closely.P. Parsva and H. Lean, (2011) in a study titled” The analysis of relationship between stock prices and exchange rates: Evidence from six Middle Eastern financial markets” tried to evaluate the relation between stock returns and exchange rate for six Middle Eastern countries, namely Egypt, Iran, Jordan, Kuwait, Oman, and Saudi Arabia before and during the 2007 global financial crisis. Sample period ran from 2004 to 2010. In this study, the macroeconomic variables of interest rate, inflation rate and oil price were evaluated. The model is defined as follows:
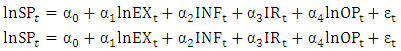 Where, lnSP refers to stock price. LnEX is exchange rate, INF is inflation rate, lnOP is oil price and
  is the error term. The results of the study showed that there was long-run co-movement among the variables, also stock prices Granger cause exchange rates and vice versa, so there was a feedback causal relationship between stock prices and exchange rates in the nations after the crisis.Osamwonyi and E. Osagie, (2012) in a study titled “The Relationship between Macroeconomic Variables and Stock Market Index in Nigeria” attempted to determine the relationship between macroeconomic variables and the Nigerian capital market index. It considered the yearly data of several macroeconomic variables of interest rates, inflation rates, exchange rates, fiscal deficit, GDP and money supply from 1975 to 2005. The model is specified in functional form as follows:
 With the variables defined as follows:SMI - Stock market indexIR - interest rate IFR - inflation rateFD - fiscal Deficit ER - exchange rate Ms - money supply GDP - Gross Domestic Product
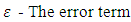 The findings showed that there was a negative short-run and long-rung relationship between supply money and stock price. Also, the exchange rate had a positive short-run and negative long-run impact stock price. In addition, fiscal Deficit had a positive effect on stock price which was insignificant. It also can be concluded that while there was a significant short-run relationship between GDP and stock price, the relationship between interest rate and stock price was negative and negligible.
3. Theoretical Framework of the Study
At the end of imposed war in Iran, stock exchange’s activities started more widely, in order to Public participation. In study of the effective factors on markets or market economy, finding the variable (or variables) that can illustrate the relationship between the financial sector and real economy, are substantial. In this regard, we evaluate the macroeconomic variables (inflation rate, exchange rate and etc.) which have a significant effect.There are various factors which can affect the investment decisions. Furthermore, Risk tolerance and returns are crucial factors.Financial marketFinancial markets are markets in which people trade financial assets. Financial assets are non-physical assets whose values are derived from a contractual claim, such as bank deposits, bonds, and stocks. There are two types of financial markets:• Money market: it is a component of the financial markets for assets involved in short-term borrowing, lending, buying and selling with original maturities of one year or less.• Capital Market: it is a financial market in which long-term debt or equity-backed securities are bought and sold. Capital markets are defined as markets in which money and assets are provided for periods longer than a year and the ones which offered with no maturity date. It also includes stock exchanges.Tehran Stock ExchangeTehran Stock Exchange commenced the operation on February 1967 according to the law approved by the parliament on 1966.TSE activities process could be divided into four periods: The first period (1967-1978), the second period (1979-1988), the third period (1989-2006) and the fourth period (2007-2017).The factors affecting on Stock exchangeAs we know, there are various factors such as domestic, Psychological, political and Economic factors that can influence Stock price and returns. Long term fluctuations and uncertainty associated with these variables cause problems in investors’ decisions and predictions. Inflation and Stock returnsInflation rate is one the affecting factor on Stock returns. So far, many studies have been performed to investigate the relationship between inflation and stock returns but there is no consensus among researchers. Exchange rate and Stock returnsExchange rate between two currencies is the rate at which one currency will be exchanged for another. It is also regarded as the value of one country’s currency in relation to another currency. Movements in the exchange rate will determine competitiveness in global market. There is a mutual relationship between the exchange rate and the other variables. Also, Domestic and foreign policies and also economic developments can influence the exchange rate which is a key concept.Interest rate and stock returnsInterest rate has a significant effects on economy and Changes in interest rate can affect the investment. In general, decrease in interest rate will provoke investment and economy activities and increase in interest rate will decrease the stock price and return. Therefore, a negative relationship between the exchange rate and stock return could be expected.Financial index and stock returnThere are different kind of financial indices. Here, Domestic credit to private sector (% of GDP) has been applied.The model and variablesThe main objective of this study is to investigate the effect of exchange rate, interest rate and financial index rate on stock return. For this purpose, the following model is applied: Where, Lsr is logarithm of stock price, inf is inflation rate, Lrer is real exchange rate, Rlr is real long-run interest rate, and Li2 is logarithm of financial index (Domestic credit to private sector (% of GDP).Tests: Auto-Regressive Distributed Lags Model (ARDL): Pesarn and Shin (1999) have suggested the use of the traditional Auto-Regressive distributed lags (ARDL) in order to analyze long-run relationships between nonstationary variables. ARDL Model with a number of P lags for dependent variable (yt) and a number of q lags for explanatory variables (xt) is written as follows:
 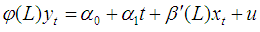 where L is lag operator and t is the time trend,
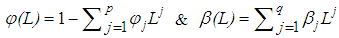 After application of equal conditions of lags for each variable, long term relationship between variables is obtained as follows which can be used to estimate long term coefficients in the model:
 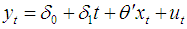 Where
Where 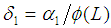 and
and 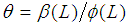 (Pesaran & Shin, 1999). When estimating the coefficients using ARDL, in the first stage, optimal p and q lags are selected by using Akaeik Index or Schwarz Bayesian Index. In the next stage, long term coefficients of the variables and their critical points are estimated via ARDL Model as used in the first stage. Structural stability testCumulative sum test (CUSUM) and cumulative sum of squares test (CUSUMQ): In order to examine the stability of model coefficients, CUSUMQ and CUSUM tests employed for a long time in the literature on econometrics are used. In these tests, the null hypothesis examines the stability of parameters at a significance level of 5%. The confidence interval in these two tests is two straight lines that show a confidence interval of 95%. If the test statistics is between these two lines, it is not possible to reject the null hypothesis showing the stability of the coefficients.
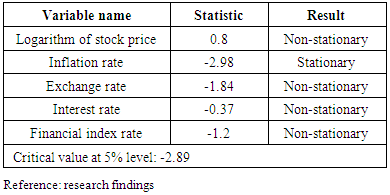
 Table 1. The results of stationary test for all variables at level
 |
| |
|
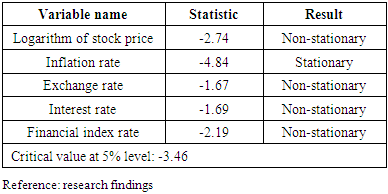
Table 2. The results of stationary test for all variables at level
 |
| |
|
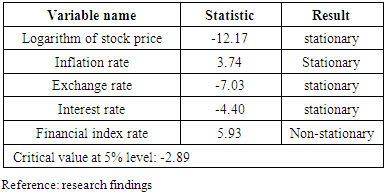
Table-3 shows that the non-stationary variables at level will be stationary at first difference.Table 3. The results of stationary test for all variables at first difference
 |
| |
|
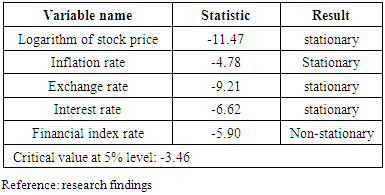
Table 4. The results of stationary test for all variables at first difference
 |
| |
|
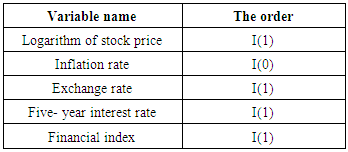
Table-5 shows the overall results of stationary test for the variables. The results demonstrate that all of them are first-order except the inflation rate.Table 5. Overall results of stationary test
 |
| |
|
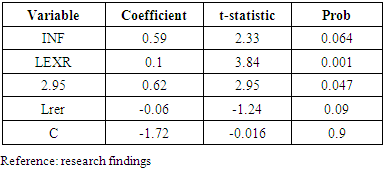
Forasmuch as all variables are not first-order, so Johansen test cannot be used in order to Cointegration analysis (long-run relationship). In this case, in order to estimate the long-run relationship and the error correction among involved determinants in the model, ARDL model has been applied.Estimation of ARDL modelLong –run estimationTable-6 shows the results of long-run estimation.Table 6. The results of Long-run estimation (ARDL model)
 |
| |
|
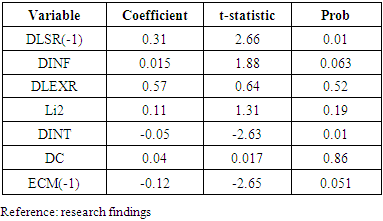
Error correction TestTable-7 shows the results of error correction test.Table 7. The results of error correction test
 |
| |
|
It should be noted that the coefficient of the EC term indicates the speed of adjustment to the long-run equilibrium path. Tables-7 clearly exhibits this coefficient is statistically significant and it has a negative sign. Because ECM has a value between zero and one and also it is statistically significant, the long-run Cointegration relationship between the variables can be approved. The coefficient of EC term is equal to -0.12. It is evident that ECM (-1) which is statistically significant has a value of -0.12 and indicates the speed of adjustment to the long-run equilibrium path. Actually, it means that 12% of variable non-equilibrium can be corrected in the next period.
4. Summary and Conclusions
This study has used ARDL technique in order to evaluation of the short-run and long-run relationships and error correction. At first, Augmented Dicky-Fuller (ADF) was applied to evaluate the stationary time serious. The results obviously show that all variables are I (1) and I (0). Also, it can be conclude that Johansen test cannot be used for investigation of Cointegration (long-run relationship), because all variables are not I (1). In this case, we can use Autoregressive distributed lag (ARDL) and Error Correction test for determination of short-run and long run relationships. In addition, our findings indicate that inflation rate and exchange rate have a positive significant effect on Stock price.Finally, we can conclude that while financial index has a positive significant impact, interest rate has a negative long-run effect on Stock price.
References
| [1] | Pirai, kh. & Shahsavar, Z. (2006). Effect of macro variables on Iran stock Exchange. Journal of Economic Studies, 9, 21-38. |
| [2] | Heidary H & Bashiri S (2012). Evaluation of the relationship between real exchange rate uncertainty and Tehran stock exchange: Evidence from VAR-GARCH model. Journal of Economic Studies, 9, 71-92. |
| [3] | Shaki S & Tofighi H (2012). Effect of exchange rate fluctuations on Iran Stock exchange. |
| [4] | Taheri H et al (2011). Evaluation of the relationship between exchange rate and Tehran stock exchange index using ARDL approach. Journal of Economic Studies, 60, 63-80. |
| [5] | Musai et al, (2010). The relationship between stock market and macroeconomic variables. Journal of Economic Studies, 54, 73-94. |
| [6] | Mirzakhani. H & Choobine. B (2011). The position of stock exchange in resistive economy. |
| [7] | Yahyazadefar et al. (2012). The effect of oil price and revenue shocks on stock’s real return in listed companies of Tehran stock exchange. |
| [8] | Ishfaq A.M. And Rehman R., Raoof A. (2010), "Do Interest Rate, Exchange Rate effect Stock Returns? A Pakistani Perspective", International Research Journal of Finance and Economics, Issue 50. |
| [9] | Li, Y. and Huang L., (2010), "On the Relationship between stock return and exchange rate: evidence on China”, College of Mathematics and Econometrics, Hunan University. |
| [10] | Osamwonyi, I. and Esther Osagie, (2012), “The Relationship between Macroeconomic Variables and Stock Market Index in Nigeria”, J Economics, Vol. 3, No. 1, PP. 55-63. |
| [11] | Parsva, P. and H. Lean, (2011), "The Analysis of Relationship between Stock Prices and Exchange Rates: Evidence from Six Middle Eastern Financial Markets", International Research Journal of Finance and Economics, Issue 66, PP. 157-171. |

 Abstract
 Reference
 Full-Text PDF
 Full-text HTML