-
Paper Information
- Paper Submission
-
Journal Information
- About This Journal
- Editorial Board
- Current Issue
- Archive
- Author Guidelines
- Contact Us
American Journal of Economics
p-ISSN: 2166-4951 e-ISSN: 2166-496X
2017; 7(3): 97-109
doi:10.5923/j.economics.20170703.01

Determinants of Inclusive Growth in Nigeria: An ARDL Approach
 Abstract
 Reference
 Full-Text PDF
 Full-text HTML
Ibukun Cleopatra Oluseye, Aremo Adeleke Gabriel
Department of Economics, Obafemi Awolowo University, Ile-Ife, Nigeria
Correspondence to: Ibukun Cleopatra Oluseye, Department of Economics, Obafemi Awolowo University, Ile-Ife, Nigeria.
| Email: |  |
Copyright © 2017 Scientific & Academic Publishing. All Rights Reserved.
This work is licensed under the Creative Commons Attribution International License (CC BY).
http://creativecommons.org/licenses/by/4.0/

Nigeria is one of the fastest growing economies in the world, yet ranked 152nd out of 188 countries of the world [1]. As such, growth in one sector of the economy does not automatically translate into equal benefits for the populace. This paper therefore provides an empirical analysis of the relationship between inclusive growth and its determinants as studies in this area are limited. Against this backdrop, the study utilized annual data from 1981 till 2014, and employed both the autoregressive distributed lag model (ARDL) and the error correction method (ECM) to investigate the long-run and the short-run parameters among the variables. The findings suggest a negative relationship between government consumption, education expenditure and inclusive growth both in the short-run and the long-run. In contrast, inflation and population growth variable indicate a positive effect on inclusive growth in the short-run but turned out negative in the long-run. Finally, initial capital and FDI showed a negative relationship in the short run, but a significantly positive contribution to inclusive growth in the long-run. Based on these findings, the study recommends that policy makers should take appropriate steps to increase the inflow of foreign direct investment, reduce inflation, while they work at improving the quality of the population in order to achieve inclusive growth.
Keywords: Inclusive growth, Auto-regressive distributed lag, Nigeria
Cite this paper: Ibukun Cleopatra Oluseye, Aremo Adeleke Gabriel, Determinants of Inclusive Growth in Nigeria: An ARDL Approach, American Journal of Economics, Vol. 7 No. 3, 2017, pp. 97-109. doi: 10.5923/j.economics.20170703.01.
Article Outline
1. Introduction
- There is an increasing awareness of inclusive growth among policy makers in many countries, institutions, donors, and non-governmental organizations (NGO) aimed at addressing the deficiencies of prioritizing solely economic growth and ensuring that the benefit of growth is enjoyed by all. Organization for Economic Cooperation and Development [2] defines inclusive growth as a situation where the gap between the rich and the poor is less pronounced and the growth dividend is shared in a fairer way that results in improvements in living standards and outcomes that matter for people’s quality of life (e.g. good health, jobs and skills, clean environment, community support). Several economic factors such as foreign investment, inflation, gross fixed capital formation, real exports, real imports, savings amongst others affect the inclusiveness of growth in a country. However, understanding the determining variables of inclusive growth in Nigeria is a prerequisite to identifying critical areas to direct available resources.Nigeria operates an open economy in which international transactions constitutes an important portion of her aggregate economic activity, while the economic prospects and development rest critically on her international interdependence [3]. The economy’s private sector has played a marginal role in the overall economic system while there exists an apparent domination of employment generation in the public sector. Also, the county’s manufacturing sector has been further weakened by the absence of a broad-based growth in the economy since independence. In an attempt to address these challenges and promote inclusive growth, Nigeria embarked on several development programmes ranging from the International Monetary Fund (IMF), Structural Adjustment Programme (SAP), National Program for the Eradication of Poverty (NAPEP), National Economic Empowerment Development Strategy (NEEDS), the United Nations (UN)- sponsored National Millennium Goals for Nigeria (NMGN), Vision 20:20 among others, but with very minimal result. In response to these policies, Nigeria’s experienced a 7.5% GDP growth (see figure 1) over the last decade making her the 21st largest economy in the world based on the nominal GDP [4]. In the same vein, the depth of poverty and its incidence measured by the poverty gap at $1.25 a day increased from 21.9 percent in 1986 to 33.7 percent in 2010. Therefore, an expanding economy does not necessarily mean that everyone benefits equally from the increased prosperity [5]. As seen in the case of Nigeria, there still exists a high rate and duration of unemployment and underemployment, low human development index which pose a problem to macroeconomic policies, institutional lapses and bottlenecks, public sector in-efficiency, conflicts, structural impediments and economic instability. The juxtaposition of all these is reflected in the persistent low ranking of the country (152nd out of 188) in the world [1]. Recognizing the negative economic, social and political consequences of these trends, it is no longer sufficient to have economic growth year after year, but an inclusive growth which will cater for the vulnerable and reduce insecurity.
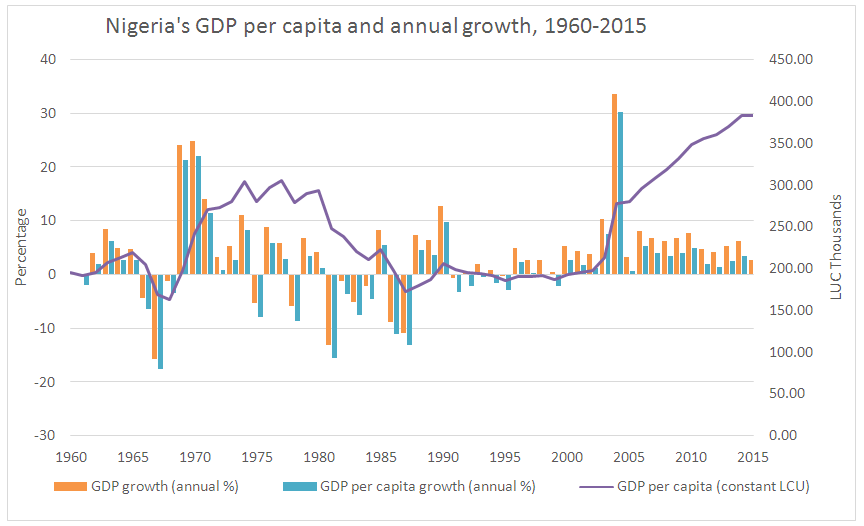 | Source: World Development Index [6] |
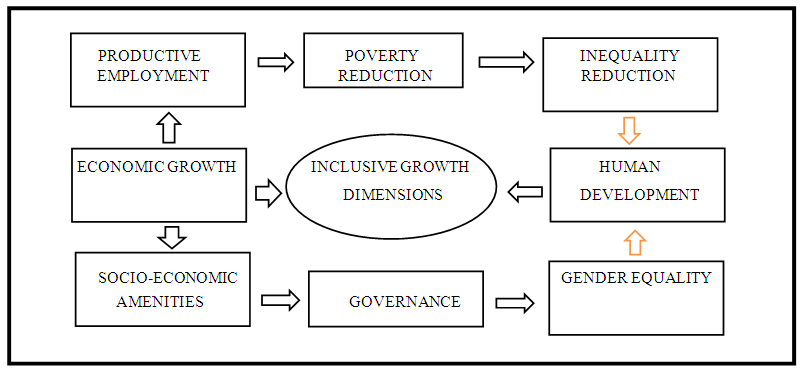 | Figure 1. Theoretical model of inclusive growth by [22] |
2. Literature Review
2.1. Conceptual Issues on Inclusive Growth
- The term ‘inclusive” growth can be traced to [14], and it is often used interchangeably with a suite of other terms, such as ‘broad-based growth’, ‘shared growth’, and ‘pro-poor growth’. In some cases, emphasis is laid on pro-poor growth, aimed at delivering higher income gains for low income groups than the rest of the population which will reduce inequalities in living standards. Another approach lays emphasis on productive employment, such that economic growth can generate jobs to absorb the growing population and ensure that workers reap the benefits of rising productivity. However, development economics is witnessing a paradigm shift from pro-poor growth to inclusive growth [15].Inclusive growth is preferred because shared growth can be misunderstood as implying a focus on income distribution schemes, while broad-based and inclusive growth emphasize on policies that remove constraints to growth and create a level playing field for investment. Therefore, the main difference between inclusive growth and the pro-poor approach is that the pro-poor is mainly interested in the welfare of the poor while inclusive growth is concerned with opportunities for the majority of the labor force, poor and middle-class alike.Several attempts have been made by scholars although it still remains rather ambiguous as a term because there is no universal definition to it [1]. The Asian Development Bank [16] defines inclusive growth beyond the broad-based growth. It is a type of growth that not only create new economic opportunities but also as one that ensures equal access to the opportunities created for all segments of the society, particularly for the poor. The World Bank [17] defines inclusive growth as the pace and pattern of economic growth which are interlinked and assessed together with the aim of reducing absolute poverty. This definition adopts a long-term perspective and it implies a direct link between macro and micro determinants of growth. Also, the International Policy Centre for Inclusive Growth [18] places its emphasis on participation so that in addition to sharing in the benefits of growth, people actively participate in the wealth process and have a say in the orientation of that process.Inclusive growth is growth that not only creates new economic opportunities but also one that ensures equal access to the opportunities created for all segments of society including the disadvantaged and the marginalized [19]. Therefore, inclusive growth is about raising the pace of growth and enlarging the size of the economy, while leveling the playing field for investment and increasing productive employment opportunities [20]. Furthermore [21] illustrated inclusive growth as a situation where the wage rate is higher than per capita income (GDP per capita) and/or economic growth is accompanied by a fall in poverty rate, unemployment and inequality gap. In other words, inclusive economic growth is not only about expanding national economies but also about ensuring that the most vulnerable people of societies are reached.[15] emphasized that faster and sustainable economic growth is a pre-requisite for inclusive growth, while they also identified the theoretical model that exhibits the eight key drivers of inclusive growth in a country. They then emphasized that key inclusive growth drivers such as economic growth should provide basic socio-economic amenities for all, while the government should promote administrative efficiency and ensure gender equality which will enhance human capabilities. Also, productive employment can increase labour productivity which is capable of reducing poverty and substantially reduce income inequality.
2.2. Three Challenges that Record Levels of Growth have Failed to Tackle
- The Organization for Economic Cooperation and Development [2] highlighted the need to address the quality of growth and in particular, improve its inclusiveness. In addition, they identified three problems that the record levels of growth of the 1990s and 2000s failed to tackle, namely: unemployment, poverty and inequality.The Nigerian Case2.2.1. PovertyNigeria’s poverty incidence, measured by the headcount ratio, worsened in all the geo-political zones and sectors (rural and urban) of the country in 2010 with about 112 million Nigerians living below the poverty line. Figure 2.1 reveals that more Nigerians were poor between 1980 and 2010 as 62.6% of Nigerians live in poverty as compared to 27.2 in 1980. Recently, United Nations (UN) report on Nigeria’s Common Country Analysis (CCA) described the country as one of the poorest in the world, with over 80 million of her population living below poverty line. The contribution to poverty tends to be higher in the north than in the south; with northeastern, experiencing the highest poverty rate in the nation.
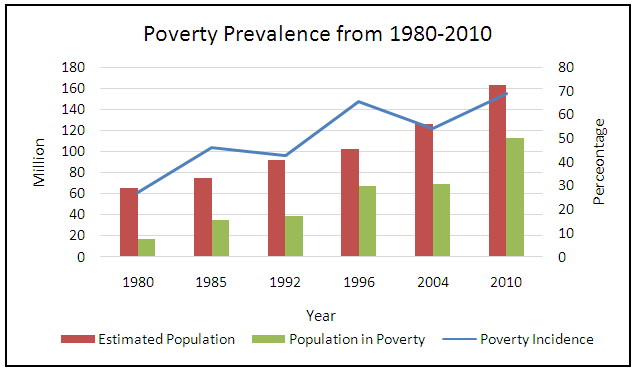 | Figure 2.1. Nigeria’s poverty prevalence. Source: The 2010 Nigeria Poverty Profile Report by [22] |
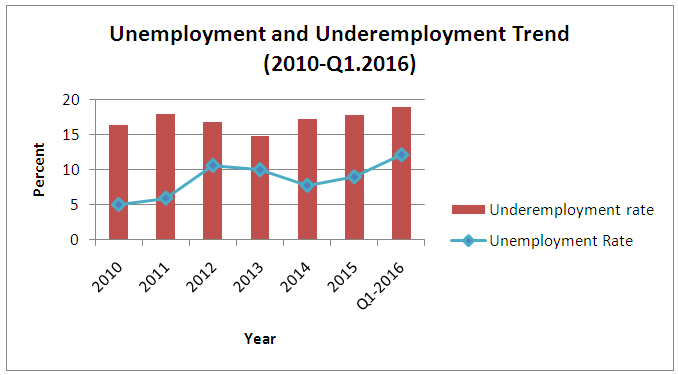 | Figure 2.2. Nigeria’s unemployment and underemployment trend. Source: Authors’ computations based on data from NBS [23] |
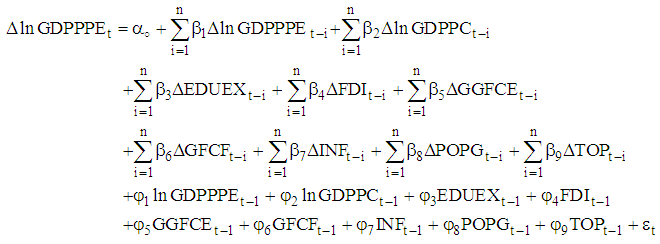
 | Figure 2.3. Nigeria’s Gini Index. Source: World Bank estimate [25] |
2.3. Review of Empirical Literature
- Following the 2008 global economic meltdown, inclusive economic growth has become an issue that continues to be of substantial theoretical and empirical interest in both developed and developing countries. Various studies [26-28] have investigated the importance and benefits of inclusive growth beginning with [29], who pioneered the measurement of inclusive growth through the social opportunity function. Their findings revealed that growth is defined as inclusive if it increases the social opportunity function, which depends on two factors namely; average opportunities available to the population, and how opportunities are shared among the population. In addition to this [19] suggested that a development strategy with inclusive growth as the overarching goal should have two mutually reinforcing strategic anchors: first, high and sustainable growth to create productive and decent employment opportunities; and second, social inclusion to ensure equal access to opportunities.Studies such as [20, 30] pointed out that the rapid pace of growth is unquestionably necessary for substantial poverty reduction but for growth to be sustainable in the long run, it should be broad based across the sectors and inclusive of the large part of the country’s labor force. They also considered that inclusive growth exacerbates in opportunities like health, education, communication & transport, public services, nutrition and sanitation facilities for the destitute segment of the society. Furthermore, [31] reinstated that there is no universal definition of inclusive growth or inclusive development but inclusive growth is accompanied by lower income inequality so that the increment of income accrues disproportionately to those with lower incomes.In 2013, [7] employed a five years’ data set from 1979 to 2010 in analyzing the measurement and determinants of inclusive growth for both emerging markets and low income countries. Their findings revealed that macroeconomic stability, human capital, and structural changes are the foundation for achieving inclusive growth, while the role of technological change emphasized in the literature has a less discernible impact. Adding to these factors, [27] discovered the importance of fiscal policies (increase spending on health, education, and social safety nets) in achieving inclusive growth. They also suggested a need for labor market reforms to boost the labor share of total income; and reforms to make financial systems more inclusive. Furthermore, the findings of [32] opined that social expenditures, spending on education, and educational attainment rates are important for fostering inclusive growth while macro-financial stability, with particular attention to inflation risks, is critical for promoting inclusive growth. [21] however suggested that augmenting health expenditure with natural resource appears to be more significant for making growth process inclusive. Therefore, inclusive growth requires, by definition, both economic growth and inclusion [26].As far as inclusive growth in Nigeria is concerned, [28] utilized a growth diagnostic approach based on the Business Enabling Environment Approach (BEEA) and Employability Analysis Approach (EMPA) in examining the basic constraints to inclusive growth. Their findings identified two broad categories of constraints to inclusive growth in Nigeria, namely: constraints to business environment in Nigeria; and employability challenges of Nigerian graduates. They also discovered that these constraints are directly related to poor physical infrastructure, poor human capital formation, particularly, in the educational system and the inability to transform output growth to job creation. In the same vein, [33] asserted that it is absolutely imperative that government at all levels should promote a broad-based growth that generates productive employment, redistributes income, enhances equity and involves the active participation of the poor if the incidence of poverty is to be reduced in Nigeria. While most of these findings are based only on analysis of correlation coefficients among relevant variables it is widely documented that, despite the rise in economic growth, incomes of the majority of Nigerians have not risen.More recently, [8] examined the role of health and population growth on inclusive growth in 14 African countries (including Nigeria) from 1995 to 2012 adapting the method of [7]. They discovered that population growth decreases the effect of inclusiveness while adequate financing of the health sector is fundamental to improve pro-poor growth in Africa. On the other hand, the study conducted by [11] found a one-way causality through inclusive growth to financial development through financial deepening measure. They also discovered that either a low level or high level of openness on trade and capital investment are desirable for inclusive growth in Nigeria.The foregoing review of empirical studies indicated that recent studies have not provided adequate information in favor of the determinants of inclusive growth in Nigeria. The results of some of the studies show that business environment and employability challenges are constraints to inclusive growth, while others studies in Nigeria have focused on inclusive growth as a means of poverty alleviation and financial development. Therefore, empirical investigation of the determinants of inclusive growth in Nigeria is indeed necessary.
3. Data, Model and Methodology
3.1. Model of Study
- Macroeconomic theory has identified various factors that influence inclusive growth, while scholars such as [7, 8, 21] asserted that these factors include; human capital, population, foreign direct investment, natural resources, trade openness, fixed investment, credit to GDP, government consumption, inflation, GDP volatility, infrastructure quality, REER deviations and many others. Given our desire to account for the determinants of inclusive growth in Nigeria, this study adapts the model of [7] as modified by [11] which is predicated on the social opportunity function.The inclusive growth function which incorporates output growth performance as well as distribution of economic growth is specified as follows;
 | (3.1) |
 indicates inclusive growth, which is measured by the GDP per person employed as a measure of productive employment;
  is the initial level of income;
  is the vector of control variables while
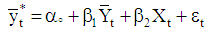
  is the error term. For the purpose of this study, the determinants of inclusive growth considered for Nigeria are initial trade openness (TOP), foreign direct investment (FDI), expenditure on education (EDUEX), gross fixed capital formation (GFCF), population growth (POPG), general government financial consumption expenditure (GGFCE), and inflation (INF) to reflect the internal stability. Therefore, the equation is reformulated as;
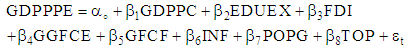 | (3.2) |
3.2. Methodology
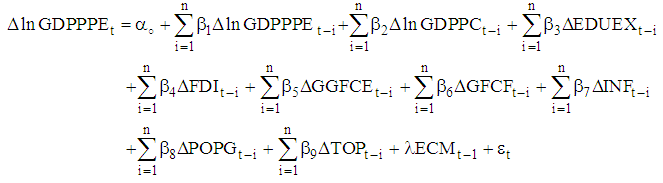
- Autoregressive Distributed Lag (ARDL) Bound Testing Approach Several econometrical methods have been proposed for investigating long-run equilibrium (cointegration) among variables. However, this study utilizes the autoregressive distributed lag (ARDL) modelling approach which was initially proposed by [34]. The main advantage of ARDL modelling lies in its flexibility with small sample study and it can be useful when the variables are of different order of integration.In estimating the long-run relationship, a two-step procedure is utilized. Without having any prior information about the direction of relationship, If the first step predicts that there is a long-run relationship among the variables, the error correction version of ARDL framework [13] pertaining to the variables represented in equation (3.2) is formulated and specified as follows:
 | (3.3) |
 is the first difference operator, and
  is the drift component. The expression with summation sign
  represents the short-run dynamics of the model, while the coefficients
  represents long-run relationship and
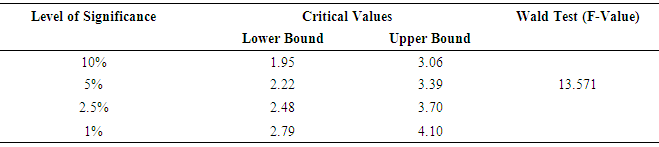
  is the serially uncorrelated disturbance with zero mean and constant variance.In order to investigate the existence of the long-run relationship among the variables in the system, the bound tests approach developed by [13] is employed. This test is based on Wald or F-statistic and follows a non-standard distribution. If the calculated F-statistics is below the lower bound critical value, the null hypothesis of no cointegration
  is accepted. If it is greater than the appropriate upper bound critical values, the null hypothesis is rejected implying cointegration. However, if it lies within the lower and upper bounds, the result becomes inconclusive. In the next step, after establishing the existence of the cointegration between variables, the following long-run model for economic growth can be estimated:
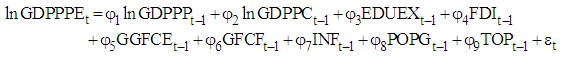 | (3.4) |
 | (3.5) |
 are the short-run parameters and
  is the speed of adjustment parameter which is expected to be less than zero. ECM is the lagged error correction term obtained from the estimated cointegration model of equation (3.5). To establish the stability of the long-run and short-run coefficients, the CUSUM and CUSUMSQ tests to the residuals of equation is applied in order to examine if the two statistics stay within the 5 % significant level.
3.3. Data Sources
- This study is based on the annual time series data covering the period from 1981 till 2014, which comprises 34 data points. The data were obtained from the World Bank, World Development Indicators (WDI, 2016).
4. Empirical Results and Discussion
4.1. Descriptive Statistics
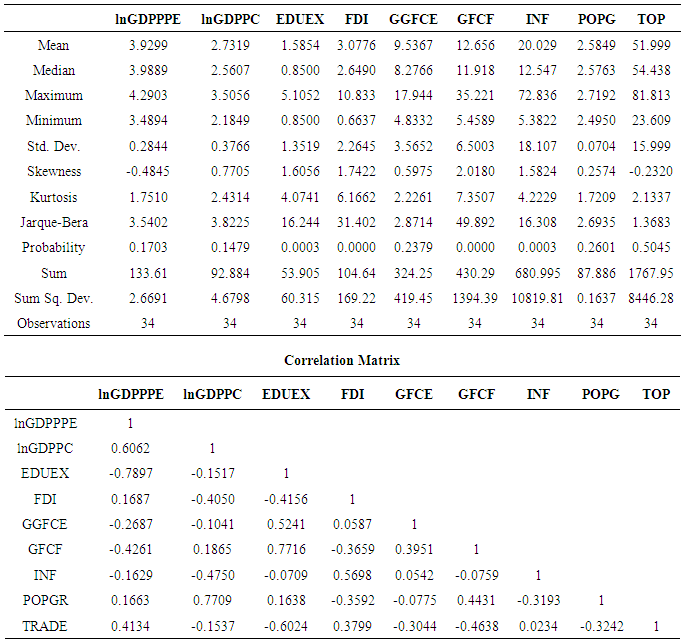
- Logarithmic transformations of variables are very popular in econometrics because many economic time series data exhibit a strong trend and taking the natural logarithm of a series effectively linearizes the exponential trend (if any) [35] Since this paper is dealing with time series data, we preferred to take log of some variables to avoid cumbersomeness in the modelling. The descriptive statistics in Table 1 for variables under consideration revealed that the growth rate of gross domestic product per person employed and initial income per capital are 3.93% and 2.73% respectively. However, the average value for government expenditure on education, foreign direct investment, gross fixed capital formation, government financial consumption, inflation, population growth and trade openness (as a ratio of GDP) are 1.57, 3.08, 9.54, 12.66, 20.03, 2.58 and 51.99 respectively.
|
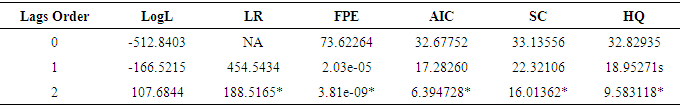
4.2. Stationarity, Lag Length and Bound Test
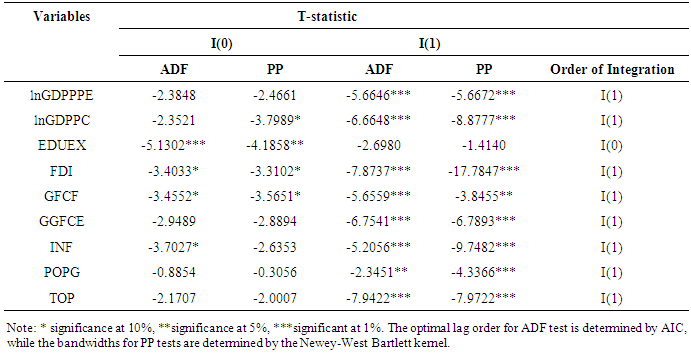
- The use of ARDL models does not impose pre-testing of variables for unit root problems because this estimation can accommodate I(0) and I(1) variables, or mutually cointegrated variables. However, one drawback of the ARDL approach is that it cannot be estimated with I(2) series. Therefore, unit root tests are conducted in this study to find out if there are mixtures in the order of integration of our variables. The presence of a unit root implies that the time series under investigation is non-stationary; while the absence of a unit root shows that the stochastic process is stationary. The order of integration of the time series was investigated by applying the Augmented Dickey and Fuller test and Phillips Perron (PP) test as presented in table 2.
|
 , where p is the maximum number of lag order to be used and k is the number of variables in the equation. As p=2 and k=8, the total number of regressions to be estimated are 6561. Given the existence of a long run relationship, we use ARDL co-integration to estimate the parameters, with a maximum order of 2, to minimize the loss of degrees of freedom.
|
|
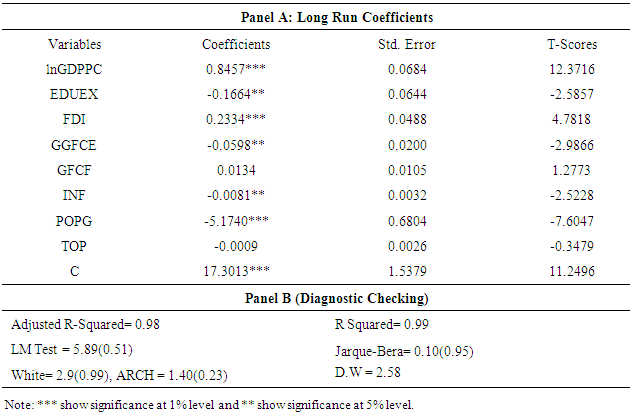
4.3. ARDL Estimation
- In selected long run ARDL (1, 2, 0, 2, 1, 0, 1, 1, 0) model, the maximum lag length is set out by using Schwarz Bayesian Criteria (SBC) and the normalized long run coefficient estimates are reported in Table 5.
|
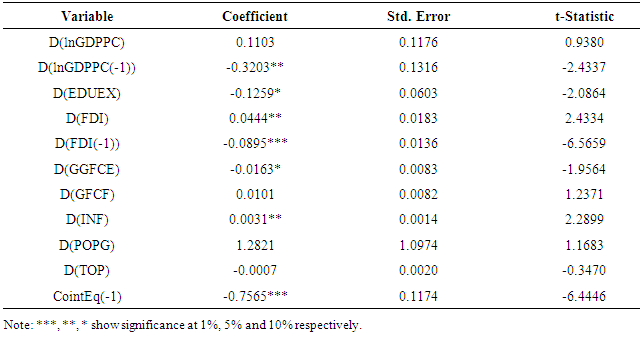
4.4. Short-Run Dynamics
- Table 6 presents the results of the short-run parameters along with that of the error correction term.
|
4.5. Stability Tests
- These results demonstrate that the short-run model passed the diagnostic tests. There is no evidence of autocorrelation at 5% confidence level and that the model passes the test for normality, the error term is also proved to be normally distributed. There is no existence of white heteroscedasticity in the model. For testing the stability of the long-run coefficients alone with the short-run dynamics, the cumulative sum (CUSUM) and the cumulative sum of squares (CUSUMSQ) are applied. A graphical illustration of CUSUM and CUSUMSQ is exposed in Figures 1 and 2. The plots of both the CUSUM and the CUSUMSQ are within the boundaries, and, hence these statistics prove the stability of the long-run coefficients of the repressors that have an effect on inclusive growth in Nigeria. The model appears to be stable and properly specified given that none of the two tests statistics go outside the bounds of the 5 percent level of significance.STABILITY TESTS
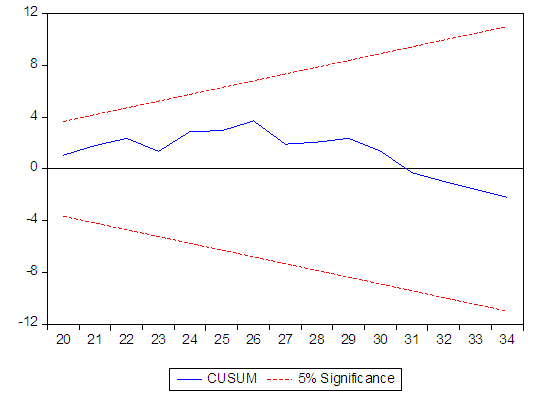 | Figure 1. CUMSUM Test |
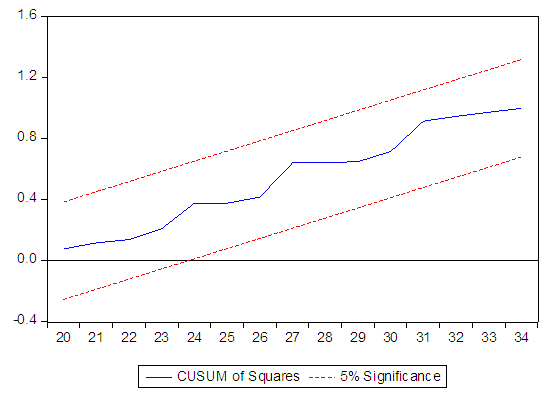 | Figure 2. CUMSUM of squares |
5. Conclusions and Policy Recommendations
- The prospect of having an inclusive growth in Nigeria has caused serious concern to policy- makers, academics, and foreign donor agencies. This paper investigates the determinants of inclusive growth in Nigeria through the application of the autoregressive distributed lag (ARDL) and error correction model (ECM) during the period of 1981-2014. The results from ARDL indicate that there is co-integration between inclusive growth and explanatory variables such as initial income, trade openness, foreign direct investment, government expenditure on education, gross fixed capital formation, population growth, government consumption expenditure, and inflation. The associated equilibrium correction model was also significant, confirming the existence of long-run relationships.After analyzing an over parameterized regression model, a parsimonious result was obtained from sequential reduction judged by SBC. The result of the ECM reveals that initial income, FDI, capital formation, inflation, population growth, expenditure on education and government consumption are determinants of inclusive growth in Nigeria. However, with the exception of the initial income and FDI, the aforementioned variables have negative impacts on the inclusiveness of growth in the long-run, while inflation has a positive effect on growth in the short-run but a negative effect in the long-run. Therefore, the policy implications of our findings are that, government should work at improving macroeconomic stability so as to increase the inflow of FDI, while they also work at reducing the inflation rate by embarking on tight fiscal and monetary policies. Furthermore, in order to maximize the effect of population growth, the government needs to allocate adequate finance aimed at improving the quality of the population (through improvement in health and education), which will bring about innovative and technology advancement needed for growth; and that another decade does not go by in which a rich Nigeria grows richer and the poor do not progress.