-
Paper Information
- Paper Submission
-
Journal Information
- About This Journal
- Editorial Board
- Current Issue
- Archive
- Author Guidelines
- Contact Us
American Journal of Economics
p-ISSN: 2166-4951 e-ISSN: 2166-496X
2016; 6(6): 344-351
doi:10.5923/j.economics.20160606.05

Revealed Comparative Advantage Index: An Analysis of Export Potential of Indian Textiles Industry in the Post MFA Period
 Abstract
 Reference
 Full-Text PDF
 Full-text HTML
Asiya Chaudhary
Aligarh Muslim University, Aligarh, India
Correspondence to: Asiya Chaudhary, Aligarh Muslim University, Aligarh, India.
| Email: |  |
Copyright © 2016 Scientific & Academic Publishing. All Rights Reserved.
This work is licensed under the Creative Commons Attribution International License (CC BY).
http://creativecommons.org/licenses/by/4.0/

India’s textiles sector remains one of the strongest segments of the economy and is amongst the largest contributors to India’s total exports. After the phase out of Multi Fibre Agreement (MFA) in 2005, the textiles exports of all the textiles rich nations improved, including that of India too. The aim of this paper is to analyse and evaluate the export potentials and competitiveness of the Indian textiles in relation to the textiles exports of the world as a whole from 2005 to 2014, which is the period showing highest increase in exports after dismantling of MFA. Revealed Comparative Advantage (RCA) index was used to determine the development of India’s textiles industry. The RCA is used in international economics to calculate export potential and relative advantage or disadvantage of a certain country in certain class of goods or services. The findings show that India’s export potential for textiles have continuously improved in the post MFA period and the industry has strong comparative advantage in terms of total world’s textiles exports. Policies need to be strengthened to meet out the global challenges by Indian textiles exporters after the phase out of MFA.
Keywords: Multi Fibre Agreement (MFA), Revealed Comparative Advantages (RCA), Textiles Exports
Cite this paper: Asiya Chaudhary, Revealed Comparative Advantage Index: An Analysis of Export Potential of Indian Textiles Industry in the Post MFA Period, American Journal of Economics, Vol. 6 No. 6, 2016, pp. 344-351. doi: 10.5923/j.economics.20160606.05.
1. Introduction
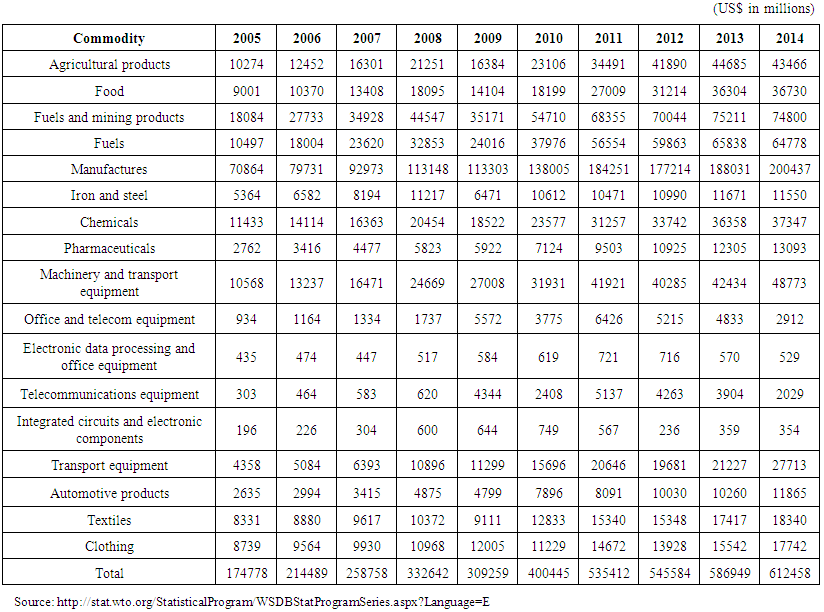
- Introspecting the past two decades, trade all over the globe has multiplied tremendously and has been influenced by many factors like: advancement in information technology, financial crises, growing membership of different alliances and pacts and Global Value Chain (GVC) getting more voguish. As per the report, global trade experienced fairly strong growth from 1995 to 2001, followed by a boom from 2002 to 2008 accompanied by rising commodity prices. Following the financial crisis in 2008, trade fell steeply in 2009 before rebounding strongly in 2010 and 2011. The average share of exports and imports of goods and commercial services in world GDP increased significantly from 20 per cent in 1995 to 30 per cent in 2014 (in value terms). In other words, today’s Gross Domestic Product (GDP) is highly influenced by international trade. (World Trade Organization, 2015)Between 1995 and 2011 (the latest year for which data are available), most developed and developing countries significantly increased their contributions to GVCs, resulting in a geographically more diverse manufacturing base. Lower trade costs and improved communication technology have fostered this development. Some economies expanded their participation in GVCs between 1995 and 2011 by importing more foreign inputs to produce final goods and services (World Trade Organization, 2015). India cannot remain an exception to the prevailing phenomenon of growing world’s trade. The country has exceptionally improved its participation. India’s total exports have gone up from 174778 (US billion $) in 2005 to 612458 (US billion $) in 2014, (World Trade Organization, 2014) i.e. 28.53%, exporting primarily software, petrochemicals, agriculture, leather, jewellery, textiles, engineering goods, etc. (DGCIS, Ministry of Commerce and Industry, Government of India, 2012). India’s total imports stand $609.9 billion, in 2014 (World Trade Organization, 2014).India’s textiles sector remains one of the strongest segments of the economy. Even today, textiles sector is one of the largest contributors to India’s exports with approximately 11 per cent of total exports. The industry realized export earnings worth US$ 41.4 billion in 2014-15, (Ministry of Textiles, 2015), a growth of 5.4 per cent. (Notes: -As per the Cotton Textiles Export Promotion Council (Texprocil),). The dismantling of the MFA gave subsequent boost to textiles exports throughout the world, especially textiles rich nations. India too benefitted and its exports witnessed a record increase over this time when compared to any other period. The paper goes in to examine the developments in export potential of Indian textiles industry after phase out of MFA. Further it also tests the revealed comparative advantage of Indian textiles in world’s textiles trade. The chosen metric for analysis is the Revealed Comparative Advantage (RCA) index. The period taken up for the study is post MFA i. e from 2005 to 2014. The aim of this paper is to evaluate and analyze the export competitiveness of Indian textiles exports in comparison to the textiles exports of the world as a whole from 2005 to 2014.Phase out of MFA and Dynamics of Indian textiles IndustrySince1974, the Multi-Fibre Arrangement (MFA) governed the international textiles and apparel trade. A large portion of textiles and clothing exports from developing countries were subject to bilaterally negotiated quotas. In January 1995 the World Trade Organization (WTO) put into effect a new agreement that replaced the MFA called the Agreement on Textiles and Clothing (ATC). This was a 10-year plan to phase-out the MFA (Multi Fiber Agreement) system of quotas and integrated textiles and garments into the General Agreement on Tariffs and Trade (GATT) rules (Chaudhary, 2011). The ATC, which was preceded by seven years of complex negotiations, was the transitional tool that facilitated quota removal. Once the quota restrictions were over, the products applied to were subject to the WTO’s regular rules of world trade. With the expiry of the ATC on 1 January 2005, global apparel trade was no longer subject to quantitative restrictions (Fukunishi, Goto & Yamagata, n.d).As the MFA phased out, the global apparel and textiles market both expanded in value and consolidated in suppliers. The top ten developing country suppliers now make up 58% of global apparel exports, with Asian suppliers accounting for 52% in 2011 (Fukunishi, Goto & Yamagata, n.d). The scrapping of quotas in world trade of textiles bolstered growth for the sector in India too. In the post quota period, the Indian industry size expanded from $8331 million in 2005 to $9617 million in 2007. It increased to $18340 million in 2014 (WTO databank, 2016). As regards Indian economy, Textiles sector is one of the largest contributors to India’s exports with approximately 11 per cent of total exports. The industry realized export earnings worth US$ 41.4 billion in 2014-15, a growth of 5.4 per cent. (Notes: - As per The Cotton Textiles Export Promotion Council (Texprocil), the textiles sector has witnessed a spurt in investment during the last few years. The industry (including dyed and printed) attracted Foreign Direct Investment (FDI) worth US$ 1.85 billion during April 2000 to March 2016. (India Brand Equity Foundation, n.d)
2. Objectives
- The main objectives of the paper are:To study the Revealed Comparative Advantage Index of Indian textiles exports in relation to the textiles export of the total world.To analyze the development in the export potential of the Indian textiles industry in the last 10 years after the phase out of MFA.Theoretical Framework and Review of Selected LiteratureRecently to measure the export performance has gained quite a momentum. The research techniques in this area are very diverse in terms of methodology and empirical approaches in attempts to draw conclusions regarding export performance (Zou & Stan, 1998). RCA index is one of the attempts towards that. It is based on the Ricardian comparative advantage concept. (Wikipedia RCA, n.d). Another variation of the RCA index is the model suggested by donges and Riedel (donges and Riedel. “the expansion of manufactured exports in developing countries: an empirical assessment of supply and demand issues”, 58-87) (RCA Indices, n.d) where both export and import is included. The RCA index suggested by Bowen (Bowen. “on the theoretical interpretation of indices of trade intensity and revealed comparative advantage”, 464-472) (RCA Indices, n.d) considers the production of a particular country and net trade (i.e. production minus consumption). The RCA indices suggested by vollrath (vollrath. “a theoretical evaluation of alternative trade intensity measures of revealed comparative advantage.” 265-280) (RCA Indices, n.d) measure exports and imports in relation to the rest of the world (hishamunda, Junning & pingsung, “Assessment of comparative advantage in aquaculture: framework and application on selected species in developing countries”, 69).Some of the works published in this area are the “ Revealed Comparative Advantage: An Analysis for India and China” by Amita Batra and Zeba Khan, (Batra & Khan, 2005); “Revealed comparative advantage and competitiveness in services: A study with special emphasis on developing countries”, by (Seyoum, 2007); “Empirical Analysis of Agricultural Exports Competitive of Henan Province” (Springer Link, 2015); “Determinants of revealed comparative advantages: the case of cheese trade in the european union” (Balogh & Jámbor, n.d.); “Uganda’s Revealed comparative advantage in comesa” by miriam Katunze and annette Kuteesa; (Katunze & Kuteesa 2016); “Revealed Comparative Advantage Index: An Analysis of Export Trade in the Austrian District of Burgenland” by Doris Granabetter (Granabetter, 2016).
3. Methodology
- A quantitative, descriptive approach is adopted under the study. For the purpose of analysis, data and information collected during course of the study is obtained from secondary sources. All data is collected from WTO databank. The study used data of Total Textiles Exports from India for past 10 years (2005 to 2014), Total Exports of all commodities from India, Total Textiles Exports of the World and Total Exports of all commodities of the World. The study used data for 17 broad categories of products as total exports from India as well as from world. This was done with the aim to improve readability of the paper. All data is taken for the period of 10 years i.e. 2005 to 2014. This period was taken because the textiles exports witnessed a boost after the MFA phased out in 2005 throughout the globe. The relevant figures for 2015 were not available at the time of the analysis and are not reported here. The data shall be analyzed with the help of accounting tool’ Revealed Comparative Advantage’. It is an index used in international economics for calculating the relative advantage or disadvantage of a certain country in a certain class of goods or services as evidenced by trade flows. It is based on the Ricardian comparative advantage concept (Wikipedia RCA, n.d). It is used in international economics to calculate the relative advantage or disadvantage of a certain country in a certain class of goods or services. Measures of revealed comparative advantage (RCA) have been used to help assess a country’s export potential. The RCA indicates whether a country is in the process of extending the products in which it has a trade potential, as opposed to situations in which the number of products that can be competitively exported is static(Trade Indicators, n.d).RCA most commonly refers to an index introduced by Béla Balassa (1965):
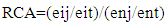 where:
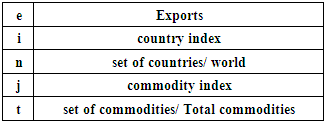 A comparative advantage is “Revealed” if RCA>1. If RCA is less than unity, the country is said to have a comparative disadvantage in the commodity or industry. (Wikipedia RCA, n.d)For the study abbreviations used for data in the above equation are as:ITEW - India Textiles Export to World (eij)IAEW - India All Commodity Export to World (eit)WTEW- World Textile Export to World (enj) WAEW - World All commodity Export to World (ent)The following postulates were framed in order to verify and accomplish the objectives of the paper:India has a revealed comparative advantage in textiles exports over the total textiles exports of the world.The export potential of the Indian textiles industry has continued to develop over the last 10 years after the phase out of MFA.
4. Study Results
- The calculation of the RCA index was carried out by applying the data of Indian textiles exports and World textiles exports. Considering the export data, it is particularly striking those textiles exports have continued to grow throughout the selected period. It can be observed that there has been an enormous increase in exports of the total commodity from India in the past 10 years, as shown in graph 2. The total exports have gone from 174778 to 612458 i.e an overall increase by 250.42% from 2005 to 2014.In all the above set of data it is observed that world exports as well as Indian exports were improving since 2005 but a dip can be observed in exports throughout the world from 2008 onwards. It was due to clutches of global recession that impacted the world trade during that period. By 2010 things started to improve. The table 1 reveals that there is a tremendous increase in the textiles exports after the phase out of MFA. It has gone up from $8331 million to $18340 million, i.e. by 120.14%, almost double in next 10 years. On the other hand there was an enormous increase in exports of the total commodity from India, as shown in graph 2. The total exports have gone up by 250.42% from 2005 to 2014. It is also been observed that the ratio of Indian textiles exports to Indian total commodity exports have subsequently dropped with the years, signifying that the textiles exports have increased in a proportion less than total commodity exports from India. This is clearly visible in column 7 of Table 5 and represented in graph 5.The table 3 exposes that the textiles exports from world has gone up by 54.73%, i.e. from $202970 million in 2005 to $314075 million in 2014. The ratio of world textiles exports to world total commodity exports have also dropped slightly during this period. In order to achieve the objectives of the paper, the postulates were verified with the help of RCA index which is computed below in table 5.
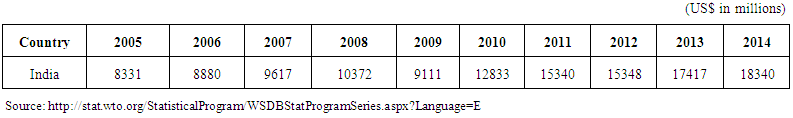 | Table 1. India Textiles Export to World (ITEW) 2005-2014 |
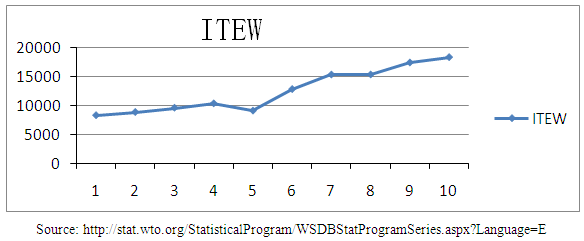 | Graph 1. India Textiles Export to World (ITEW) 2005-2014 |
 | Table 2. India All Commodities Export to World (IAEW) 2005-2014 |
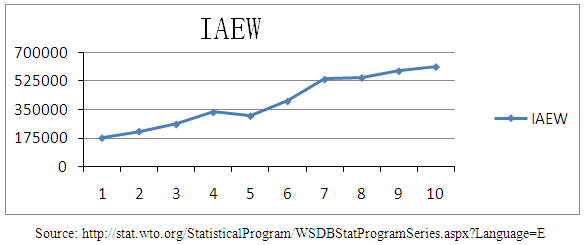 | Graph 2. India All Commodities Export to World (IAEW) 2005-2014 |
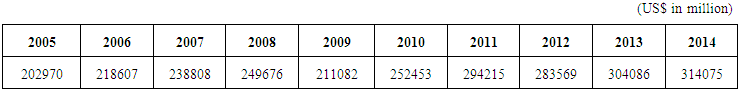 | Table 3. World Textile Export to World (WTEW) 2005-2014 |
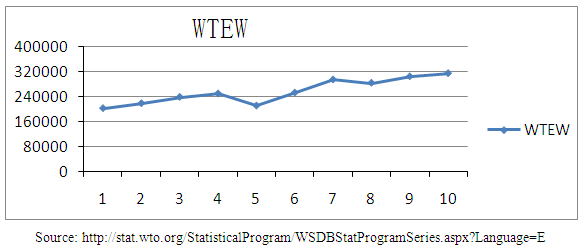 | Graph 3. World Textile Export to World (WTEW) 2005-2014 |
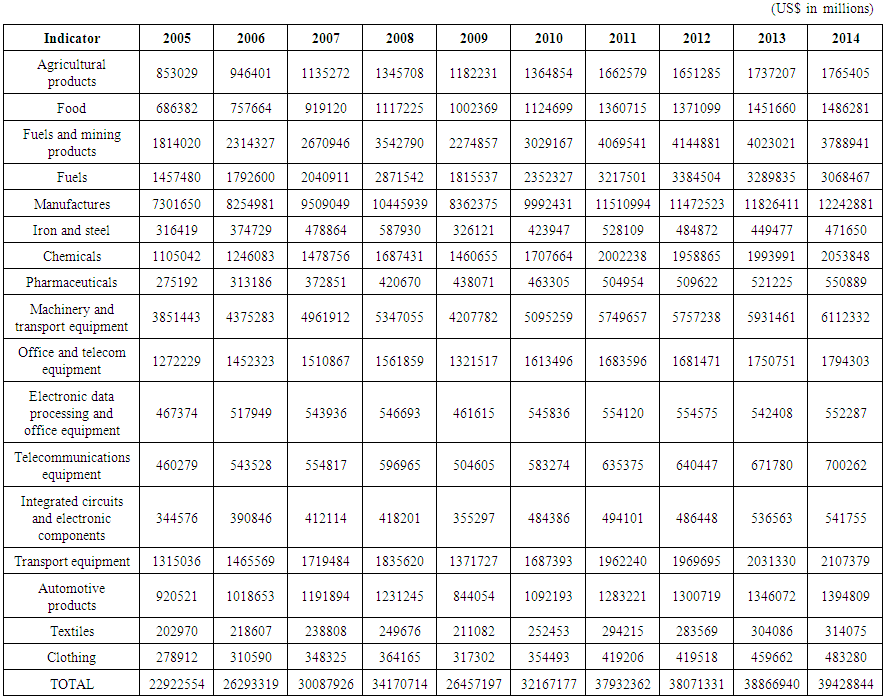 | Table 4. World All commodity Export to World (WAEW) - 2005-2014 |
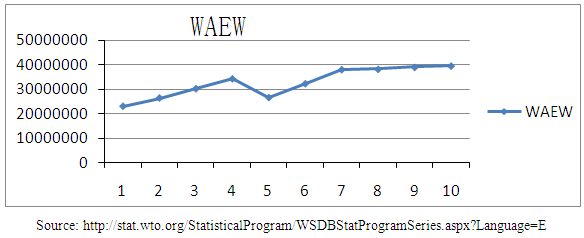 | Graph 4. World All commodity Export to World (WAEW) - 2005-2014 |
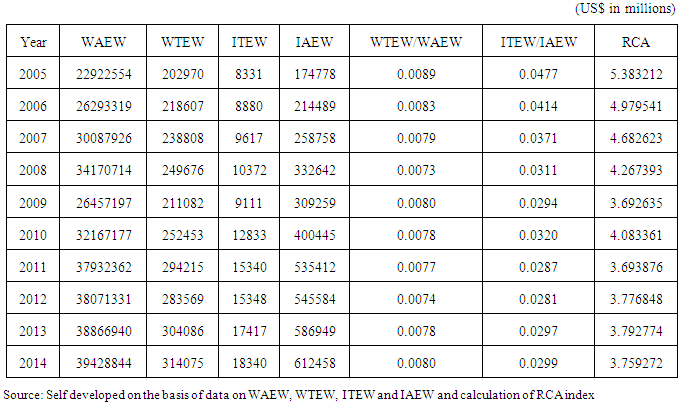 | Table 5. RCA index |
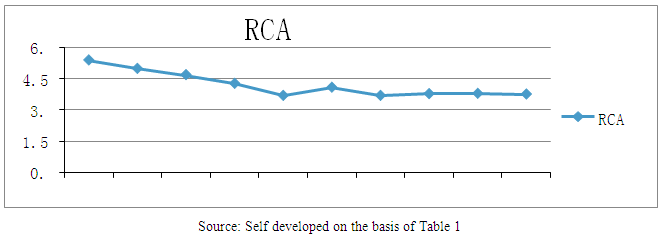 | Graph 5. RCA index |
5. Findings and Discussion
- 1. The first objective of the paper is achieved by applying the RCA index. The results are based on RCA index and comparing it to the standard value 1. During the selected study period i.e. from 2005-2014, the value of RCA remains more than one continuously. The RCA index remains between 5.383 and 3.792 (>1). This signifies that Indian textiles exports have strong comparative advantage in relation to world’s textiles exports. Hence the first postulate: India has a revealed comparative advantage in textiles exports to the total textiles exports of the world, is verified and positively confirms the first objective of the paper.2. The second objective is achieved by doing the trend analysis of the above computed (table 5) RCA index. These values were further placed on graph 5. On computing the RCA index in table 1, it was discovered that the RCA index has subsequently fell under the study period till 2009, later on it improved and remained constant till 2014. It was 5.383 in 2005 and gradually moved down to 3.759. The graph displays an overall downward trend in the RCA index. This signifies that the potential for exports of textiles in India is very strong over the world’s textiles exports but the ratio consistently fluctuated under the study period. This is due to the reason that though textiles exports increased during the selected decade by 120% but the total exports increased by almost at double rate i.e. 250%. Dismantling of MFA has proved to be a booster to the Indian textiles Industry. Hence, the second postulate: The export potential of the Indian textiles industry has continued to develop in the last 10 years after the phase out of MFA, is verified and confirms the second objective of the research paper. 3. It may be concluded that the comparative advantage of Indian textiles exports is ‘Revealed’ in relation to that of the world. The industry stands strongly second after China in the world. Secondly, though the export potential (capacity to export) of Indian textiles has strengthened in the post MFA period but it has been fluctuating downwards due to an overall improvement in the world’s trade in total.Liberalization in India and the scrapping of quotas in world trade of textiles and clothing has bolstered growth for the sector. In the post quota period, the industry size expanded. The exports have been ever increasing with major developments after 2004-05. The favorable impact of the MFA phase out can clearly be seen here.With quotas having been removed and globalization in full swing, the market is now exposed to global competition. Indian manufacturers and exporters now are competing with the global players and also facing emerging tariff and non-tariff barriers. Below are discussed some important reasons for growth and improvement of the industry’s exports: After the dismantling of MFA, the government of India adopted various steps to promote the industry further. Several reductions were introduced in customs and excise duties, tax incentives were made available to exporters, subsidies in land cost, raw material etc. were provided. Apart from fiscal exemptions and deductions, each state in India offers additional incentives for industrial projects. Some of the states also have separate special policies for the textiles sector. Further schemes are specially designed for promoting textiles exports, for e.g. Export Promotion Capital Goods Scheme (PCGS), Duty Exemption & Remission Scheme, Merchandise Exports from India Scheme (MEIS), etc. Further there are sector policies such as: Technology Up gradation Fund Scheme, Scheme for Integrated Textile Parks, Integrated Processing Development Scheme, and Integrated Skill Development Scheme. To meet new market demands for "fast fashion", marked by rapid shipments, higher quality requirements and low-retail inventories, value chains in the sector are undergoing profound re-configuration. This re-configuration has put a premium on shorter delivery cycles, improvements in factory skills and supply chain management. Global value chains (GVCs) are increasingly playing a leading role in production and trade for international markets. Firms from developing countries are establishing themselves in apparel value chains through labor-intensive functions of relatively low knowledge intensity. (Fukunishi, Goto & Yamagata, n.d) and India is no exception. In 1990, West Europe, North America, East Asia, South America and South East Asia together produced 85 per cent of the world total value added of textiles and wearing apparel production. In 2011, the relative importance of North America and West Europe in global textile and apparel production declined. The decrease in their shares of Global Value Added was offset by the increase in shares in East Asia, South and South East Asia and South America. Thus, the sum of the five region’s global value added shares (North America, West Europe, East Asia, South and South East Asia and South America) did not change from 1990 and 2011. (Global Value Chains and development UNIDO’s support towards inclusive and sustainable industrial development, report by UNIDO) although the five region’s value added shares remained unchanged (85 per cent), the textile and apparel industry became more globalised in the sense that a number of regions increasingly began to integrate into global production chains (as indicated by the increase in value added shared derived from intermediate exports), which accounted for a higher share in the total value added of many regions, especially developing regions, in 2011 relative to 1990.( UNIDO estimations based on eoram Rio database). Indian textiles exporters too participated and contributed to the GVC and benefitted.With the economic crisis, faltering import demand and growing export competition, a major shift in end markets has been taking place. Domestic markets in developing countries have recently become more attractive. Markets in China and India, in particular, are large and characterized by rising spending power by a growing and more affluent middle class. Producers in developing countries are finding that they can even generate bigger margins in their domestic markets than in their export markets, where they face intense pressure from buyers to cut prices. In emerging and developing countries, demand for textiles and apparel products is increasing at an even higher rate than economic growth. The fastest growth in apparel retail demand has been registered in China, Russia, India, Turkey and Brazil. In 2011, intra-Asian textiles trade and clothing trade rose significantly, by 18.3% and 22.8%, respectively (Textile Outlook International, 2013). This is another reason for the boost up in Indian textiles exports towards the diversified intra- Asian Markets.A comparative assessment of Indian textiles exports vis-à-vis that of total world exports point out to the following challenges:Though Indian government has introduced various policies and measures as mentioned above to strengthen the industry, these have not generated astounding results as in other textiles rich countries. The first reason being the existence of traditionally distorted industrial structure. Still there is a dominance of small scale units largely in unorganized sector. They remain deprived of economies of large scale. Secondly, In spite of fiscal exemptions, schemes are not as liberal and incentives not as heavy as in other countries. Due to still restricted policies, FDI inflow is not as buoyant as it should have been. India is not the most preferred choice for major global textile players due to rigid labor laws (making it difficult to hire and fire workers) and relatively poor infrastructure. The biggest problem faced by Indian firms is that of rising cost of raw material, manpower and technology. There is very limited investment in R&D in textiles industry.Despite these existing shortcomings in the industry, it possesses several inherent strengths that make it competitively strong on global front, standing second to China. As the export potential of the industry is continuously developing, Government of the country needs to intensify policies to additionally endorse a more conducive environment for textiles exporters.