Mina Mahmoudi, Federico Guerrero
Economics Department, College of Business, University of Nevada, Reno, USA
Correspondence to: Mina Mahmoudi, Economics Department, College of Business, University of Nevada, Reno, USA.
| Email: |  |
Copyright © 2016 Scientific & Academic Publishing. All Rights Reserved.
This work is licensed under the Creative Commons Attribution International License (CC BY).
http://creativecommons.org/licenses/by/4.0/

Abstract
This study investigates the direction and magnitude of the financial links between the European stock markets and the U.S. stock market before, during, and after the stock market crash of 2008, with an emphasis on the Central European countries. Our dataset consists of daily data for the S&P 500 and the EURO STOXX 50 indexes from January 2000 to May 2013, and also a new index which has been defined to measure the Central European countries stock market prices. The results show that there is an immediate response of the European markets to a price change in the U.S. stock market while the reverse relationship takes longer to develop. After the financial crisis, the bilateral relationship happens in a shorter period of time. We show that although the Central European stock markets are segmented from the U.S. market before the crisis, they become linked during the crisis and stay connected even after the crisis. Also, the quantitative results of the study show a significantly higher impact of the U.S. stock market on the Europe stock markets during the recent financial crisis, while this effect is decreasing after the crisis.
Keywords:
Financial links, Stock market, 2008 crisis, the U.S., Europe
Cite this paper: Mina Mahmoudi, Federico Guerrero, The Transmission of the US Stock Market Crash of 2008 to the European Stock Markets: An Applied Time Series Investigation, American Journal of Economics, Vol. 6 No. 4, 2016, pp. 216-225. doi: 10.5923/j.economics.20160604.04.
1. Introduction
The Global Financial Crisis emerged by the bursting of the housing bubble which was followed by the banking crisis and led to a great recession in 2009. On September 15, 2008, Lehman Brothers, the fourth largest U.S. investment bank, collapsed and the stock markets tumbled in reaction to Lehman's failure. The S&P 500 price index lost 4.71% of its value which caused the stock markets in Europe to drop sharply as well (BBC News, 2008). At the same time, public debt problems spread out to many members of the European area and limited the ability of the European leaders to respond to the crisis. The relationship of the stock markets in different countries, particularly the transmission of price shocks, has long attracted attention among economists, policymakers, and fund managers. The behavior of stock markets and the similarity of the price transmissions in different stock markets during the crisis can have important implications for asset pricing and portfolio allocation through using the diversification benefits of less financially linked markets.The specific goal of this study is to examine the direction and magnitude of the financial links between the European stock markets and the U.S. stock market during the recent financial crisis. For this purpose, we use three different sample periods namely before crisis, during crisis, and after crisis periods. There is particular emphasis on the Central European countries which are recognized to be mostly segmented before the financial crises and have larger and more effective stock markets among European countries.Considering the direction of the financial links as a goal of this study, the general idea based on the “World Systems Theory1” is that the core countries’ markets tend to have more control over other financial markets. Based on this theory, the productivity dominance of the core countries can cause trade dominance which may lead to financial dominance over the periphery and semi-periphery countries (Wallerstein, 1980). According to Dunn, Kawana and Brewer (2000) and also Babones and Alvarez-Rivadulla (2007), the United States is considered as one of the most important core countries, while some of the countries in the Europe are considered as core and some as periphery. Therefore, the general thought based on the World Systems Theory is that the U.S. financial market tend to have more control over the European financial markets. However, this may not be the full story. It is conceivable that both through international trade links (see Eichengreen & O’Rourke, 2010) and widespread European debt problems, a feedback loop may have developed as to produce reverse causality from periphery to the core countries. This is what our paper investigates.One contribution of our study is that the data that we use, allow us to estimate when the financial crisis started in the U.S. and the Europe area by affecting their stock markets. Using several Chow tests, we present the break points in our data, which show the start and end of the crisis, are summer 2006 and the end of 2009, respectively. We show that there is an immediate response of the European markets to a price change in the U.S. stock market while the reverse relationship takes longer to develop. Also, we show that the bilateral relationship happens in a shorter period of time after the financial crisis and there is a significantly higher impact of the U.S. stock market on the European stock markets during the recent financial crisis, while this effect is decreasing after the crisis.The rest of the paper is organized as follows. In the next section, we present relevant previous work. Section 3 describes the data including the price index which is built for the Central European countries and the methodology of the study. Section 4 reports the empirical results of the qualitative tests including the Granger causality test results. Section 5 provides the empirical results of the quantitative tests including both the variance decomposition analysis results and the impulse response analysis results. Finally, a summary is provided in section 6 together with a discussion of the results.
2. Literature Review
During the last several years, scholars have used different methods to examine the relationships between the stock markets of different countries during financial crises. Several studies have found that the magnitude of financial links between stock markets tends to be higher in times of crisis (Yang, Kolari, and Min, 2003; Yang, Hsiao, Li, and Wang, 2006), and also the contagion effect tends to run to smaller economies from larger economies (Breuss, 2011; Karunanayake, Valadkhani, and O’Brien, 2010; Kenourgiosa, Samitasb, and Paltalidis, 2011). Yang, Kolari, and Min (2003) showed higher integration of ten Asian emerging stock markets during and after the 1997-98 Asian financial crisis than before the crisis. Similarly, Yang, Hsiao, Li, and Wang (2006) demonstrated the integration of four major Eastern European emerging stock markets during the 1998 Russian financial crisis.Nikkinen, Piljak, and Aijo (2011) presented the evidence that three emerging stock markets in the Baltic region were segmented before the financial crisis of 2008-09, but they were highly linked to each other during the crisis. Using Granger causality tests and vector autoregressive analysis (VAR), they also showed that a large proportion of the forecast variance of the emerging stock markets can be explained by the developed European stock markets during the crisis. Similarly, Karunanayake, Valadkhani, and O’Brien (2010) used a multivariate DVECH model to examine the volatility transmission between Australia, Singapore, the UK, and the U.S. stock markets focusing on the Asian and global financial crises of 1997-98 and 2008-09. They found that both crises increased the stock return volatilities significantly across all of the four markets, and also that the U.S. stock market was the most crucial market impacting the volatilities of smaller economies.Furthermore, Kenourgiosa, Samitasb, and Paltalidis (2011) used both a multivariate regime-switching Gaussian copula model and the asymmetric generalized dynamic conditional correlation (AG-DCC) approach, to capture non-linear correlation dynamics in four emerging equity markets (Brazil, Russia, India and China) and two developed markets (the U.S. and the UK) for recent financial crises during 1995–2006. Their results confirmed a contagion effect from the crisis country to all others, for each of the examined financial crises. Also, Wen, Wei, and Huang (2011) used the same copula method to measure the contagion between energy and stock markets of China and the U.S. during the financial crisis. They found a significantly increasing dependence between crude oil and stock markets during the financial crisis, thus supporting the existence of contagion, and also the contagion effect was found to be much weaker for China than for the U.S.A recent interesting study by Kotkatvuori-Örnberg, Nikkinen, and Äijö (2013) applied dynamic conditional correlation method to the data from 50 equity markets to examine the effect of 2008-09 financial crisis on stock market correlations considering two significant banking events _ JP Morgan's acquisition of Bear Stearns and the Lehman Brothers' collapse. The results of this study showed a significant increase in the correlations of international stock markets by the Lehman Brothers' collapse, whereas the acquisition of Bear Stearns had negligible effects on global stock market interdependence.This paper examines the direction and magnitude of the financial links between the European stock markets and the U.S. stock market during the 2008-09 financial crisis, with an emphasis on the Central European countries. The next section presents the data including the price index which is built for the Central European countries and the methodology of the study.
3. Data & Methodology
The data used consists of: the EURO STOXX 50 index for Eurozone stocks, which is made up of fifty of the largest and most liquid European stocks; the S&P 500 index or the Standard & Poor's 500 for the U.S. stock market, which can be considered as one of the best representations of the U.S. stock market as it is based on the stocks of 500 large companies listed on the NYSE or NASDAQ; and also a price index that is built for the Central European countries which we call it the CE index. The CE index consists of different stock price indexes for the Central European countries including Germany (GDAXI), Switzerland (SSMI), Poland (PTX.VI), Hungary (BUX), Austria (ATX), Slovakia (SAX), Slovenia (SBITOP) and the Czech Republic (PX). In order to build the CE index, we first normalize the price indexes so the last date for our data, which is May 31st, 2013, is given the value of 100. Then, based on the turnover ratio of the stocks traded in each country from the year 2000 to 2012 (the total value of shares traded during the period divided by the average market capitalization for the period; World Bank, 2013), an index weight is given to each country (Germany gets the highest weight between these 8 countries with 27.7% following by Switzerland with 19.8%) and a weighted average method is used to calculate a single stock price index for Central Europe.We use daily data from January 2000 to May 2013, consisting of 3500 observations, both in price index level and return. Although most studies on the financial markets use return data for their analysis, we use the price index data first due to the fact that individuals acting in the stock markets are usually looking at the price charts and not the returns, thus making the price data a more reliable behavioral variable. However, we present the results of the return data as a robustness check. In order to calculate the return of the price index, we follow the Ding, Granger and Engle (1993) method, which defines the compounded return of a price index  as:
as:  where
where  is the price index at time t.Three periods of time are used in this study: before crisis, during crisis, and after crisis. For the before crisis period we use the data from January 2000 to June 2006, for the during-crisis period July 2006 to December 2009, and for the after-crisis period January 2010 to May 2013. Chow test was applied to check if there are structural breaks occurring during the specified periods, indicating that our choices are reasonable. This simply tests for the presence of structural breaks by checking if the coefficients of two linear regressions on different time series are equal or not. The break points ultimately chosen were selected after also running the Chow test for other alternative break points. The results of this test is presented in section 3.Figures 1, 2 and 3 show the changes in the U.S., Europe and Central Europe stock market price indexes from the year 2000 to May 2013. As can be seen, stock market prices follow a similar pattern in the U.S. and Europe especially before and during the crisis. For all three of the stock market price indexes, there is an upward trend at the start of the crisis period followed by a crash during the last months of 2008 and the start of 2009. Point A is not considered as the start of crisis because it is happening in years 2002-2003 which is not in our interest and also this period does not contain the global trough. Point B is not only a break in the price series according to the Chow test, but it also provides an early warning indicate of the impending crash, something that point C does not. In other words, B has predictive value as a break point while C does not. Finally, the end of the crisis is considered to be point E which shows a return to the midpoint value of ≈1100, which could be considered a return to normality. Point D, on the other hand, is the global trough, but the price series has not yet returned to a normal value.
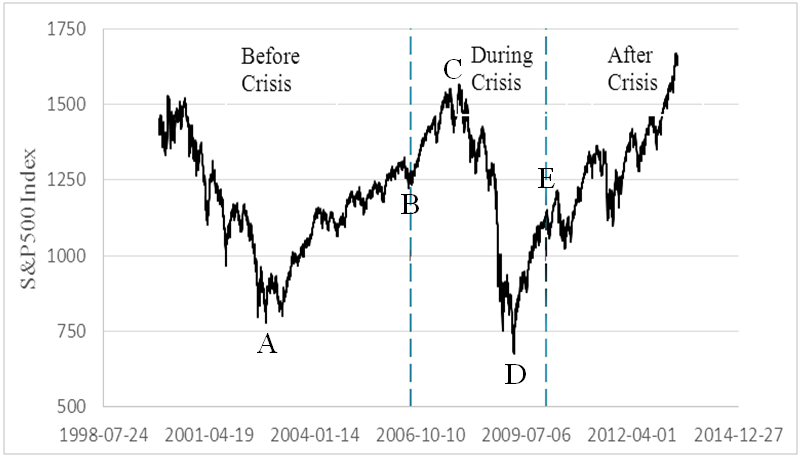 | Figure 1. The U.S. stock market price index |
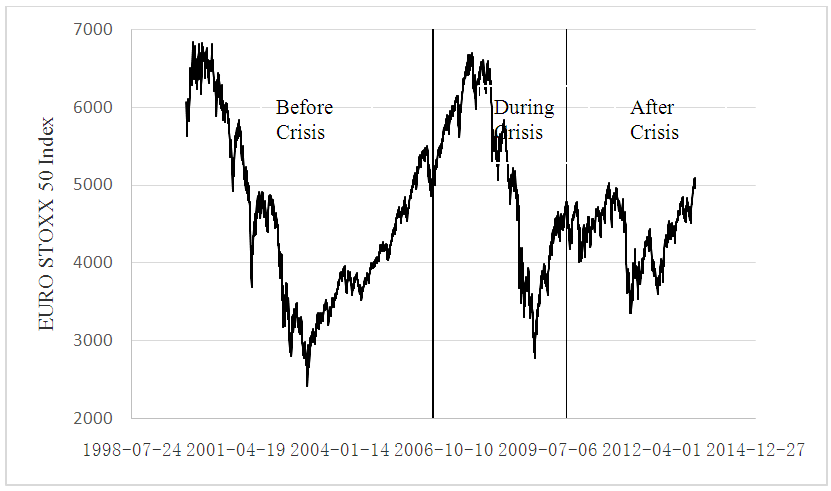 | Figure 2. The Europe stock market price index |
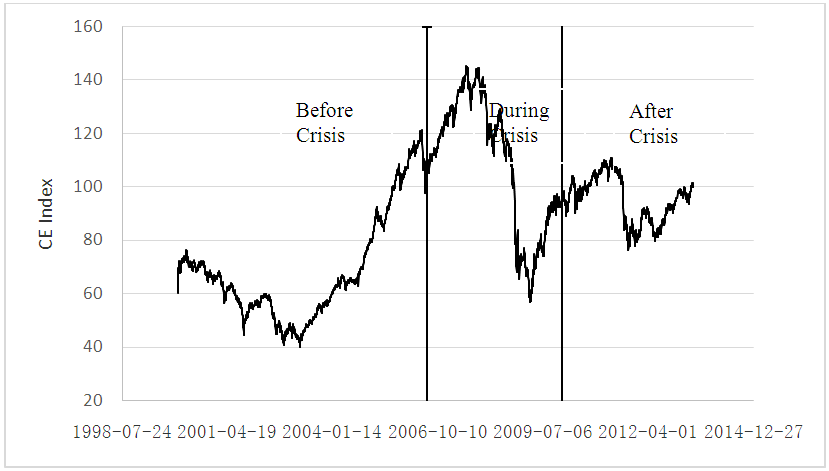 | Figure 3. The Central Europe stock market price index |
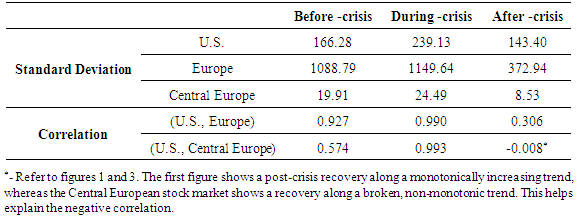
In table 1 below, we see that the volatilities of the stock prices, measured by standard deviations, increase for all stock markets during the crisis, and decrease significantly after the crisis. Also, the calculated correlation of the data shows that the Central European stock markets are more segmented from the U.S. stock market before the crisis, while the correlation of their prices are significantly increasing during the crisis.2Table 1. Correlation and standard deviation of the data
 |
| |
|
The first step in our study is to use Granger causality tests to determine which stock index forecasts the other. We say a time series data on S&P 500 Granger-causes a time series of EURO STOXX 50 if it can be shown that those S&P 500 values provide statistically significant information about future values of EURO STOXX 50. The point here is to test if the U.S. stock prices cause the changes in the Europe stock prices or vice versa. We also want to determine if bilateral causation exists, and if so, at what lag length it occurs. In order to use the Granger causality tests, we need to know if our variables are stationary or not. There are several tests that can be used for this purpose. In general, the Augmented Dicky Fuller (ADF) and Philips Peron (PP) tests have low power against near unit root processes, meaning they cannot predict accurately whether the I(0) alternatives that are close to being I(1) are stationary or non-stationary. Also, the power of unit root tests decreases by including a constant and a trend in the test regression, rather than only including a constant. It may be useful to do a cross check by using a test with a non-stationary null hypothesis such as ADF together with a test with a stationary null hypothesis such as KPSS. In this study, we use the recent test suggested by Elliot, Rothenberg, and Stock (1996) because it is more powerful than the alternatives. In the context of non-stationary data, the Granger causality test statistic does not follow its standard asymptotic chi-square distribution under the null. Therefore, we use the Toda-Yamamoto (1995) approach which is applicable whether the VAR is trend stationary, integrated or co-integrated of an arbitrary order. In the Toda-Yamamoto Granger causality procedure, first we consider the maximum order of integration that we suspect might occur for the group of time series to be  On the second step, determining a lag length
  we estimate a
  order VAR. The important point here is that we do not include the coefficient matrices of the extra
  lagged vectors in the model, since they are used just to follow the standard asymptotic theory. Therefore, we include the extra lags as exogenous variables to the model and test the restrictions only on the first
  coefficient matrices (Toda & Yamamoto, 1995). The next step in our study is to check the quantitative impacts of the U.S. stock market crash of 2008 on the European stock markets. The variance decomposition is used once VAR models are fitted in order to indicate the amount of information each variable contributes to the other variables in our regression. Also, the impulse response function of the model is a good instrument to analyze the dynamic effects of the system when the model receives a shock. The aim here is to see the persistence of the effect during the time by using the impulse responses.
4. Qualitative Results on Shocks’ Transmission
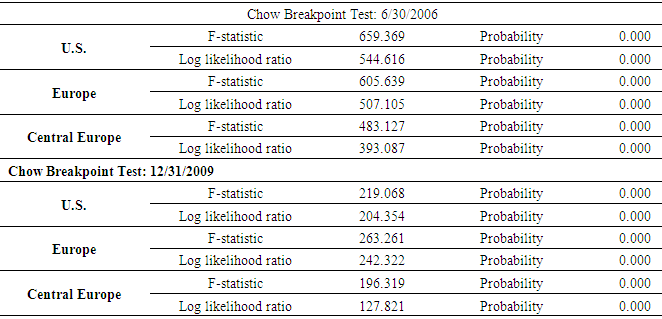
In the first step, we use the Chow test to see if we have chosen reasonable break points. The break points ultimately chosen were selected after also running the Chow test for other alternative break points. Table 2 presents the results of this test on the stock markets price indexes. The null hypothesis in this test is that there is no structural break, and based on p-values, we can reject the null and conclude that structural breaks happen in our data as we mentioned according to the financial crises.Table 2. Results of the Chow test
 |
| |
|
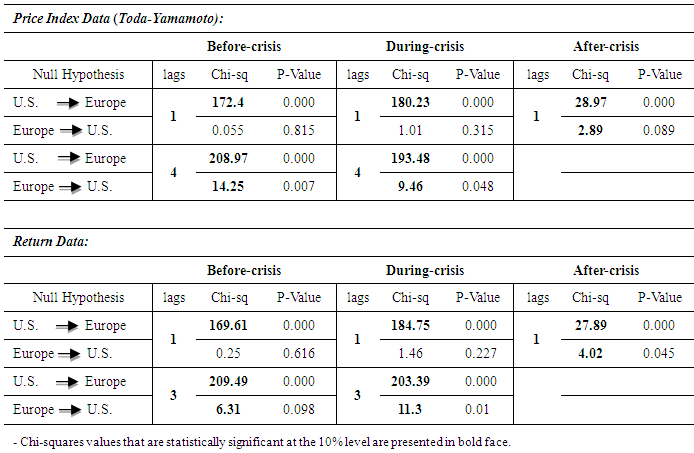
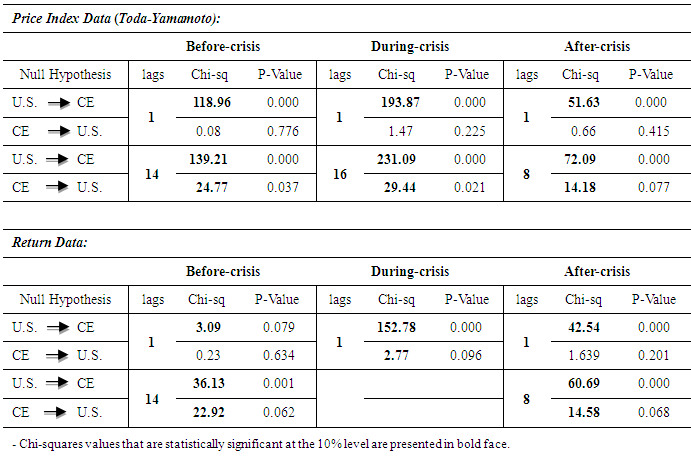
Using the unit root test proposed by Elliot, Rothenberg and Stock (1996), we find the result that all of the three variables (S&P 500, EURO STOXX 50 and CE) have unit roots in the price index while none of them have unit roots in the return data. The same result is obtained using both the ADF test and the KPSS test (results are not reported to save on space, but will be made available upon request). Therefore, we apply the Toda-Yamamoto Granger causality approach to the price index data and Granger causality Chi-square test to the return data. Tables 3(a) and 3(b) compare the results of these tests in the three different periods between price index and return data, respectively for the U.S. vs Europe and the U.S. vs Central Europe.Table 3(a). Results of Granger causality tests in different lags (The U.S. vs. Europe)
 |
| |
|
Table 3(b). Results of Granger causality tests (The U.S. vs. Central Europe)
 |
| |
|
Considering the price relationship between the U.S. and Europe stock markets (table 3(a)) using the price index data, a one-way relationship occurs at one lag (one day) where the U.S. stock index forecasts the European stock index but not the reverse. By increasing the number of lags to four days, a bilateral relationship occurs between the two stock indexes. However, for the after-crisis period, the bilateral relationship occurs at only one lag, which is shorter than the number of lags during and before the financial crisis. Considering the return data, the bilateral relationship happens at three lags before and during the crisis and likewise the price index data, it happens at just one lag after the crisis. Therefore, we can get the same result that the bilateral relationship happens in a shorter period of time after the crisis than either before or during the crisis. Table 3(b) presents the results of testing how the stock index of Central European countries relates to the U.S. stock index. Considering both the price index and return data series, a one-way relationship happens at one lag where the U.S. stock index forecasts the Central European stock index. A bilateral relationship can be found by expanding the number of lags to 14 days for the before-crisis period and by increasing the lags to eight days for the after-crisis period. However, for the during-crisis period, the results of the price index and return data series are not the same which may be caused by the nature of the return data and how we build it. The price index data shows that during the financial crisis, only the U.S. stock index forecasts the Central European stock index in one day and only by expanding the lags to 16, a bilateral relationship can be found. On the other hand, the return data shows that a bilateral relationship happens at only one day during the crisis.Consistent with the previous results, we see a bilateral relationship occurs in a shorter period of time after the crisis compared to the before-crisis period. However, it occurs with a much longer lag structure between Central Europe and the U.S. than between Europe and the U.S.
4.1. Quantitative Results: Variance Decomposition Analysis
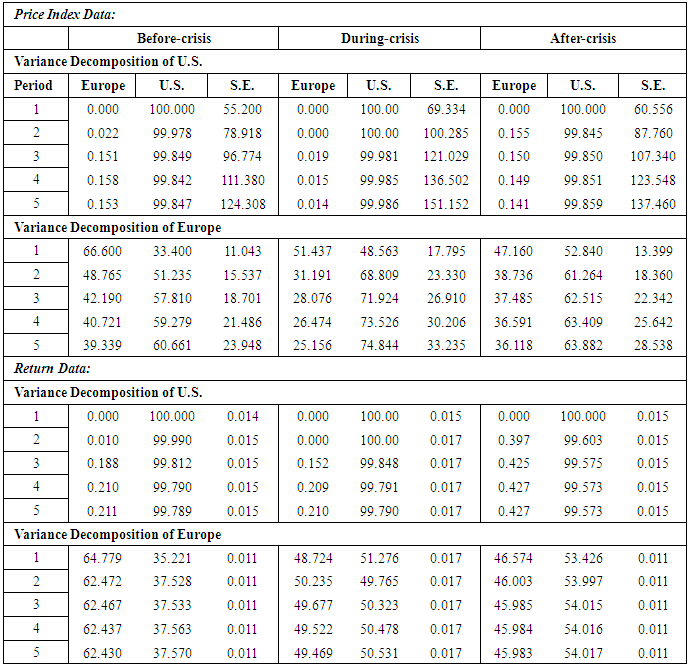
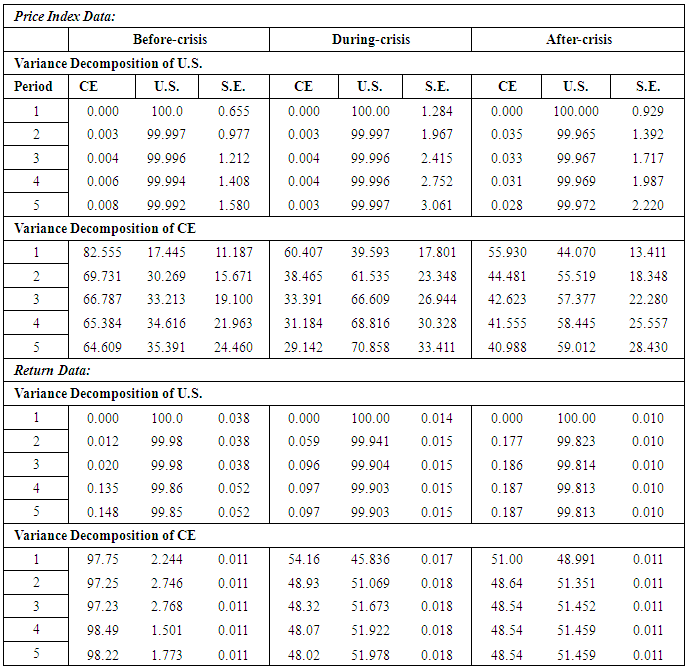
For both the price index and the return series of data, VAR models are estimated between the S&P 500 and the EURO STOXX 50 and also between the S&P 500 and the CE variables, all in levels, in the different periods. We use the Schwarz information criterion to find the optimum number of lags for each model. The variance decomposition is used to determine how much the forecast error variance of each variable can be explained by exogenous shocks to the other variables. Tables 4(a) and 4(b) present the results of variance decomposition during different periods of before-crisis, during-crisis, and after-crisis respectively for the U.S. vs Europe and the U.S. vs Central Europe.Table 4(a). Results of Variance Decomposition tests (The U.S. vs. Europe)
 |
| |
|
Table 4(b). Results of Variance Decomposition tests (The U.S. vs. Central Europe)
 |
| |
|
The results of the Granger causality test showed a bilateral relationship between the U.S. and Europe, and also between the U.S. and Central Europe after a few days during different periods of time. However, the results of variance decomposition provide clear evidence of the independence of the U.S. market versus both the European market and the Central European countries in all periods, using both price index and return data, as its forecast variance is only caused by its own innovations. The U.S. shows a significantly higher impact on the European stock markets during the crisis period when we use the price index data. As can be seen in Table 4(a), the S&P 500 index explains about 33-60% of the EURO STOXX 50 index during five days for the period of before-crisis, but this percentage range increases to 48-74% during the crisis, and then decreases to 52-63% after the crisis. This increasing impact during the crisis compared to before the crisis is much more significant for Central European countries. Based on the results of Table 4(b), the U.S. stock index explains about 17-35% of the Central European stock index during five days for the period of before-crisis, which increases to 39-70% during the crisis, and then decreases to 44-59% after the crisis. These findings further suggest that a larger proportion of the forecast variance of the Europe stock markets can be explained by the U.S. stock market during the crisis. Considering the price return data, although the effect of the U.S. stock market on the European markets increases significantly during the crisis compared to before the crisis, it even increases a few percent or stays about the same after the crisis. The return data confirms the more significant increase in the effect of the U.S. stock market on the Central European markets during the crisis compared to the whole European market. It’s interesting that considering the return data, Central European countries are almost independent from any changes in the S&P 500 returns before the crisis, while this result changes significantly during and after the collapse of stock markets as shown in the bottom panel of table 4(b).
4.2. Quantitative Results: Impulse Response Analysis
Due to the fact that the price index data are non-stationary, we just apply the Impulse Response Analysis to the return data. Figure 4 shows the response of the Europe and Central European stock indexes to a Cholesky-factorized one standard deviation change in the U.S. stock index during a 10 day window. It is interesting that the effects of the U.S. stock market on the Central European countries is moving around the zero line during the whole 10 days and the same result can be obtained by extending the window to 30 days. This shows that the Central European stock markets are segmented from the U.S. market before the crisis, while they become linked during the crisis and stay connected even after the crisis. Also, there is a peak for the first few days of all periods which shows the immediate response of the European markets to a price change in the U.S. stock market. The peak is higher during the crisis and significantly lower after the crisis which suggests the higher impact of the U.S. stock market on the European stock markets during the crisis while it’s decreasing after the crisis.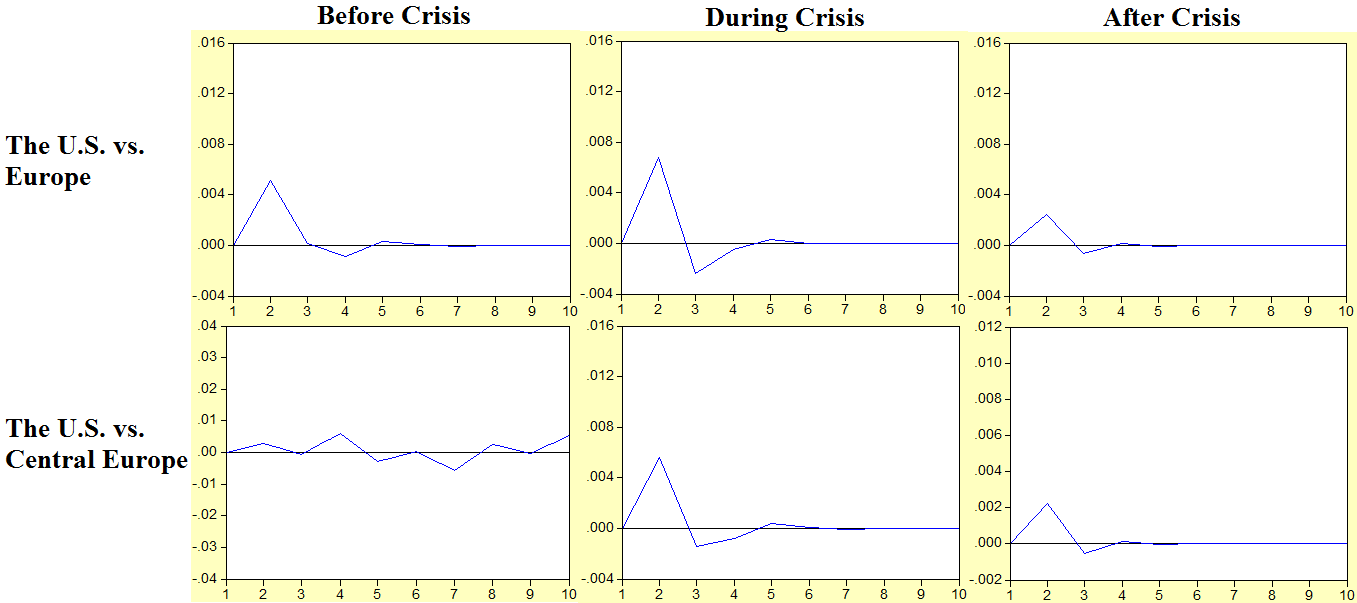 | Figure 4. Response of the Europe and Central Europe stock price returns to one std. dev. shock in the U.S. stock price returns |
In order to see the persistency of the effects, we use the accumulated response of the Europe and Central Europe stock markets to the price changes in the U.S. stock market which is presented in Figure 5. It can be seen that the impact of the U.S. stock market stays persistent 10 days after the price shock. The same result can be obtained by extending the window to 30 days. 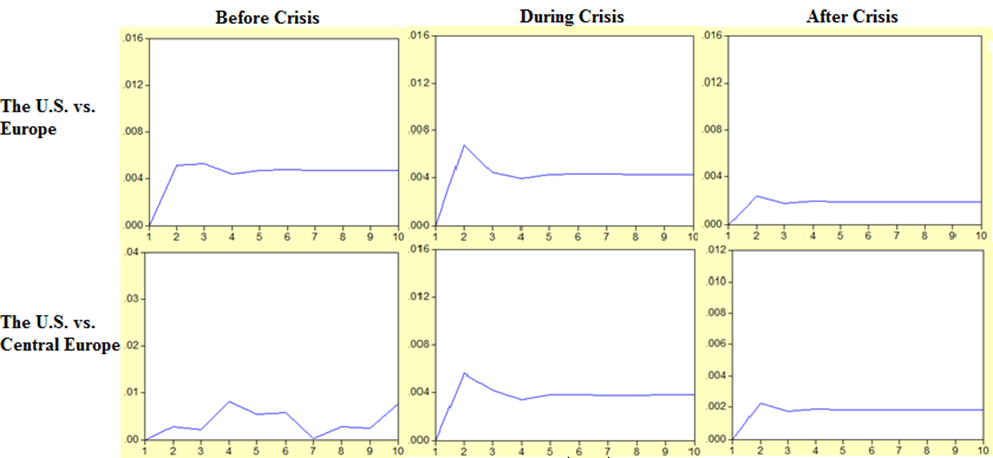 | Figure 5. Accumulated response of the Europe and Central Europe stock price returns to one std. dev. shock in the U.S. stock price returns |
5. Summary and Discussion
The purpose of this study is to examine the direction and magnitude of the financial links between the European stock markets and the U.S. stock market before, during, and after the 2008 financial crisis. The results show the immediate response of the European markets to a price change in the U.S. stock market while the reverse relationship takes longer to develop. This confirms that the World Systems Theory is partially validated by the data, is that the original shock stems from the U.S. (the core economy) and spread to the Europe (semi-periphery economy). However, the data also shows reverse causation, thus highlighting the importance of trade and debt links. The economic crisis had been transmitted to the European countries with a delay as the leaders of Europe’s largest economies were attempting to avoid the recession in different ways. Key agencies such as the Federal Reserve and the European Central Bank tried to help stabilize the financial markets in different ways by cutting interest rates and increasing the money supply (Guillén, 2012). These adjustments could also explain a feedback effect from the collapse in the European countries to the U.S. economy with a delay.The results also show that for both the European markets vs. the U.S. market and the Central European countries vs. the U.S. market, the bilateral relationship happens in a shorter period of time after the financial crisis. This could be rational due to the fact that after experiencing a crisis, the stock markets pay more attention to the price changes in the other markets and respond faster. In other words, they may became more inter-related as it is resulted clearly for the Central European stock markets and the U.S. market.The quantitative results of the study show a significantly higher impact of the U.S. stock market on the European stock markets during the 2008 financial crisis, while this effect is decreasing after the crisis. This shows that using portfolio diversification by investing in multiple international stock markets would not be much useful in case of a financial crisis due to the more powerful financial links between the affected markets. Also, the increasing impact of the U.S. stock market during the crisis compared to before the crisis is much more significant for Central European countries as these special countries were more segmented before the crisis. Future possible work could include investigating the direction of financial links between core and periphery countries through other important crisis periods and also measuring the magnitude of these links more in depth (e.g. elasticities of price responses to shocks), and the study of price volatility, an issue that exceeded the purpose of the present study. One possibility is to examine the financial links between the United States and major European countries such as Germany, France, and the United Kingdom before, during, and after the Great Depression. Another possibility is to study the direction of the 1997-98 Asian financial crisis considering Thailand and other major Asian countries affected by this crisis. By looking at other episodes, the qualitative results of this study would be more reliable and the next step would be digging more through the quantitative effects of the financial crises around the world. Also, there is possible implication in behavioral economics comparing the periods of normal shocks and the periods of rare shocks, investigating how much the stock market behavior change in regards of price taking from other major markets in different defined periods.
Notes
1. Wallerstein (1974) developed “World Systems Theory” which divides the world into three types of countries: core, periphery, and semi-periphery. Core countries are considered as more dominant countries with high-skill labors and capital-intensive production, while periphery countries are more dependent on the core countries.2. Correlation and not covariance is used to increase clarity, although the concept used in asset pricing models, such as the classical C-CAPM, is the covariance.
References
| [1] | Babones, S. J. & Alvarez-Rivadulla, M. J. (2007) "Standardized Income Inequality Data for Use in Cross-National Research", Sociological Inquiry, No. 77, pp. 3-22. |
| [2] | Breuss, F. (2011) "Global financial crisis as a phenomenon of stock market overshooting", Empirica, No. 38, pp. 131–152. |
| [3] | Ding, Z., Granger, C. W.J. & Engle, R. F. (1993) "A Long Memory Property of Stock Market Returns and a New Model", Journal of Empirical Finance, No.1, pp. 83-116. |
| [4] | Elliot, G., Rothenberg, T.J. & Stock, J.H. (1996) "Efficient Tests for an Autoregressive Unit Root", Econometrica, No. 64, pp. 813-836. |
| [5] | Guillén, M. F. (2012) "The Global Economic & Financial Crisis: A Timeline", The Lauder Institute, Univarsity of Pennsylvania. |
| [6] | Karunanayake, I., Valadkhani, A. & O’Brien, M. (2010) "Financial Crises and International Stock Market Volatility Transmission", Australian Economic Papers, University of Adelaide and Flinders University. |
| [7] | Kenourgiosa, D., Samitasb, A. & Paltalidis, N. (2011) "Financial crises and stock market contagion in a multivariate time-varying asymmetric framework", Journal of International Financial Markets, Institutions & Money, No. 21, pp. 92-106. |
| [8] | Kotkatvuori-Örnberg, J., Nikkinen, J. & Äijö, J. (2013) "Stock market correlations during the financial crisis of 2008–2009: Evidence from 50 equity markets", International Review of Financial Analysis, Vol. 28, pp. 70–78. |
| [9] | Nikkinen, J., Piljak, V. & Aijo, J. (2011) "Baltic stock markets and the financial crisis of 2008–2009", Journal of Research in International Business and Finance, No. 26, pp. 398– 409. |
| [10] | OECD (2009), Economic outlook, vol. 2009/1, no. 85, OECD, Paris, June 2009. |
| [11] | Toda, H. Y. & Yamamoto, T. (1995) "Statistical inferences in vector auto-regressions with possibly integrated processes", Journal of Econometrics, No. 66, pp. 225-250. |
| [12] | Wallerstein, I. (1974) "The Modern World-System I: Capitalist Agriculture and the Origins of the European World-Economy in the Sixteenth Century", New York: Academic Press. |
| [13] | Wallerstein, I. (1980) "The Modern World System II: Mercantilism and the Consolidation of the European World-Economy, 1600-1750", New York: Academic Press. |
| [14] | Wen, X., Wei, Y. & Huang, D. (2011) "Measuring contagion between energy market and stock market during financial crisis: A copula approach", Journal of Energy Economics, No. 34, pp. 1435–1446. |
| [15] | Yang, J., Kolari, J.W. & Min, I. (2003), "Stock market integration and financial crises: the case of Asia", Applied Financial Economics, Vol. 13, No. 7, pp. 477-86. |
| [16] | Yang, J., Hsiao, C., Li, Q. & Wang, Z. (2006), "The emerging market crisis and stock market linkages: further evidence", Journal of Applied Econometrics, No. 21, pp. 727-744. |
| [17] | www.bbc.com/news, BBC News, September & October 2008. |


 as:
as:  where
where  is the price index at time t.Three periods of time are used in this study: before crisis, during crisis, and after crisis. For the before crisis period we use the data from January 2000 to June 2006, for the during-crisis period July 2006 to December 2009, and for the after-crisis period January 2010 to May 2013. Chow test was applied to check if there are structural breaks occurring during the specified periods, indicating that our choices are reasonable. This simply tests for the presence of structural breaks by checking if the coefficients of two linear regressions on different time series are equal or not. The break points ultimately chosen were selected after also running the Chow test for other alternative break points. The results of this test is presented in section 3.Figures 1, 2 and 3 show the changes in the U.S., Europe and Central Europe stock market price indexes from the year 2000 to May 2013. As can be seen, stock market prices follow a similar pattern in the U.S. and Europe especially before and during the crisis. For all three of the stock market price indexes, there is an upward trend at the start of the crisis period followed by a crash during the last months of 2008 and the start of 2009. Point A is not considered as the start of crisis because it is happening in years 2002-2003 which is not in our interest and also this period does not contain the global trough. Point B is not only a break in the price series according to the Chow test, but it also provides an early warning indicate of the impending crash, something that point C does not. In other words, B has predictive value as a break point while C does not. Finally, the end of the crisis is considered to be point E which shows a return to the midpoint value of ≈1100, which could be considered a return to normality. Point D, on the other hand, is the global trough, but the price series has not yet returned to a normal value.


 On the second step, determining a lag length
  we estimate a
  order VAR. The important point here is that we do not include the coefficient matrices of the extra
  lagged vectors in the model, since they are used just to follow the standard asymptotic theory. Therefore, we include the extra lags as exogenous variables to the model and test the restrictions only on the first
  coefficient matrices (Toda & Yamamoto, 1995). The next step in our study is to check the quantitative impacts of the U.S. stock market crash of 2008 on the European stock markets. The variance decomposition is used once VAR models are fitted in order to indicate the amount of information each variable contributes to the other variables in our regression. Also, the impulse response function of the model is a good instrument to analyze the dynamic effects of the system when the model receives a shock. The aim here is to see the persistence of the effect during the time by using the impulse responses.

 Abstract
 Reference
 Full-Text PDF
 Full-text HTML


