-
Paper Information
- Paper Submission
-
Journal Information
- About This Journal
- Editorial Board
- Current Issue
- Archive
- Author Guidelines
- Contact Us
American Journal of Economics
p-ISSN: 2166-4951 e-ISSN: 2166-496X
2016; 6(3): 147-157
doi:10.5923/j.economics.20160603.01

Analysis of Region Characteristics and Social Capital to Welfare of Palm Farmers in the Siak District (Studies in Libo Jaya Subdistrict Kandis)
 Abstract
 Reference
 Full-Text PDF
 Full-text HTML
Hendra Saragih1, Pudjihardjo2, Ghozalie Maskie2, Khusnul Ashar2
1Doctoral Program of Economics Science, Faculty of Economics and Business, University of Brawijaya, Indonesia
2Faculty of Economics and Business, University of Brawijaya, Indonesia
Copyright © 2016 Scientific & Academic Publishing. All Rights Reserved.
This work is licensed under the Creative Commons Attribution International License (CC BY).
http://creativecommons.org/licenses/by/4.0/

Riau provincial government policies oriented to improving the welfare of oil palm growers should be based on factors that affect the condition of the plantation area. Factors that cause the welfare of smallholders may be characteristic of the region, social values contained in communities, households, and individuals (World Bank, 2002). Besides that policies adopted by governments can be precisely targeted, local governments are expected to able to see palm farmer welfare problems in terms of areal. This study aimed to describe the characteristics of the region and the influence of social capital on the welfare of farmers, especially in oil palm. The method used consisted of Analysis of Structural Equation Models (SEM) to explain the influence of regional characteristics and social capital in the welfare of smallholders in Libo Jaya in subdistrict Kandis.The final results of this study explains that the variable character of the area plantations significantly affect the welfare of smallholders in Libob Jaya subdistrict Kandis. Variables that affect the character of the area plantations of oil palm farmers' welfare, ie, fixed income, jobs, damage to the environment, market access, the land held and the number of family members. The results of the analysis of the linkages between capital with well-being, namely: (1). the coefficient of direct influence Variable norm (X1) to Variable welfare (Y1) of 0.408 and is positive and significant shows that the shape of the influence of variable norm of the variable being is directly proportional (positive) and significant, which means that the increase factor variable norms will impact significantly to improving the welfare of variable factors, (2). the coefficient of direct influence Variable network (X2) on the variable being (Y1) of 0.638 and is positive and significant shows that the form of influencing variables for networks with variable prosperity is directly proportional (positive) and significant, which means that the increase factor variable network will have a significant impact variable factors to increased welfare and (3). the coefficient of direct influence Variable trust (X3) on Variable welfare (Y1) of 0.621 and is positive and significant shows that the form of influencing variables of confidence in the Variable prosperity is directly proportional (positive) and significant, which means that the increase factor variable trust will have a significant impact to improving the welfare of variable factors.
Keywords: Regional characteristics, Social Capital and Welfare Oil Palm Smallholders
Cite this paper: Hendra Saragih, Pudjihardjo, Ghozalie Maskie, Khusnul Ashar, Analysis of Region Characteristics and Social Capital to Welfare of Palm Farmers in the Siak District (Studies in Libo Jaya Subdistrict Kandis), American Journal of Economics, Vol. 6 No. 3, 2016, pp. 147-157. doi: 10.5923/j.economics.20160603.01.
1. Introduction
- Economists with the formulation of the theory presented to explain the importance of the development process to the public welfare. One of them, namely Ravallion in Tono (2009) which states that "acredible measure of society welfaire can be a powefull instrument for focusing the attention of policy makers on the living conditions of the poor (a measure of social welfare that can be trusted can be instrumental formidable a focus of attention for policy makers on the living conditions of the poor)". Therefore, in reviewing the government's policy of Riau Province in solving the problem of oil palm farmers' welfare, needs to first be considered factors of regional and local wisdom grow and develop in the group of oil palm farmers in this study is called the determinant of the welfare of farmers.Riau provincial government policies oriented to improving the welfare of oil palm growers should be based on factors that affect the condition of the plantation area. Factors that cause the welfare of smallholders may be characteristic of the region, social values contained in communities, households, and individuals (World Bank, 2002). Besides that policies adopted by governments can be precisely targeted, local governments are expected to able to see the problem of farmers' welfare in terms of areal palm.Riau Province is a province that accounts for 24% of national production of palm oil in 2009 (Source: Directorate General of Plantation, 2009). This condition makes Indonesia in 2009 managed to become the largest palm oil producer in the world by defeating Malaysia. One contributing factor is the land in Riau contribute to the achievement of increased international trade based on commodities. Increased area of oil palm in the province of Riau relatively ambitious. The area of oil palm plantations in Riau in 2009 reached 16 936 km2 or 17% of the area of the province. In 2006, this percentage is only 10.15% (van Noordwijk et al, 2008: 35). This means that there is an increase of nearly 7% in three years or the equivalent of 2,446 km2 per year, 25% of this land is owned by foreign investors (McCarthy, Vel, and Afiff, 2012: 532; The Jakarta Post, January 18, 2011).However, the expansion of palm oil land in Riau province also creates problems for the life of the community in the province. The expansion of this area have to sacrifice about 65% of the original forest to serve as plantation (VEM, 2011: 4). This conversion also releases carbon stored in peatlands. According to the Greenpeace study (2007), 14,6Gt of carbon stored in peatlands in Riau and the expansion of oil palm land capable of releasing it into the amount of greenhouse gases equivalent to one year's total global emissions (Kristinawati, 2011: 30). Construction of large-scale oil field in Riau province also lead to conflicts over indigenous rights and other land conflicts. Riau has occurred at least 15 times the oil palm related conflicts (Sirait, 2009: 7; Marti, 2008: 40). It is estimated that in total, including a conflict that is not reported to NGOs or the media, including 200 cases involving 60 oil companies (Afrizal, 2010). This conflict is reflected in an excerpt from the van Opijnen (2009: 13):"This is a sacred area of our ancestral leaders. He had been covered by a large forest. From here to there, and around it, there is only a dense forest with big trees, trunks as thick drum. This place used to be called "stone jungle singing" .It has been passed down from generation to generation. Now there are no more big trees, everything is shrouded by palm trees "(Marti, 2008: 86).In Siak, palm plantation expansion rate was 0.87% per year. In 2003, the total area of oil palm plantations in Siak is 131.168 ha (Riau Plantation Office, 2003). In 2007, extensive palm gardens are 183,598.13 hectares while in 2009 to 186.819 ha (Syahza, 2011: 172). This palm land area covers 21.83% of land area Siak district. Siak own only 9.9% of land area covers the provinces of Riau mainland while land area covers 10.7% of its oil palm plantation area in the province of Riau. This indicates that the Siak district are more intensive in the expansion of oil than the average of other districts. In view of its composition, the area of oil palm plantations in Riau plantation folk only around 59.935 ha (61.27% is pure self farmers, the rest PIR) (Disbun Riau Province, 2003). Therefore only 45.69% of the land in Siak district palm plantations are the people while the rest are owned by large companies (PTPN V or private).One of the central palm in the district in the village Kandis Jaya. Desa Libo Libo Jaya is a new village pemekaran. Sinar Mas Group itself is a family-owned company Eka Tjipta Widjaja, one of the families that have been criticized as one of the cronies of President Suharto (Bailey, Gao, and Mao, 2004: 170) which is viewed negatively because of thinking short term and "greedy" (Colombijn 2002: 754). ELSAM if there is a record of four companies affiliated with PT Sinar Mas is a company that is in conflict with the public (ELSAM, 2012: 16). Sinar Mas palm oil company into one of the largest of the five largest oil companies in Indonesia (the others are Raja Garuda Mas, Wilmar Group, Guthrie Group and Astra Agro Lestari) (Export News, June 2011: 5).PT. Sinar Mas itself claims to have been doing CSR (Corporate Social Responsibility) in the form of a bazaar, allocating jobs for locals, scholarships for employees and local residents who excel, and the establishment of social and educational facilities (Export News, June 2011: 13). Even so, based on the writer's observation and reports from villagers Libo Jaya, have not found any CSR program applied to the community, especially oil palm farmers in the village of Libo Jaya, the lack of guidance the company regarding knowledge of palm oil to the community, disputes a land grant in the area of companies, a lack of clarity within the boundary of the concession company with the community, and the plasma is not yet clear division of the company to the public.Therefore the role of social capital, such as local institutions, local knowledge, norms and customs important to increase its role in improving the socio-economic condition of society, especially oil palm farmers. Good social capital is crucial for the success of improvement of various sectors of the economy. Various studies explain that the economic empowerment has a positive influence on the success in improving the welfare of society (Kumar, 2005, Multifiah 2007, Abusamah 2008, Ridwan 2009, Widiastuti 2009, Suyanto 2009, Faiza 2004, Bindu 2009). The economic empowerment comes and the government or non-government, which includes the provision of venture capital from the government through community empowerment programs and the distribution of zakat, donation and sadaqah (ZIS).But the existence of the above problems raise questions about how people can survive in the existing constraints. Society itself generally is oil palm farmers. If society Libo Jaya can maximize the role of their social capital so as to increase their income, they should be able to avoid conflicts through their collective strength. Communities also can improve the economy and in turn, the welfare of the entire oil palm farmers in the village of Libo Jaya. For this reason, the researchers want to try to analyze how the influence of social capital on the income and welfare of the palm oil business available to the public by the farmers in the village of Libo Jaya to improve the welfare of existing oil palm growers, By wisely and avoid the negative impact that may be caused. The study examined the role of social capital as well as a variety of factors that can support social capital to increase the income and welfare of farmers. This study aims to explain the influence of social welfare capital of oil palm farmers in the village of Libo Jaya in subdistrict Kandis-Siak.
2. Research Methods
- This study aimed to analyze the relationship variables special region estates as well as the determinants of social capital which is the local wisdom that affect the welfare of oil palm farmers in the subdistrict Kandis-Siak. The choice of location using criterion-based selection, the choice is based on certain criteria. (Le Compte and Preissle in alwasilah, 2003).This study uses Structural Equation Modeling analysis tools commonly abbreviated SEM. SEM can be described as an analysis that incorporates a factor analysis, the structural model, and a path analysis. In the SEM analysis, which must first be determined is measurement model as described previously. Confirmatory factor analysis techniques or measurement models assess how the variables be observed (observed variables) defines latent variables. In the SEM, the model uses the measurement of exogenous and endogenous latent variables. SEM sets a prediction of endogenous latent variable by exogenous latent variables. SEM can use several different equation form, for example (1) one independent latent variable can predict the dependent latent variables. (2) two independent latent variables can be correlated to predict a dependent latent variable. (3) two dependent latent variables can be related reciprocity. (4) an independent latent variables can Predict other latent variables, and then predict a third latent variables, Schumacker and Lomax (1996). In this study, used (1) one independent latent variable can predict the dependent latent variable that more and (2) one independent latent variables can predict the other latent variables, and further predicts the third latent variable. As shown below:This research was conducted in subdistricts Kandis district Siak and in the village of Libo Jaya. Location of the study can be seen in the map below.
3. Empirical Result
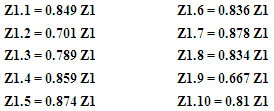
- 1. Data Analysisa. Contributions Indicators Verifiers Social Capital VariableThe results of this study explains that the measurement model norm dimensions are as follows:
 Further confidence-dimensional measurement model is as follows:
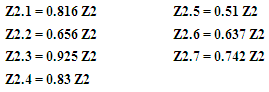
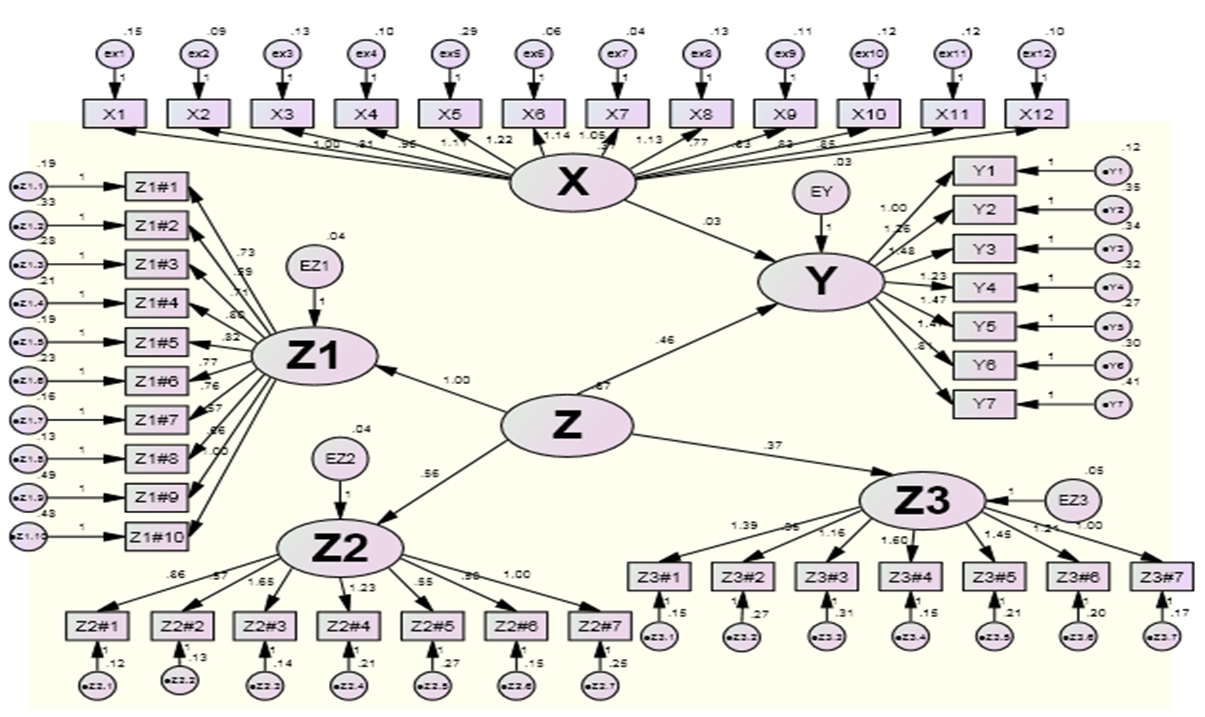 | Figure 1. Line Diagram Structural Equation Modeling (SEM) |
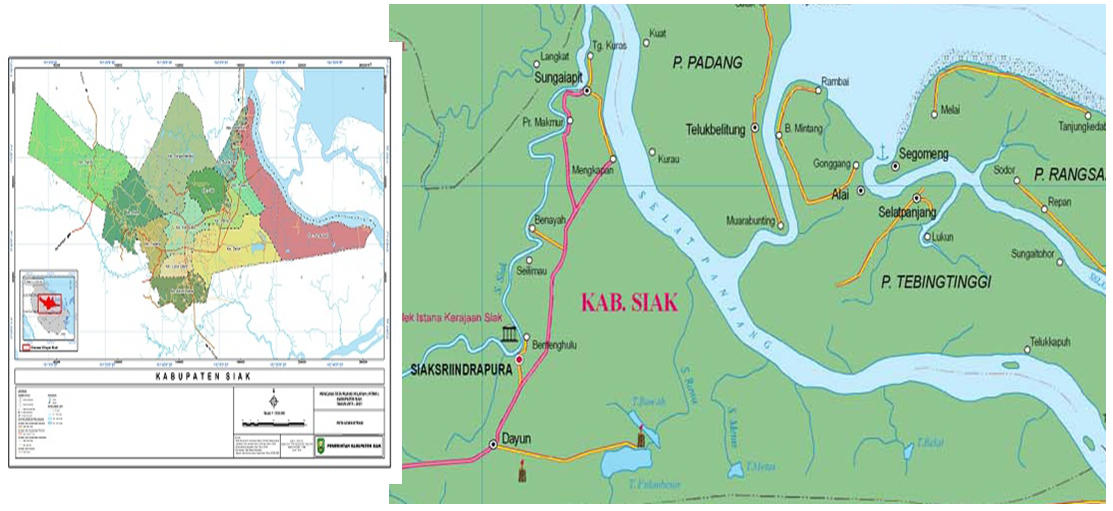 | Figure 2. Research Location Map |
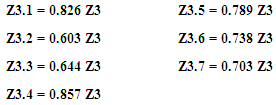 Compilation of dimensional measurement model norms, beliefs and became the model of network measurement of social capital variables with the end result as follows:
 Based on the above measurement model known that the loading indicator Z1 (norms) for 0.979. This means that the diversity of social capital variables able to be explained by the indicators Z1 (norm) of 97.9%. In other words, the contribution Z1 (norm) in measuring social capital variables amounted to 97.9% .Then loading indicator value Z2 (confidence) of 0.941. This means that the diversity of social capital variables able to be explained by the Z2 indicator (trust) amounted to 94.1%. In other words, the contribution Z2 (trust) in measuring social capital variables amounted to 94.1%. Furthermore, the value of the loading indicator Z3 (network) of 0.846. This means that the diversity of social capital variables able to be explained by the indicator Z3 (network) amounted to 84.6%. In other words, the contribution Z3 (network) variables in measuring social capital by 84.6%. Model measurement of social capital variables also informed that the indicators Z1 (norm) has the greatest value loading. This means indicators Z1 (norm) is an indicator of the most dominant in measuring social capital.b. Contributions Indicators Verifiers Welfare Capital VariableAs for the well-being of variable measurement model is as follows:
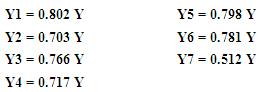 Based on the above measurement model known that the loading indicator Y1 (production of palm oil can be sufficient for the basic needs of a family) of 0802. This means diversity welfare variables able to be explained by the indicator Y1 (production of palm oil can be sufficient for the basic needs of the family) amounted to 80.2%. In other words, the contribution of Y1 (production of palm oil can be sufficient for the basic needs of the family) in measuring the well-being of 80.2% variable. Then the loading indicator Y2 (palm oil production could be sufficient to send children to the high school level and Higher Education) of 0703. This means that the diversity of variables able to be explained by the well-being indicators Y2 (palm oil production could be sufficient to send children to the high school level and Higher Education) amounted to 70.3%. In other words, the contribution Y2 (palm oil production could be sufficient to send children to the high school level and Higher Education) in measuring the well-being of 70.3% variable.Furthermore, the value of the loading indicator Y3 (palm oil production could be sufficient to be able to buy motorcycle) by 0766. This means diversity welfare variables able to be explained by Y3 indicators (production of palm oil could be sufficient to be able to buy a motorcycle) of 76.6%. In other words, the contribution Y3 (palm oil production could be sufficient to be able to buy a motorcycle) in measuring the well-being of 78.9% variable. Then the loading indicator Y4 (production of palm oil could be sufficient to be able to enjoy family entertainment) of 0.717 This means diversity of variables well-being able to be explained by indicators Y4 (production of palm oil could be sufficient to be able to enjoy family entertainment) amounted to 71.7%. In other words, the contribution Y4 (palm oil production could be sufficient to be able to enjoy family entertainment) in measuring the well-being of 71.7% variable.Next loading indicator value Y5 (production of palm oil can be used sufficient to provide the facilities and infrastructure of palm oil production) of 0.798. This means diversity welfare variables able to be explained by Y5 indicators (production of palm oil can be used sufficient to provide the facilities and infrastructure of palm oil production) amounted to 79.8%. In other words, the contribution Y5 (production of palm oil can be used sufficient to provide the facilities and infrastructure of palm oil production) in measuring the well-being of 79.8% variable. Then the loading indicator Y6 (palm oil production could be sufficient to make the house livable oil palm farmers and healthy) of 0.781. This means diversity welfare variables able to be explained by Y6 indicators (production of palm oil could be sufficient to make the house livable oil palm farmers and healthy) amounted to 78.1%. In other words, the contribution Y6 (palm oil production could be sufficient to make the house livable oil palm farmers and healthy) in measuring the well-being of 78.1% variable.Furthermore, the value of the loading indicator Y7 (palm oil production could be sufficient to save) by 0.512. This means diversity welfare variables able to be explained by the indicator Y7 (palm oil production could be sufficient to save) amounted to 51.2%. In other words, the contribution Y7 (palm oil production could be sufficient to save) in measuring the well-being of 51.2% variable.Variable measurement model welfare also informed that the indicator Y1 (production of palm oil can be sufficient for the basic needs of the family) has the greatest value loading. This means that the indicator Y1 (production of palm oil can be sufficient for the basic needs of the family) is an indicator of the most dominant variable in measuring wellbeing.c. Evaluation of Structural ModelThe results of the feasibility testing construct that has been summarized in the following table.
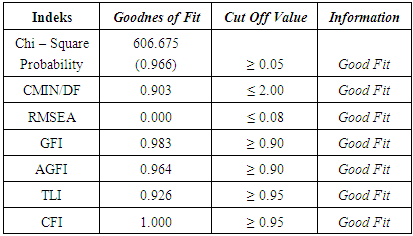 Based on the summary of the goodness of fit, it is known that the six index are chi-square, RMSEA, GFI, AGFI, TLI and CFI have criteria that correspond to cut off its value, so that the six indices have been met. Thus constructs that have been formed otherwise appropriate (feasible).d. Hypothesis testingHypothesis testing is intended to test whether there is a direct effect of exogenous variables on endogenous variables. Significance testing can be known through a probability value. Testing criteria mentioned that if the probability (level of significance (alpha (α = 5%)) then declared there is significant influence exogenous variables on endogenous variables. The results of analysis can be seen through the summary in the following table,
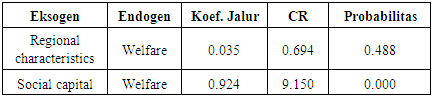 e. Conversion Charts Path to the Structural ModelConversion into the path diagram measurement model is intended to determine how the effects of exogenous variables on endogenous variables. The resulting structural models are as follows:
 From equation 1 and the above image can be informed that:1. Coefficient direct effect on the welfare of area characteristics of 0.035 states that the characteristics of the region and a significant positive effect on well-being. This means that the stronger the regional characteristics tend to improve well-being. Although the characteristics of the region to enhance the welfare, but the increase was not significant.2. Direct coefficient effect of social capital on the welfare of 0.924 states that social capital and significant positive effect on well-being. This means that the higher the social capital tend to improve well-being.
4. Discussion
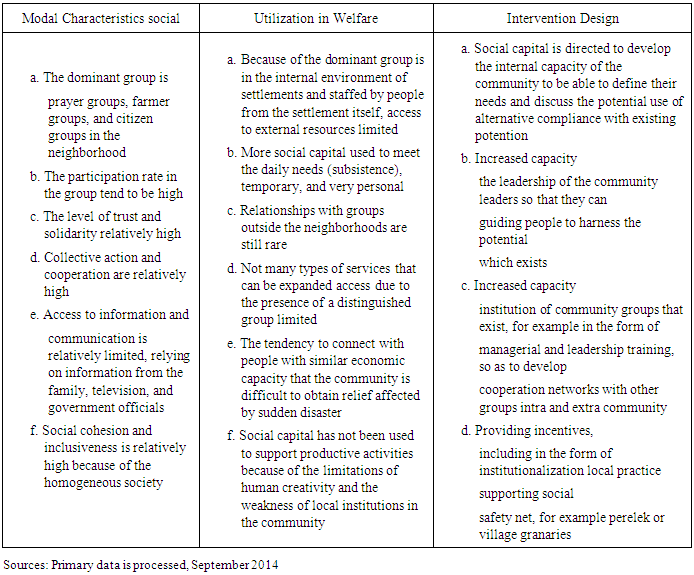
- A region with their characteristic and community groups (tribes) in Indonesia essentially has the potential to support the development. The problem for these potentials is less a place for their assumption these potentials can not be used for improving the quality of human life. As a result, in addition to not widely understood, nor is it included in the development process itself.a. Effect of Regional Characteristics of Farmers WelfareThe phenomenon of poverty in the area of the plantation showed a link between spatial factor on its characteristics and poverty, as reported by several studies. International Fund for Agricultural Development (2002) found that poverty in Asia is concentrated in two dimensions, geographical factors/regions and social factors. In aggregate in the Asian region, poverty among the population with the livelihoods of farmers; most is poverty in rainfed and dryland agriculture. Meanwhile, for the Overseas Development Institute (ODI) and the Multi-Stakeholder Forestry Program (2005) reported that in the village at the edge of the plantation area and there is a higher poverty rate than the villages outside the plantation area. Average of poverty at the village and at the edge of the plantation area is about 37-50 percent of the poverty in each region. The highest region is Papua Province which is about 70% of the number of poor people in rural areas of plantation. After that followed Nusa Tenggara which amounted to 66% of the population is poor. While in Sumatra, Java, Bali and Kalimantan, poor households living on agro-ecosystem zones plantation area is lower than the average national poverty.Furthermore, the Centre for Socio-Economic Research (1995) reported that in agro-ecosystem plantations dry land, poverty is characterized by the low quality of human resources, power adoption to new technology and lower skills resulting low productivity and accessibility to the labor market is low. It also said that on dry land agro-ecosystem plantations in West Sumatra showed characteristic villages in the plantation area include inadequate economic infrastructure such as transport and other infrastructure includes the means of communication, information, electricity and others that affect the economic activity. Furthermore, plantation farmer vulnerability to poverty also points to the link with the ecosystem. Mukherjee (2002) reported that in an agricultural ecosystem on family farms and plantations in West Kalimantan showing the configuration of different vulnerabilities.In addition to the characteristics of the region, also found that the difference in the carrying capacity and economic opportunities to meet the necessities of life for the community. This is demonstrated by differences in the characteristics or factors identifier attached to the typology character of the area. In other words, factors identifier attached to the welfare of farmers is an archetype base of poverty; household that is consider to be the poor because they have all their most important characteristics. Thus, the policies in improving the welfare of plantation workers can not be uniform except to take into account the typology and factors identifier farmers themselves with the diversity of regions in Indonesia. Thus, the policy of increasing the welfare of plantation workers can not be one solution fits for all. This is based on the premise that diversity welfare of plantation workers is an essential prerequisite (Necessary condition), but not enough (insufficient). For that, they need a micro perspective that has been neglected in efforts to improve the welfare of plantation workers. Dimensional micro perspective in the welfare of farmers, among others, increasing the capability of individuals and households, reducing vulnerability, institutional and environmental improvements. In other words, social and economic development can be carried out starting from the bottom.Based on previous descriptions, the approach characteristic of the area selected as an alternative worthy of reference to improve the welfare of oil palm farmers. This study hypothesizes that the welfare palm oil does not occur randomly, but follow a systematic patterns that are structurally correlated with the characteristic region. Most households palm farmer on the characteristics of a particular plantation areas are trapped in poverty (spatial poverty trap) that is so deep and difficult to cross the threshold of poor without government intervention and community awareness to rise to prosperity.Oil palm plantations in Siak became one of the central poverty followed the plantation areas with low public educational character. Therefore, to eliminate poverty and social backwardness in the areas for the development strategy that takes into account the importance of economic equalization between groups and between regions. Oil palm plantation activities in Libo Jaya subdistrict Kandis is expected to lift the economy of society, especially those whose livelihood from agriculture. The impact of oil palm plantations in the plantation area will be seen from several indicators, among others: (1). Created economic multiplier effect of the activities of oil palm plantations in the countryside, (2). Welfare oil palm farmers as a result of the production of oil palm plantations.According to Jonathan Haughton and shahidur Khander R. (2009). The relationship between the welfare of the characteristics of the area are country specific (depends on the circumstances of each country). However, in general, the welfare of the low numbers in areas isolated geographically, has a low resource base, has a low rainfall, and a variety of other difficult natural conditions. For example, many people who argue that economic development is very slow in Bangladesh triggered by the country's vulnerability to annual flooding. Another example is the Nghe An province in north-central Vietnam were less prosperous because it is often hit by typhoons that devastated their capital stock. The remoteness of rural areas, which led to farmers only get a low price for the commodity they sell and fetch a high price for the goods they buy as a result of high transportation costs, causing food insecurity for the poor. Poor public services, poor communications and infrastructure and the market is not growing is the main characteristic of rural life. The situation is also experienced by many growers of palm oil is the main cause of their low welfare.b. Region Characteristic and the Role of Social Capital in Welfare Support FarmersThe results of this study as a form of criticism of government policies that focus on the benefits of the increase in production of capital among the community of oil palm growers. This study measured social capital by size ever conducted by Fukuyama. This study directly explains that there is a strong tendency or weakness of social capital in a region or in a group. This study describes the elements of social capital and how it goes in a group of farmers in the area of oil palm plantations in carrying out economic activities of production.Oil palm farming communities in Kandis Village has social connections and the most powerful connections are among of palm farmers. Communities with the above characteristics are categorized in a society characterized by Gemeinschaft. Of the three types of Gemeinschaf according to Tonnies, namely Gemeinschaft by blood, Gemeinschaft of Placo (locality), and Gemeinschaft of mind, then the community of oil palm growers belonging to the Gemeinschaft of Placo (locality), because of mutual help based on dwellings adjacent. Then a sense of trust can be seen in the transaction or borrowing money either for the sake of social and economic interests. Oil palm growers who are not in social institutions is difficult to access some assistance programs, one of them subsidized fertilizer aid. As happened in several oil palm farmers in the village of Libo Jaya.The strong social capital can be used as venture capital to develop palm oil production while still weak social capital should be strengthening. Some already strong social capital in the community of oil palm growers are: cooperation, trust, norms, customs, local cultural values, tolerance, wisdom and local knowledge, social leadership, community participation, self-reliance, freedom of mobility. While elements of social capital that are still weak are: network marketing, network products processing, fertilizer distribution network and involvement in the campaign.Descriptive of the findings of community among smallholders linked strong social capital and weak in the village of Libo Jaya subdistrict Kandis Siak in detail can be explained as follows:1. Sense of trust, sense of trust amongst smallholders still high because generally borrowing money to do without notes, even each other they do not need collateral;2. Cooperation, cooperation in oil palm farming community in all study locations are high. In addition to land management, the cooperation also occurs in every kind of life cycle of birth, circumcision, marriage and death. Similarly, the construction of public facilities such as schools, roads, up to a place of worship;3. Networking product marketing, oil palm marketing is done using two methods, namely direct and indirect. Directly to the processing of palm oil and indirectly through wholesalers;4. The norms, customs, values of local culture, local cultural values indicated by activity mutual cooperation or mutual aid without pay. Mutual cooperation is done in the form of improved public facilities.5. Wisdom and local knowledge, community palm oil farmers found some local wisdom, among others: scheduled each weekly cleaning plantations particularly the adoption of the leaves of palm trees that had dried or fall.6. Social Leadership, leadership of the most respected in the community of oil palm growers relatively different, but scholars still got a heart in the eyes of the community, including oil palm farmers in the village of Libo Jaya. Though there who believe in psychics or healers, but the percentage is relatively small. While the formal leadership as chairman of RT / RW, Village, Head, Regent a place in society to resolve problems related to the law; and7. Togetherness, palm oil farmer groups into the farmer comunity. The reason people flocking farmer is easier to get information, to solve problems of cultivation, and tighten the relationship.Developing social capital in a group of oil palm farmers in the village of Libo Jaya subdistrict Kandis played a role in solving economic and social problems. The farmer group "Lancang Kuning" is one of a group of oil palm farmers in the village of Libo Jaya standing in the capacity of oil palm agriculture by relying on social capital in the wheel of a group trip. Conditions existing social capital in this group is quite high. The level of trust, cooperation, solidarity, collective action and participation in good condition. This is a sign that the social capital within this group is so strong. In this case, a group of people belonging to groups of farmers "Lancang Kuning" has proved that although the government missed the obstacles and constraints of agriculture that they face, but with togetherness, trust and other forms of social capital others have helped them in solving these obstacles.Utilization of social capital for the welfare of the community by the farmers taking into account the characteristics of the region, social, and cultural communities concerned. Based on these factors, formulated a model of social capital utilization to achieve the welfare of the oil palm growers, the model of rural estates. In this model groups a greater role in public life oil palm growers are prayer groups, farmer groups, and citizen groups in the rural settlements. The participation rate tends to be high in the group as well as the level of trust and solidarity relatively high characterized by high collective action and cooperation. Access to information and communication is relatively limited, relying on information from the family, television, and government officials. Social cohesion and inclusiveness is relatively high because of the homogeneous society.Welfare is a concept that is used to express the quality of life of a community or an individual in a given area at a certain time (Suandi 2007). The concept of well-being or the sense of wellbeing that is owned is relative, depending on how the assessment of each individual on the welfare itself. Dimensions of realizing people's welfare is vast and complex, so that a people's welfare can only be seen when viewed from a certain aspect.In existing, utilization of social capital in the public welfare oil palm growers are characterized more rural estates used for fulfilling the daily needs (subsistence), temporary, and very personal. Because dominant group is in the internal environment of settlements and is staffed by people settlement itself, access to outside resources are limited. Relationships with groups outside the neighborhoods they rarely do, so there are many types of services that can be expanded access due to the presence of a limited group. The tendency to connect with people with similar economic capacity that the community is difficult to obtain assistance when exposed to sudden disaster.Social capital has not been used to support productive activities because of the limitations of human creativity and the weakness of local institutions in the community. Based on characteristics of social capital and its utilization for these in poverty reduction, the social capital utilization model for creating prosperity in rural areas-plantation aimed to develop the internal capacity of the community to be able to define their needs and discuss alternative compliance by using the existing potential. Increased leadership capacity of community leaders so as to guide the public to utilize the existing potential. The local government can facilitate training for community leaders in order to carry out the role of advocacy or assistance to surrounding communities. In addition, it is also necessary to increase the institutional capacity of community groups that exist, for example in the form of managerial and leadership training, so as to develop a network of cooperation with other groups intra and extra community.Social capital in the community level by the farmers in the village of Libo Jaya reflects the values of solidarity and displays the types of social relationships Field (2010). Type of social relationships can be either (Woolcock 2001) in the Field (2010): (1) social capital that binds (bounding capital), which means that the bonds between people in the same situation, such as a close family, good friends and get along stairs, ( 2) social capital bridging (bridging capital), which include bonds looser than some people, such as faraway friends and co-workers, and (3) social capital linking (linking capital), which is reaching out to people of different situations as different as they are entirely outside the community, thus encouraging its members utilize resources than are available in the community.Social capital in the community oil palm farmers in the village of Libo Jaya based on the fact the field has not been able to contribute to the welfare of the farming community with based on elements of existing social capital in the community both social value and cultural value. The element of social capital is basically owned by the public oil palm farmers in the village of Libo Jaya as social capital. However, to achieve and promote economic growth and prosperity in growing areas, the existence of social capital still needs to be increased role by involving the active participation of the village community of oil palm growers. Family economic welfare of oil palm farmers in the village of Libo Jaya can be measured by two approaches, namely the objective and subjective approaches. Using measurement objective approach set forth by various institutions such as BKKBN, BPS (2006), World Bank etc. While the subjective approach is measured through the satisfaction levels of society to meet the needs of food, non-food and investment. The results of study explained that the overall social capital in growing areas have not been able to prosper by the farmers subjectively. Indicators of subjective well-being is not the occurrence of satisfaction among households in oil palm farmers to meet the needs of food and non food and yet their inability to perform activities of each month saving. Unsatisfied for the welfare of the farming community is subjectively among oil palm farmer indicates that they have not been prosperous communities.Therefore, to encourage the establishment of welfare among the people of the oil palm farmers in the village of Libo Jaya are in need of a variety of approaches. One of them is by providing incentives. Providing incentives for institutionalization shape local practices that support the social safety net. For example perelek or village barn can also be an alternative to increase the capacity of social capital in poverty reduction. Explanation related to the utilization of social capital for the public welfare by the farmers in the village of Libo Jaya subdistrict Kandis can be seen in the table below.
|
5. Conclusions
- The results of this study explains that theoretically and empirically, gives the following conclusions:1. Territorial character plantations variable significantly affect the welfare of smallholders, ie, the main income of the SDA, monthly income is uncertain, vulnerable to natural disasters, limited clean water, lack of clean water, limited public transportation 4 wheels and limited access to roads or waterways. The coefficient of the direct influence of variables X1 (characteristics of the region) against the variable Y1 (welfare) of 0.408 and is positive and significant shows that the form of the effect of variable region characteristic to variable prosperity is directly proportional (positive) and significant. The coefficient of direct influence Variable norm (X2) on the welfare variable (Y1) of 0.408 and is positive and significant shows that the Variable norms against forms of influence Variable prosperity is directly proportional (positive) and significant. The coefficient of direct influence Variable network (X3) on Variable welfare (Y1) of 0.638 and is positive and significant shows that the form of influencing variables for networks with variable prosperity is directly proportional (positive) and significant, which means that the increase factor variable network will have a significant impact to increase factor variable welfare and the coefficient of direct influence variable trust (X4) of the variable welfare (Y1) of 0.621 and is positive and significant shows that the form of influencing variables of confidence in the variable prosperity is directly proportional (positive) and significant, which means that the increase factor variable trust will have a significant impact on the improvement of the welfare variable factors.2. The result of SWOT analysis taking into account the interests of external factors and internal as well as the linkages between the factors of the obtained alternative strategy is to improve the welfare of oil palm farmers in the subdistrict of Kandis Siak as follows: (1). Optimizing programs and regional development strategy to support the increased production of oil palm which was followed by an increase public facilities accesibility, (2). Encouraging the development of public infrastructure that can support economic and social activities of groups of smallholders so that in the long term can increase their welfare, (3). Increase empowerment programs aimed at RT members smallholders so as to deceive members of the RT and ultimately reduce dependence on oil palm., (4). Increasing the quantity and quality of human resources for the well-educated household members by the farmers so that they can manage the oil palm natural resourches as capital to drive the development of oil palm plantations welfare-oriented and (5). Improving accessibility to public infrastructure for oil palm growers group with concrete policies that can lower production costs.