-
Paper Information
- Paper Submission
-
Journal Information
- About This Journal
- Editorial Board
- Current Issue
- Archive
- Author Guidelines
- Contact Us
American Journal of Economics
p-ISSN: 2166-4951 e-ISSN: 2166-496X
2016; 6(2): 138-145
doi:10.5923/j.economics.20160602.05

Groundwater Irrigation and Cropping Pattern in the Ganga-Brahmaputra Alluvial Plain of Burdwan District, West Bengal
 Abstract
 Reference
 Full-Text PDF
 Full-text HTML
Subhadip Pal1, Abhijit Kumar Nandi2
1Research Scholar, Department of Agricultural Economics, Agricultural Economics, Faculty of Agriculture, B.C.K.V., Nadia
2Prof. and Head, Department of Agricultural Economics, Faculty of Agriculture, B.C.K.V., Nadia
Correspondence to: Subhadip Pal, Research Scholar, Department of Agricultural Economics, Agricultural Economics, Faculty of Agriculture, B.C.K.V., Nadia.
| Email: |  |
Copyright © 2016 Scientific & Academic Publishing. All Rights Reserved.
This work is licensed under the Creative Commons Attribution International License (CC BY).
http://creativecommons.org/licenses/by/4.0/

In this study, attempts have been made to overview the cropping patterns, the volume of groundwater used for different crops, total cost of cultivation per hectare including groundwater and net profits from different crops. The study has been conducted in the Katwa subdivision under the district of Burdwan, West Bengal, where both surface and groundwater are available for irrigation. Katwa subdivision is situated in the Ganga-Brahmaputra alluvial plain. Rice is the most dominant crop covered by 62%, and the remaining 38% by jute, potato, mustard, onion etc. Volume as well as cost of groundwater was maximum in the case of boro-rice and it was minimum in the case of jute. Cost of cultivation per hectare was maximum for onion and it was minimum for jute. The prices of agricultural commodities are usually determined by market factors of demand and supply. However, amount of profit per hectare was a maximum in the case of onion and was a minimum in the case of summer rice. Although, groundwater has played a key role in success of Green Revolution in India, excessive groundwater pumping can lead to the drying up of more shallow wells, requiring deeper tubewells, and increased pumping cost. From this study it may be suggested that to avoid the groundwater depletion and also to get higher returns, farmers should consider crop diversification. It should be recommended that although, rice is the main food in West Bengal a shift away from the rice-rice cropping pattern to rice-potato-onion-jute.
Keywords: Cropping patterns, Groundwater, Groundwater pricing, Net income from crops, Crop diversification
Cite this paper: Subhadip Pal, Abhijit Kumar Nandi, Groundwater Irrigation and Cropping Pattern in the Ganga-Brahmaputra Alluvial Plain of Burdwan District, West Bengal, American Journal of Economics, Vol. 6 No. 2, 2016, pp. 138-145. doi: 10.5923/j.economics.20160602.05.
Article Outline
1. Introduction
- At present, India is the second largest rice producer in the world (155.682 million MT). West Bengal is predominantly an agricultural state and its economy depends on agriculture. In West Bengal, geoclimatic variations and agriculture's dependence on rainfall have resulted in three distinct rice growing seasons: kharif rice (June/July to November/ December); autumn rice (March/April to June/July); and boro or summer rice (November/December to May/June). The natural catastrophe like floods, droughts etc. hinder the agricultural development. Flood and drainage congestion generally destroy the kharif crop in north-eastern part of West Bengal. Therefore, farmers especially the small farmers have to obtain boro rice as a second crop, and for this they have to depend up on groundwater. Waterwells have helped small farmers to obtain a second (and even third) crop per year, and made irrigation possible beyond the canal command area of government irrigation projects. As a result of technological advances, groundwater use has spread rapidly in recent decades, increasing reliability of irrigation supplies, encouraging crop diversification and expanding the cropping season. Even in cases where lifting of groundwater is costly. the poor can benefit from buying water in informal groundwater markets (Palanisami 1994; Saleth 1998). Groundwater pumping has also brought immense benefits for safe drinking water supplies, particularly in rural areas. More than 1.5 billion people in the world rely on groundwater for their primary source of drinking water (Clark et al. 1996). Global, annual groundwater withdrawals have been estimated at 670–800 km3. India, China, the United States, and Pakistan alone extract groundwater in the order of 325 km3 every year (Shah et al. 2000; Shiklomanov 1998).In India, the groundwater-irrigated area has increased 500% since 1960 (Shah, 2009). The green revolution was a major force in this growth. The adoption of new seeds and fertilizers provided great benefits and the benefits were the best under irrigation. Large investments had been undertaken in surface water projects to provide irrigation water to larger numbers of farmers. A number of other significant changes also took place in the late 60’s and 70’s (Brisco and Malik 2006). Electricity supply expanded in rural areas making pumping of groundwater easy and economical. Farmers realized that groundwater was abundant in many areas, especially in the large alluvial basins, and they could develop and apply water ‘just in time’ from groundwater sources, something which was not possible in the institutionally- complex and poorly managed canal systems. The result was a quite revolution, in which groundwater irrigation developed at a very rapid rate (Brisco and Malik 2006), while tank irrigation declined and surface water irrigation grew much more slowly.However, the biggest problems resulting from groundwater use are overdrafting and deterioration of water quality. Previous studies showed that groundwater irrigated crops generally result in higher yields due to better water control, as compared to surface irrigated crops (Shah et al. 2000; Singh and Singh 2002). However, overdraft has taken on alarming proportions in several states, and has led to increased competition among irrigators, but also between irrigation and domestic water users. Thus, there are both beneficial and harmful effects on groundwater use. The purpose of this study was to investigate the cropping sequences, economy of groundwater use, and cost of cultivation of different crops.
2. Methodology
- This study was conducted in Katwa Subdivision under the Burdwan district. (12° 12’ and 12° 33’ north latitude and between 75° 55’ and 76° 55’ east longitude). Burdwan district has 31 blocks of which 5 blocks (Katwa I, Katwa II, Ketrugram I, Ketugram II and Mongalkote) under Katwa Subdivision (Fig. 1). Burdwan district with its varied tectonic elements and riverine features is a transitional zone between the Jharkhand plateau which constitutes a portion of peninsular shield in the west and Ganga-Brahmaputra alluvial plain in the north and east. Katwa subdivision is situated in the Ganga-Brahmaputra alluvial plain. In this region the alluvial soil is formed of allovium brought down by the Ajay, Bhagirathi and their tributaries. These soils are sandy, well drained and slightly acidic in nature.
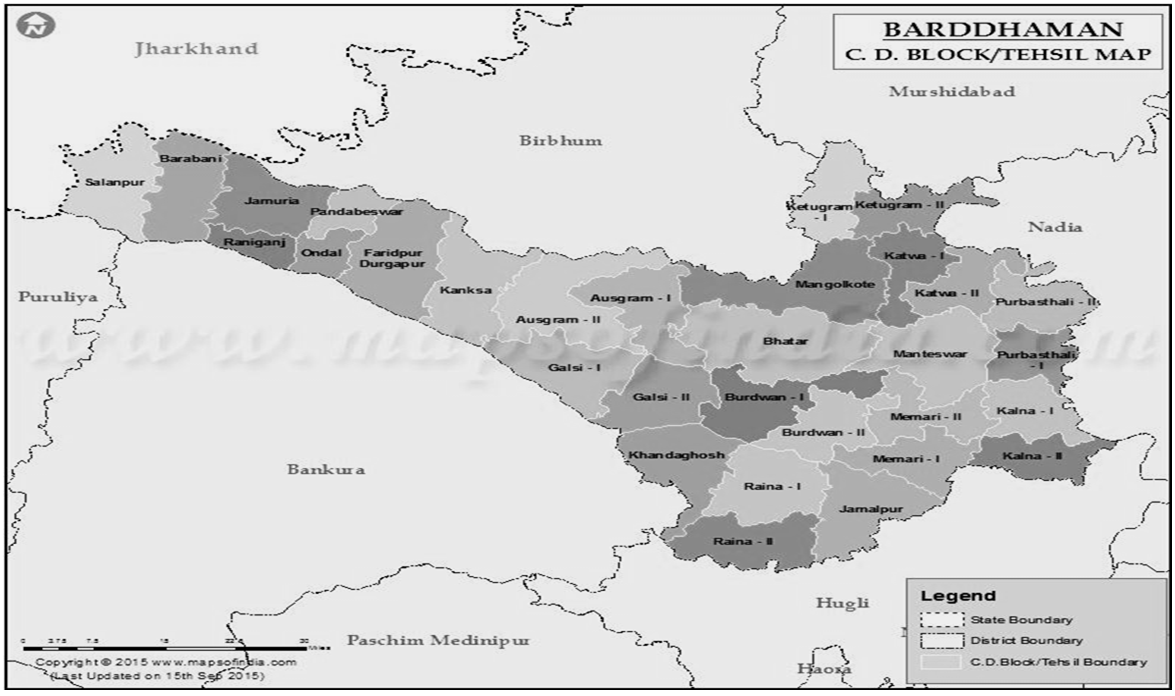 | Figure 1. Map of Burdwan district |
|
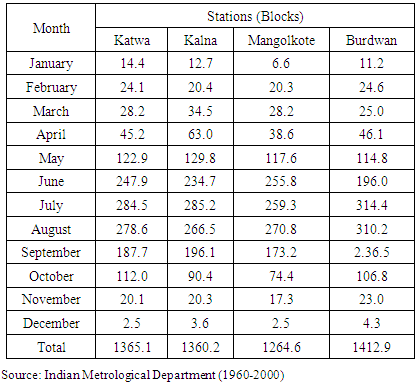
 | Figure 2A. Depth to Water Level Map – Pre-monsoon 2007 |
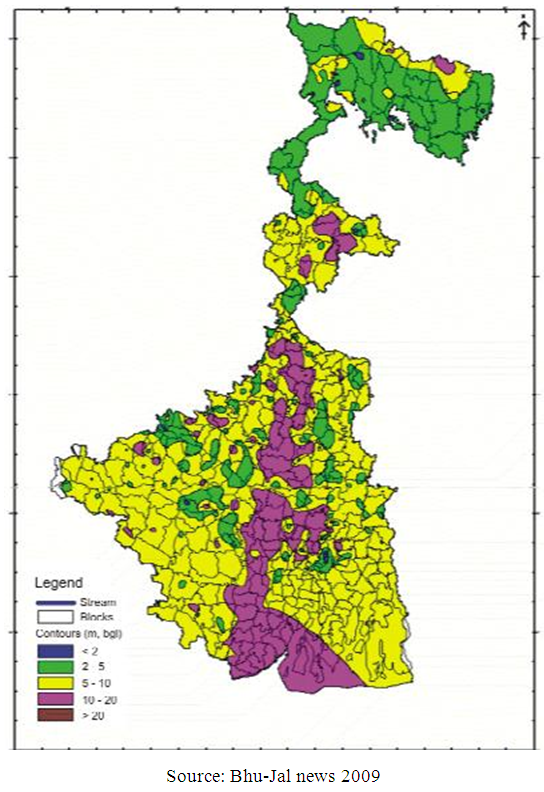
 | Figure 2B. Depth to Water Level Map –Post- monsoon 2007 |
3. Results
3.1. Cropping Patterns
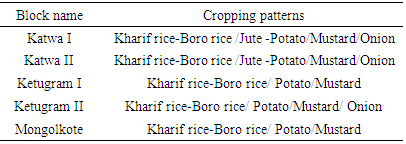
- Cropping pattern for each Block under present situation is furnished in Table 2. A wide range of cropping patterns was found in the study area, but the major patterns are rice based. Potato, oilseeds, jute, onion are the major non-rice crops.
|
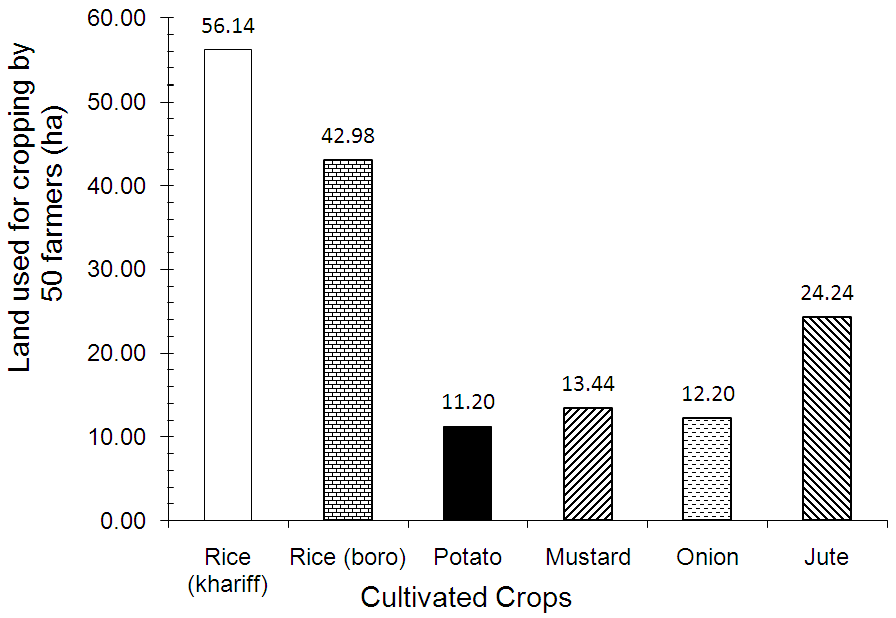 | Figure 3. Land used for different cropping (ha) by 50 farmers |
3.2. Economics of Groundwater
- Although, this subdivision is a rain-fed region, groundwater was used for every crop. A total of 253624.48m3 groundwater was used for the cultivation of 160 ha lands. Maximum amount of 3407.40 m3 groundwater per hectare was used for summer rice and a minimum amount of 319.04m3 groundwater per hectare was used for jute (Fig. 4). Therefore, there were significant variations among the crops in relation to use of groundwater per hectare (F = 108.249; df = 5, 299; P<0.0001).
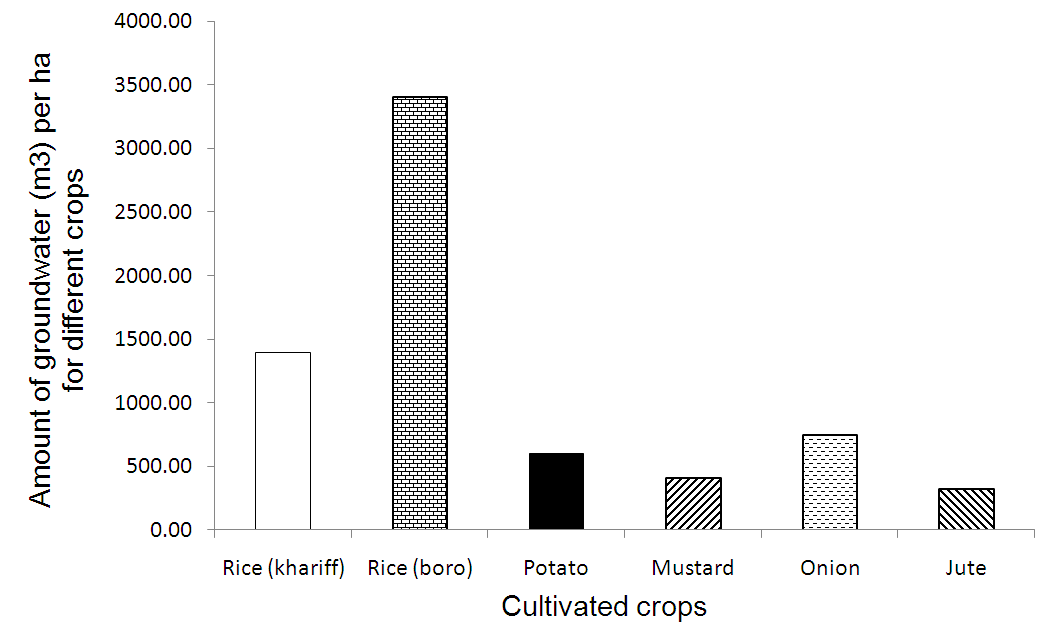 | Figure 4. Crop wise volume of groundwater for 6 selected crops |
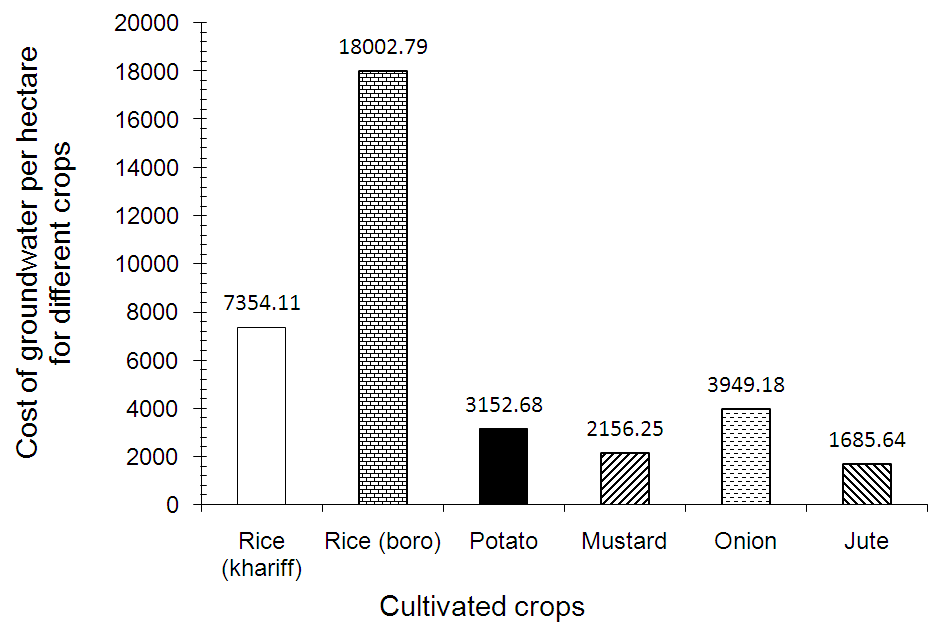 | Figure 5. Cost of groundwater per hectare for different crops |
3.3. Crop Economy and Cost of Cultivation
- Fig. 6 shows the production of each crop per hectare. Production per hectare was maximum of 230.93 qts in the case of potato and was a minimum of 14.61 qts in the case of mustard, and there significant yielding variations among the crops (F = 34.730; df = 5, 299; P<0.0001).
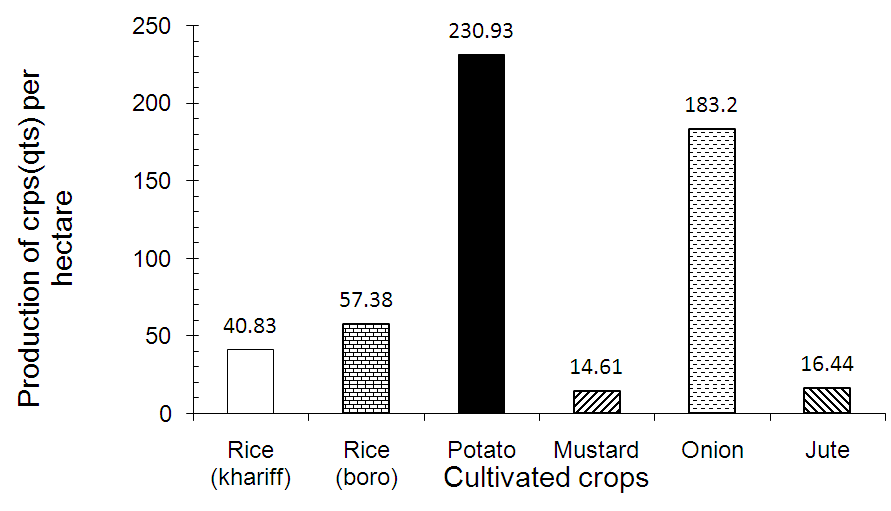 | Figure 6. Production of crops (qts) per hectare |
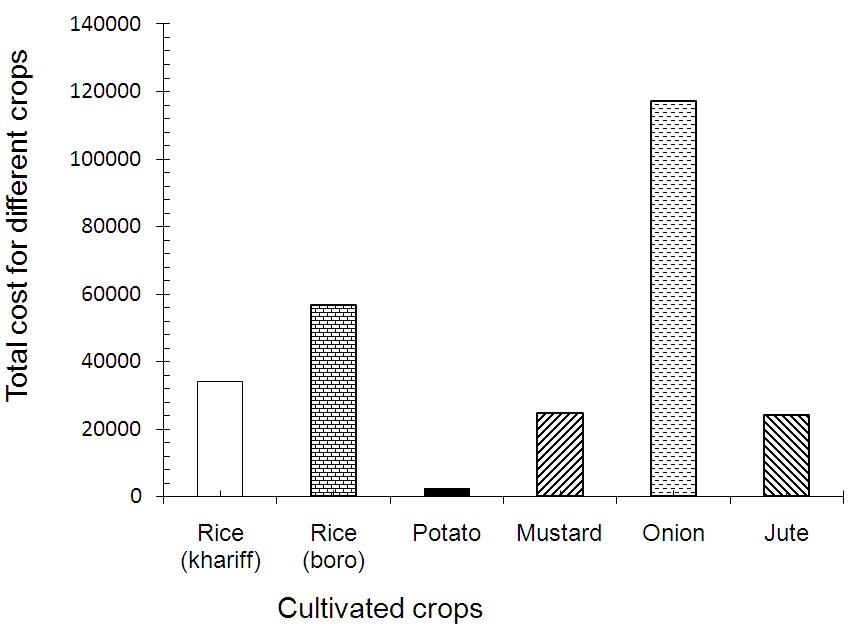 | Figure 7. Cost of cultivation per hectare for each crop |
3.4. Gross Income Analysis from Crops
- All the crops were considered for income analysis in this study. The gross income for water buyers was estimated from crop yield per acre multiplied by its unit price. Amount of profit per hectare was a maximum of Rs 52327.54 in the case of onion and was a minimum of Rs. 4502.05 in the case of summer rice (Fig. 8). Therefore, profit from cropping varied with crops ((F = 22.845; df = 5, 299; P<0.0001).
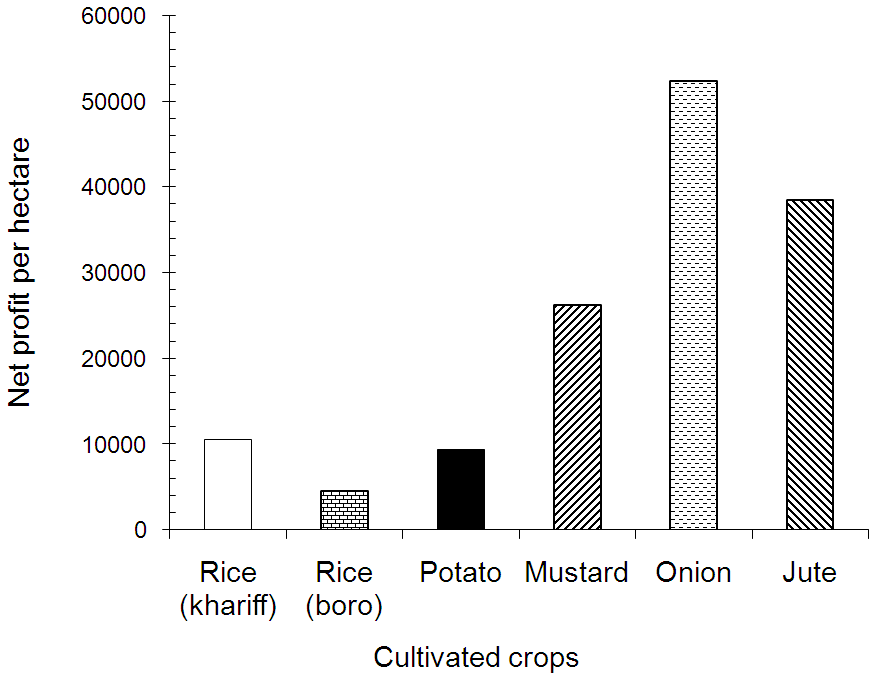 | Figure 8. Amount of profit (Rs) per hectare |
4. Conclusions
- West Bengal has a very little scope to increase agricultural production through expansion of land, as the cultivated land has remained constant and even decreased in many cases. The introduction of modern varieties of rice, wheat, oil seeds, potato and other crops has shortened the production cycles and increased cropping intensities and yield. In West Bengal rice production has been increased in 90’s with the cultivation of boro rice. With the expansion of boro cultivation, electricity for operating pumps is becoming a major agricultural input, and cost on this account will increase due to the high price of electricity in the world market. The higher cost of engines, pumps and installation cost of the tube well along with higher operation cost will make it less economical. Groundwater overdraft can lead also to significant problems in both water quality and water availability; thus, excessive groundwater use is a critical policy issue in balancing water uses for food production and the environment. Moreover, excessive groundwater pumping can lead to the drying up of more shallow wells, requiring deeper tubewells, and increased pumping cost. As the depth to water increases, the water must be lifted higher to reach the land surface. If pumps are used to lift the water (as opposed to artesian wells), more energy is required to drive the pump. Using wells can thus become rohibitively expensive.Contrary to the claim that rice cultivation is more profitable than alternative crops, this report has cited research showing that there are other alternatives such as mustard, potato, onion or jute which could yield higher returns than rice. In order to make these alternatives feasible for implementation, farmers will have to have access to agricultural inputs as well as irrigation water. The water requirements for rice are much greater than these alternative crops, thus making it extremely important that water resources are used in the most effective and efficient manner. From this study, it may be suggested that to avoid the groundwater depletion and also to get higher returns, farmers should consider crop diversification. It should be recommended that although, rice is the main food in West Bengal a shift away from the rice-rice cropping pattern to rice-potato/onion/jute. In this context, it should be noted that crop diversification had been one of the suggestions to bring changes in Punjab’s agriculture since 1986. Two Johl Committee reports (1986 and 2002) recommended a shift away from the wheat-rice cropping pattern to a wheat-maize one.
ACKNOWLEDGEMENTS
- We are sincerely grateful to the editor of this journal and also to the reviewers of this paper for their valuable comments.