American Journal of Economics

p-ISSN: 2166-4951    e-ISSN: 2166-496X

2016;  6(1): 50-60

doi:10.5923/j.economics.20160601.07


Economic Growth, Employment and Poverty Reduction: The Case of West African Countries

Gülten Dursun, Blessing Ogunleye

Department of Economics, Kocaeli University, Kocaeli, Turkey

Correspondence to: Gülten Dursun, Department of Economics, Kocaeli University, Kocaeli, Turkey.

Email:

Copyright © 2016 Scientific & Academic Publishing. All Rights Reserved.

This work is licensed under the Creative Commons Attribution International License (CC BY).
http://creativecommons.org/licenses/by/4.0/

Abstract

The purpose of this study is to examine the interplay of economic growth and employment in the reduction of poverty amongst West African Countries. Cross sectional country level data between 1991 and 2010 is used to examine the relationship existent between these variables within the West African region. The empirical result of the study supports a positive effect between economic growth and poverty reduction in West Africa. In terms of the influence of employment on poverty reduction, it can be observed that there exists a positive relationship; however, this relationship tends to be statistically insignificant. Employment-intensive growth is necessary but not sufficient within the region’s confine. That is, it is unlikely that the poor possess sufficient skills necessary to take advantage of the new employment opportunities evident within the region; thereby propelling a reduction in broad-based employment growth. In addition to this, employment does not coincide with poverty eradication because it is not in any way linked to the economic sectors that affect the poor.

Keywords: Economic Growth, Employment, Poverty Reduction, West African Countries, Panel Cointegration, DOLS, FMOLS

Cite this paper: Gülten Dursun, Blessing Ogunleye, Economic Growth, Employment and Poverty Reduction: The Case of West African Countries, American Journal of Economics, Vol. 6 No. 1, 2016, pp. 50-60. doi: 10.5923/j.economics.20160601.07.

1. Introduction

Unemployment is a multidimensional phenomenon, which exhibits an imbalance in economic activities and is often argued to impose a big problem in every society. Also due to the impact of unemployment on the social structure of societies, it is possible to establish its existence as a social phenomenon. The economic and social effects of the rise in unemployment and the complexity of these effects is of major importance in understanding the causes and consequences of this phenomenon and also plays a vital role in the determination of measures necessary to curb its spread. On the other hand, it is necessary to state that economic growth is one of the main objectives of economic policy. In this regard, investment is an important economic tool meant to overcome the problem of unemployment in a given economy and is also one of the most important factors which lead to the achievement of a sustainable economic growth. Particularly, due to the population pyramids of the less developed and developing countries, efforts are on to counter this rising problem. According to UNDP/ILO, more than 20% of the African population comprises of young people between the ages of 15-24. Despite the presence of demographic transformation, there still exists a continual trend of high birth rate. Demographic growth as well as increase in the rate of active population continues to rise. In African countries, most especially West African countries, there is an upward rise in growth rate. The increase in growth rate from time to time reaches a point where it doubles the rate of demographic growth. The rate of unemployment is estimated to between 10-20%1. Amongst the employed population, the level of insecurity has remained quite high. According to ILO, in 2009, the rate of employees found working in vulnerable jobs was 79% and this is not expected to decline until 2015. As a result of the fact that employment creation shows a lower rate of growth when compared with the increase in active population, there continues to be a rise in unemployed workforce (UN, 2013:32).
West Africa consists of countries like; Benin, Burkina Faso, Cape Verde, Côte d'Ivoire, The Gambia, Ghana, Guinea, Guinea-Bissau, Liberia, Mali, Mauritania, Niger, Nigeria, Senegal, Sierra Leone, Togo and happens to be one of the world's poorest regions. Persistent poverty and rising income inequality remains a socio-economic problem amongst West African countries. 28% of the total African population constitutes West Africa. The average population growth rate is 2.2% and 41% of the population live in urban areas. West Africa's largest cities are located on the coast. As of 2012, the total population of the West African region approached 300 million. The non-agricultural population is approximately equal to the agricultural population. In the 1950’s, the population of West Africa as a whole was just 72 million with 92% of its population participating in the agricultural sector (OECD, 2012). In most OECD countries, population growth rate is seen at a rate of 0.03% and considering the increasingly aging population, it can be said that population is rising rapidly in West Africa. In 2020 and between 2030-2035, the population of the West African region is expected to be 400 million and 500 million respectively. In West Africa, as of 2010, the highest population density (number of people per km2) was recorded in Nigeria (171.5), Gambia (153) and Cape Verde (124). In recent years, most especially 2000’s, African economies recorded an annual growth rate of 5% in real terms, a feat considered as quite impressive. According to the IMF's forecast, between 2011-2015, 7 countries from the Sub-Saharan region will be on the direction of being amongst the 10 fastest growing economies of the world (The Economist, 2011). However, it does not imply that this strong economic growth supports poverty alleviation and productive employment.
The aim of this study is to examine the dynamic causal relationship between poverty, economic growth and employment in West African countries within the period of 1991-2010 using panel cointegration model. After the introduction, the article consists of three sections. In the second section, the theoretical and empirical connection between economic growth, employment and poverty will be examined. In the third section, the empirical model and data will be appropriately defined. The empirical analysis is shown in section 3, while results will be discussed in chapter 4.

2. Literature Review

2.1. Linkage between Economic Growth, Employment and Poverty

An Economic growth, poverty reduction and the connection between employment and equity are quite complex but extremely important (Acharya, 2006:4576). In this regard, there is a substantial emphasis of literature (WB, 2006; Khan, 2001; Birdsall et al. 2005, Osmani, 2004). Economic growth is considered to be important in terms of creating new jobs for the poor. High growth rates in the latter stages of development are assumed to eliminate the wage gap between skilled and unskilled labor (Galor and Tsiddo, 1996). The relationship between poverty and employment is understood to be a joint process between the economic growth which brings about an increase in productivity and that which leads to a reduction in poverty. Poverty reduction depends on the strength of each link in the process. These links are economic growth rate, the output elasticity of demand for labor and the ability of the poor members of the labor force to respond to increasing demand for labor. When these connections are simultaneously joint, poverty is said to decline (Khan, 2001:2).
Conceptually, the link between growth and poverty can be addressed with strong emphasis on two levels (Islam, 2004:3). Firstly, when taken from a macroeconomic perspective, these links can be conceptualized in terms of the average productivity of the employed labor force. In this case, improvements in productivity will reflect on real wages. In the microeconomic perspective, low efficiency of economic activities occurs through the same link. Relatively low average productivity of labor may be due to lack of sufficient capital or technological ineffectiveness. High growth rates, an increase in productive capacity, together with an increase in efficiency may lead to the emergence of employment opportunities. With a high level of efficiency, the integration of expanding economic activities between the unemployed and underemployed is likely to become possible. Within this process, higher productivity and also an increase in income can be achieved. It should also be noted that, higher expertise or a more advanced technology may require a transition to new jobs.
Labor markets especially in developing countries serves as an important mechanism in the transmission process of macroeconomic and structural adjustment policies. A typical labor market is composed of three parts (Agenor, 1996, 2005). First is the rural sector. In some regions of sub-Saharan Africa, a significant proportion of the labor force continues to work in rural areas. The second is the informal urban sector. In this sector, self-employment, limited hired labor, and wage flexibility is very high. Also, the security of workforce is quite low, and regulations directed towards the workforce are insufficient. The third is the formal (private and public) urban sector. In this sector, workers are employed on contract basis and compliance with regulations concerning labor market is relatively high. In the urban sector of developing and less-developed countries, the proportion of informal workers is a big deal. Amongst the most important reasons for this is the fact that, unemployment insurance or pay (compensation) schemes are not properly regulated. In this case, the workers cannot afford to remain unemployed for a long period of time (Agenor, 2005:383).
Figure 1 shows the impact of economic growth on poverty through employment channels. This effect occurs as a result of the increase in income of the poor through improvement in the quality and quantity of employment. In this sense, the growth elasticity of employment which shows the growth of employment creation capacity is important. However, higher income elasticity does not translate into higher income for the poor. Some other factors are also important and these include changes in labor productivity, and real gains. But it does not mean all these factors would cause great opportunities for the poor. Poverty reduction is highly necessary. In the same vein, it is important to be able to secure available opportunities connected to the demand and supply of labor. It is therefore necessary for the poor to be located within the sphere of economic processes (Shalini, 2010).
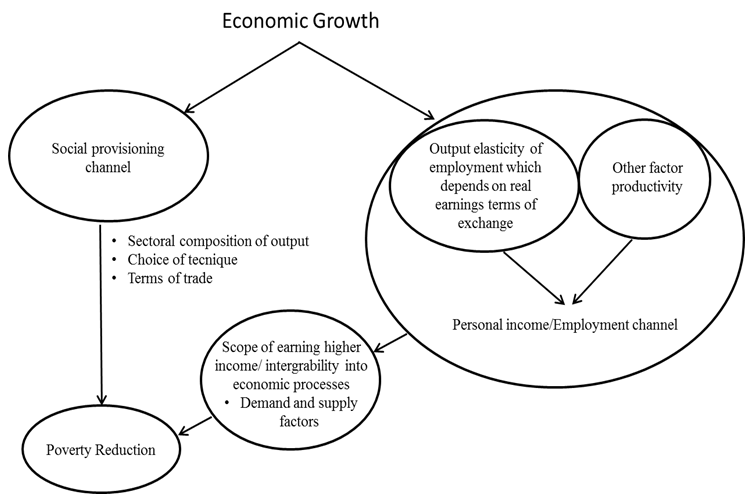
Figure 1. Virtuous Circle of Links between Growth, Employment and Poverty Reduction. Source: Shailini (2010)
Rapid economic growth may not always be an effective means of reducing poverty (Osmani, 2004). In particular, in developing economies, informal employment is rising much more faster than formal employment (Heintz and Pollin, 2003). While the macroeconomic policy choice of a country is important, the level of technology is also an important determinant factor of the country’s level of employment. For employment-intensive growth to succeed in the reduction of poverty, while making choices of economic policy, high priority should be given to employment. The composition of output sector, the size of public employment, and such other factors as the use of efficient technologies are of great necessity (Akçoraoğlu, 2010). In the studies of Loayza and Raddatz (2006), in unskilled intensive sectors such as; agriculture, construction and manufacturing, results were drawn that growth had a great influence on the reduction of poverty due to their employment effects.
Kraay (2004:1) found that roughly “half of the variation in short-run changes in poverty can be explained by growth in average incomes. In the medium to long run, between 66 and 90 percent of the variation in changes in poverty can be accounted for by the growth in average incomes”. But then, Satchi and Temple (2006) obtained the finding that, the growth observed in the agricultural sector will in contrast increase the poverty level of the urban sector. Odhiambo (2004), in his study of South Africa made use of per capita household consumption and death rates as proxies in the measurement of poverty rates.
The empirical result arrived at was that, in both directions, there exist no causal relationship between growth and poverty. The phenomenon of “jobless growth” appears much of Africa (Aryeetey and Baah-Boateng, 2007). The ILO estimates that nearly 30% of all workers worldwide are still poor – more than 910 million- are living with their families below the US $2 a day poverty line (ILO, 2012).
Studies on poverty-growth relationship are quite debatable. The discussion in this regard is related to the direction of causality relationship and the size. Akanbi and Du Toit (2011) in their study of the Nigerian economy developed a macroeconomic model which analyzes a permanent divergence existent between growth and poverty. The supply-side constraint which goes against the demand-side constraint was observed as a main factor inhibiting the growth and development of a country. This result was drawn with evidences that support this hypothesis. Islam (2004) used two important independent variables in his cross-country study of the annual changes in poverty rate. First variable, GDP growth rate and the second, employment elasticity with respect to output. It was determined that each of the variables under study had a strong effect on one another. However, Islam (2004) observed that the relationship between poverty and growth does not change and that development in the employment and labor market plays a vital role in the reduction of poverty.
Most studies conducted indicates the heterogeneous nature of poverty-growth relationship and it thereby focuses on the source of heterogeneity (Bourguignon, 2003; Kakwa area, is Khand, and Son, 2004; Lucas and Timmer, 2005; Ravallion, 2004). In these studies, the main determinant of growth and poverty reduction in relation to socio-economic conditions of the population were focused upon. These conditions include, income inequality, literacy rates, urbanization level, and outputs which support poverty reduction such as mortality rates are variables that affect the level of growth.

2.2. Growth, Employment and Poverty in West Africa

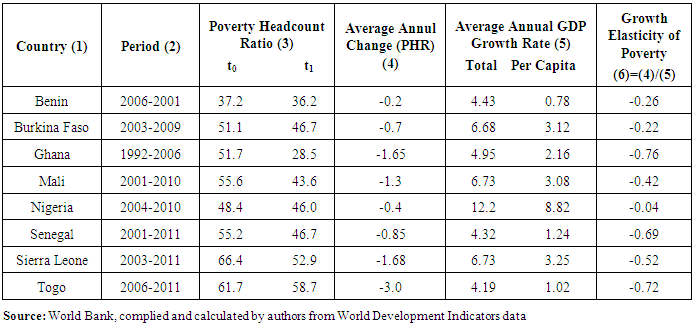
As in Table 1, by simultaneously observing poverty reduction rate and growth rate per capita income, the relationship between growth and poverty can be properly examined. Between 2004-2010, Nigeria recorded the highest growth rate but could not provide a significant increase in the rate of poverty reduction. Its growth elasticity of poverty is relatively low compared to other countries2.
Table 1. Relationship between Growth and Poverty in Selected West Africa Countries
     
Even despite the fact that Burkina Faso grew faster than Benin with a growth rate of 3.12%, its growth elasticity of poverty is much lower (-0.22%) than that of Benin’s (-0.26%). One of the conclusions emerging from the Table 1 is that a positive relationship exists between growth rate and poverty reduction. With this result, the emerging consensus is that, in order to initiate a reduction in poverty, economic growth is of major importance (Osmani, 2004). One of the results from the table is that, despite high growth rates, the rate of poverty reduction is inadequate. The effect of growth on poverty reduction is seen through structural changes and this structural change will depend on the effect of employment on wages. When considering the fact that, the effect of high growth on poverty reduction is insufficient; the need to redress the imbalances in income distribution emerges.
According to other sub-regions in the African continent, West Africa prides itself as the fastest growing. Nigeria is the continents second largest economy. From the period of 2001-2002, the West African region maintained a continual rapid growth. This period was characterized by relative political stability. A growth rate of 6.7% was recorded in 2013 with an estimation of it approaching a rise of 6.9% in 2014. In this region, mineral and oil fields continue to attract investment. In particular, Burkina Faso, Ghana, Guinea, Liberia, Niger, Nigeria and Sierra Leone happens to be the most important center of attraction for investments (The Guardian, 2014). However, the main source of growth in Nigeria other than oil include, agriculture, trade, information and communication technologies and other services have been realized. The petroleum sector accounts for 37% of GDP and government revenue constitutes about half of this value.
However, the petroleum sector is worsening due to theft, pipeline vandalism and low investment. In Ghana, oil and gas production maintains an increasing trend. This situation has led to an increase in private and public investment. In West Africa, determining whether or not the economic growth will be sustained depends on the ease of internal and external risks. Internal risks in the region include; weak institutional capacity, infrastructure deficit, political uncertainty and high poverty rate while external risks include global economic slowdown of the continent and this can result into a situation of volatility in the demand and prices of goods and also uncertainty in capital flows (AER, 2013:39).
Generally, in Sub-Saharan Africa (SSA) countries, the unemployment rate in the last five years amounted to 7.6% (ILO, 2013). A relative portion of the working-age population is unemployed. But other than open unemployment, the size of unproductive labor (vulnerable employment, low quality employment, underemployment) gives important information on the employment problems evident in these countries (Szirmai and al., 2013). Table 2 provides the employment rate and total employment of selected countries within the West African region. Vulnerable employment is stated alongside total employment. During the period 1991-2010, apart from Mali and Togo, no significant change was observed in the employment structure of the population. When total employment is at a high proportion, it is understood that it constitutes a non-productive employment. These economies engage in an intensive production of primary commodities and depends solely on the export of these goods. It is outrightly necessary for West African countries to improve the quality of their economic growth. Analytical studies (i) higher and sustainable (less volatile) per capita income growth and, (ii) "inclusive" reveals that growth will have a greater impact on poverty reduction (UEMOA, 2006: 53). While ‘inclusive’ is talked about as a growth encouraging mechanism, it also proposes that labor intensive industries should be supported.
Table 2. Employment Rates and Vulnerable Employment in Selected West African Countries
     
Across the continent of Africa and most especially in the West African sub-region, for a strong broad-based economic and social development, poverty inherent amongst millions of Africans needs to be eliminated, also the level of inequality needs to be reduced but unfortunately, the growth evident in this region has failed to create any form of transformation. This is because the growth of Africa occurred as a result of low labor density producing merely primary commodities. Thus, high unemployment amongst the continent’s population, especially between youth and women continues to be a major problem (AER, 2013).

3. Econometric Methods and Data

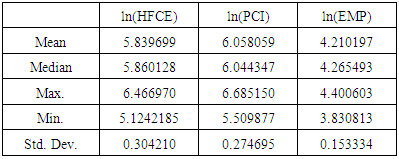
In this study, the relationship between economic growth, employment and poverty reduction is investigated. This study uses panel data consisting of 7 cross-sections and each cross-section covers a time period of 20 years from 1991 to 2010. Our database includes seven West African countries: Benin, Burkina Faso, Gambia, Mali, Senegal, Sierra Leone, and Togo. Real GDP per capita and Household Final Consumption Expenditure Per Capita data measured in constant 2005 US dollars. We use real GDP per capita as the measure of affluence and economic growth. Employment refers to the employment to population ratio, 15+, total (%) (modeled ILO estimate). All data are expressed in natural logarithms. All data are obtained from World Bank Development Indicators (WDI) database published by the World Bank. The West African region consists of 16 individual countries but the choice of the countries used in this study is constrained by the availability of data; thereby propelling the need for its limitation to 7 countries.
The co-integration tests are applied to determine the existence of long-run relationship among the variables. The Engle-Granger (1987) method is a single-equation approach and it only determines the presence of long run relationship. Another property of co-integration is that the variables should be integrated of the same order. For this purpose, the panel unit root test is applied on the series under consideration to check the order of integration. The panel unit root tests differ from the standard (DF and ADF approach) time series unit root tests as (Azomahou at al., 2009):
i) The panel data allows for different degree of heterogeneity between the cross-sections;
ii) In panel data unit root analysis, one cannot be sure of the validity of rejecting a unit root. The formulation of null hypothesis differs under different panel unit root test;
iii) The power of panel unit root test increases with the increase in panel series;
iv) The additional component of cross-sections in panel data provides better information as compared to the standard ADF in time series.
A number of panel data unit root tests have been proposed such as: Maddala and Wu (1999), Choi (2001), Levin, Lin and Chu (2002, henceforth LLC), and Im, Pesaran and Shin (2003, henceforth IPS). These tests generally based on the AR(1). The LLC test it is assumed that the autoregressive coefficient (which indicates whether or not unit roots are present) is homogenous. Although the autoregressive coefficient is assumed homogenous, the LLC test allows for heterogeneity by allowing fixed effects and country-specific time trend. The IPS test involves computing the ADF test for each individual country and the mean of all countries ADF statistics gives the overall t-test statistic. Maddala and Wu (1999) proposed a panel unit root test based on Fisher (1932). Fisher’s study supports that of Im et al. (2003), which allows for individual unit roots, but improves upon it by being more general and more appropriate for unbalanced panels. Maddala and Wu’s test (ADF-Fisher) is based on combing the observed significance levels (p-values) from the different tests.
According to Maddala and Wu (1999:635):
“The advantage of this test is that it does not require a balanced panel as in the case of the IPS test. Also, one can use different lag lengths in the individual ADF regression. Another advantage of the Fisher test is that it can also be carried out for any unit root test derived. The disadvantage is that the p-values have to be derived by Monte Carlo simulation. The IPS test is easy to use because there are ready tables available in the paper for E(ti,T) and V(ti, T). However, these are valid only for the ADF test”.
This study carries out its estimation based on the model below:
(1)
where ai are country-specific fixed effects and δit are country-specific time trends, included to control for any country-specific omitted factors that are either relatively stable over time or evolve smoothly over time. The variable ln (HFCEit) is the log of Household Final Consumption Expenditure Per Capita (constant 2005 US$) which is used as proxy in expressing the actual level attributed to poverty in the countries under study and this is seen to span over time periods t = 1, 2, ..., T and countries i = 1, 2, ..., N, ln (PCI) is the log of the GDP per capita (constant 2005 US$), and ln (EMP) is the log of Employment to Population Ratio. Descriptive statistics of the data are presented in Table 3.
Table 3. Descriptive Statistics of the Variables
     
The null and alternative hypotheses are seen in the following underlying form:

3.1. Panel Unit Root Tests

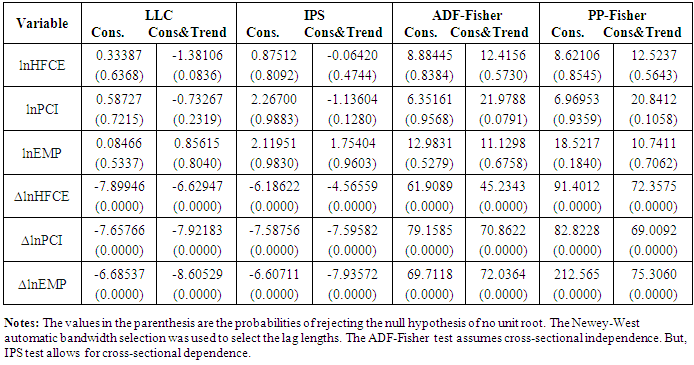
The first step of panel co-integration analysis is to investigate the stationarity properties and to determine the order of integration of the variables. For series to be co-integrated they have to be of the same integrated order. Therefore, we used four panel unit root tests LLC, IPS and Fisher- ADF and Fisher- PP tests suggested by Maddala and Wu (1999). In the test equation, two specifications are considered. The first specification includes only an intercept, and second, includes both a trend and intercept. Especially LLC and IPS tests are widely used panel unit root analysis in the literature on panel co-integration. While LLC (2002) suppose that the cross-sectional units share a common unit root process, IPS (2003) presume that the cross-sectional units have individual unit root process.
Results for the panel unit root tests are illustrated in Table 4. This table summarizes the unit roots tests for the panel series and shows that all variables which constitute the series is non-stationary and possesses unit root at level (more than the 0.05 significance level) i.e. the acceptance of the null hypothesis of unit root and non-stationarity. To test the order of integration, the panel unit root tests are then applied at first difference.
Table 4. Panel Unit Root Tests on Panel Series at Levels (With Individual Intercept and Individual Intercept/Trend)
     
From these panel unit root tests we conclude that all variables are integrated at order of I(1). The null hypothesis can therefore be rejected on the basis of the 0.05 level of significance. Since the panel series is integrated of the same order, the co-integration tests can be applied in order to ascertain the existence of a long-run relationship between the variables under study.

3.2. Panel Cointegration Test

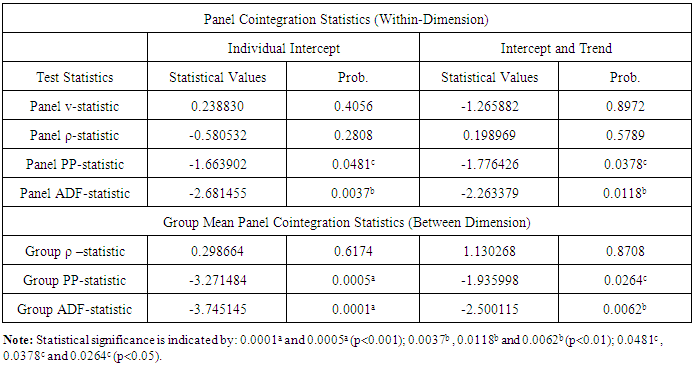
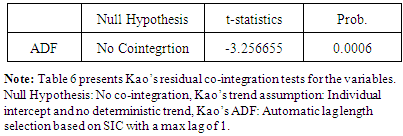
In this study, the Pedroni (1999) and Kao’s panel co-integration tests are used to examine the existence of a long-run relationship between the variables under study. The implementation of Pedroni’s co-integration test firstly requires estimating the following long run relationship (Pedroni, 1999). The co-integrating equation takes the form:
(2)
For t = 1, …, T , i = 1, …, N and m = 1, ..., Mwhere T refers to the number of observations over time, N refers to the number of individual members in the panel, and M refers to the number of regression variables.
The structure of estimated residual is as follows:
(3)
where Ψi is the autoregressive coefficient of the residual εit from Equation 2.
Pedroni (1999), shows that the panel v-statistic is a one-sided test where large positive values reject the null hypothesis of no co-integration. The results for which are reported in Table 5.
Table 5. Pedroni's Residual-Based Panel Cointegration Test (with Individual Intercept and Individual Intercept/Trend)
     
Out of the total seven statistics, four statistics that include Panel PP-statistic, Panel ADF-statistic, Group PP-statistic, and Group ADF-statistics have probability values closer to zero which indicate the rejection of null hypothesis of no co-integration. It can be suggested that a long-run relationship exists between the variables. That is, they move together towards a stable equilibrium stage. It should however be noted that, when two or more variables have a long-run relationship, it does not completely interpret that there exists a causality between them. In order to determine this, a causality test needs to be carried out.
Kao’s residual panel co-integration test is based on the assumption that homogeneous slope coefficients exists across countries (Kao, 1999). Kao’s tests outperform Pedroni’s tests when the time-dimension of the panel is small (Gutierrez, 2003).
Table 6 provides results for the Kao’s (1999) panel co-integration test. The calculated value of t-statistic is greater than the critical value that indicates the rejection of null hypothesis of no co-integration because the variables are co-integrated. Thus, it can be concluded that a long-run relationship exists between the variables.
Table 6. Kao’s Residual Panel Cointegration Test (ADF)
     
Since co-integration exists between the variables under study, an estimation of the model using the Fully Modified Ordinary Least Square (FMOLS) method can be initiated. The Pedroni and Kao tests indicate that there is a long-run relationship between the variables under study. Since there is a long-term relationship in the panel group, Dynamic Ordinary Least Squares (DOLS) and Fully Modified Ordinary Least Squares (FMOLS) estimators were used in order to estimate the panel co-integration vector in the study. Spurious regression, that is, when the series are nonstationary, it is a result of the use of normal OLS techniques. In this situation, specific panel co-integration techniques have to be used. In the case of homogeneous and near-homogeneous panels, the coefficient of co-integration can be estimated by a fully modified (FM) estimator (Phillips, 2000). This method is non-parametric as it employs kernel estimators of the nuisance parameters affecting the asymptotic distribution of the OLS estimator. It overcomes the possible problem of endogeneity of the regressors as well as the autocorrelation of residuals. Alternatively, Kao and Chiang (2000) and Mark and Sul (2003) proposed a dynamic least square estimator (DOLS). This estimation procedure is parametric and has the advantage of computing convenience (Bodart et al., 2011). DOLS and FMOLS estimators were developed since the co-integrated regression model which was composed of series having a long-term relationship between each other showed deviated results when it was estimated by least squares method.
In the Dynamic Ordinary Least Squares (DOLS), the long-run regression is augmented by lead and lagged differences of the explanatory variables (Basher and Mohsin, 2003:2). In order to ensure the Panel DOLS regression is carried out effectively, there are certain necessary conditions it needs to satisfy. The first amongst these conditions is that the level data of all variables under study must be in a non-stationary form, while the other condition states that, the variables must be stationary at first difference (Stock and Watson, 1993). In the DOLS panel analysis, there is an assumption based on the existence of a homogeneous co-integrating vector. While carrying out this analysis, the presence of heterogeneity has a limitation to fixed effects, time trends and short run dynamics. It should also be noted that a pooled regression analysis brings about the Panel DOLS estimator.
From the DOLS analysis in Table 7, it can be concluded that per capita income is a significant variable capable of explaining poverty reduction and that there exists a positive relationship between per capita income and poverty reduction. That is, a 1 dollar increase in Per capita income (PCI) brings about a 0.907282 rise in the level of poverty reduction. It can be said that, employment has no effect on poverty reduction because it exceeds the 5% level of significance.
Table 7. DOLS Panel Test
     
Table 8. FMOLS Panel Test
     
From the FMOLS analysis above, it can be concluded that per capita income is a significant variable capable of explaining poverty reduction and that there exists a positive relationship between per capita income and poverty reduction. That is, a 1 dollar increase in Per capita income (PCI) brings about a 0.862327 rise in the level of poverty reduction. It can be said that, employment has no effect on poverty reduction because its value exceeds the 5% significance level.

3.3. Panel Causality Test

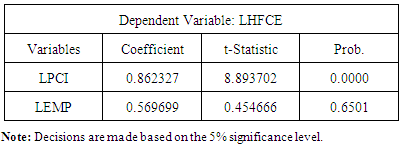
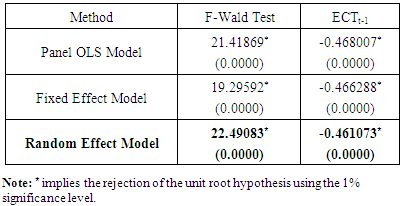
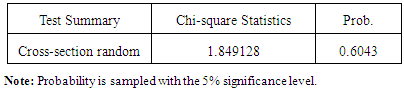
Whenever a model is found to be co-integrated it indicates the possible existence of causality (Apergis and Payne, 2009). In a bid to establish the causal relationships between the variables, an error correction model in conjunction with panel data is applied. This includes a test using the Pooled Ordinary Least Squared Regression, Fixed Effect model and Random Effect model. In the pooled regression, the whole observations are pooled together neglecting the cross section and time series nature of the data. By doing this, the coefficients (including the intercepts) are implicitly assumed to be the same for all individuals, leading to a situation whereby we deny the heterogeneity or individuality that may exist amongst the countries under study. Fixed effects regression is the model to use in order to control for omitted variables that differ between cases but are constant over time. It allows for changes in the variables over time so as to estimate the effects of the independent variables on the dependent variable, and is the main technique used for analysis of panel data (Borenstein, et al., 2009). In a case whereby some omitted variables may be constant over time but vary between cases, and others may be fixed between cases but vary over time, then both types can be included by using random effects (Stock and Watson, 2010).
The Error correction term captures the long run dynamics of the observed variables and also at the same time indicates long run causality. The rule which governs the Vector Error Correction model states that, the value of the error term’s coefficient must be between -1 and 0, and its probability must maintain a 5% significant level. Table 9 shows that the three models are statistically significant. Therefore, the endogenous adjustment from short run to long run works in all three models. At the end of the first period, the short and long run imbalances will reduce by 46%. Therewithal, the variable is expected to return itself to equilibrium at the end of the second year (1/0.46=2.17). The F-Wald Test indicates the short run relationships between the economic variables under study. The probability of all models tested is statistically significant maintaining a 5% significant level. In this vein, it can be concluded that the three models support the existence of a short run relationship. In conclusion, the empirical analysis portrays the fact that, a long run and short run causality relationship exists between the economic variables under study.
Table 9. Panel Causality Results
     
In this study, the Hausman (1978) specification test is used, and it was found that the random effects model is indeed the most appropriate specification qualitatively. Hausman Test is performed to determine whether fixed effects or random effects model is the preferred model specification. Most researchers often rely on the Hausman test (e.g., Greene, 2008). The values of Hausman Test from Table 10 show that the random effect is not rejected.
Table 10. Hausman Test Result
     
From the values evident in Table 10, probability is statistically insignificant which justifies the acceptance of the null hypothesis and rejection of the alternative hypothesis. Therefore, the result of the Hausman test states that, the random effect model is the most appropriate model.

4. Conclusions

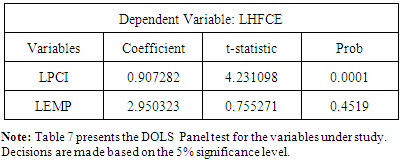
In this study, we investigated the dynamic causal relationship between poverty, income per capita and employment in seven West African Cuntries within the period of 1991-2010 using panel cointegration technique. Panel unit root tests suggest strongly that these series are integrated variables at order of I(1). The panel cointegration test based on Pedroni residual cointegration tests and Kao residual cointegration tests were used to test the cointegration of the variables. DOLS estimator and FMOLS estimator were employed in order to determine the long-run relationship of the variables amongst the selected West African countries. Panel cointegration tests shows the evidence of a cointegration relationship amongst the variables of our model.
According to the results obtained from the study, the FMOLS and DOLS’ co-integration coefficients of the seven countries shows that per capita income has a positive and statistically significant influence on poverty. It however reveals that, employment has no influence on poverty. This is a quite reasonable outcome. When we take a critical look at the employment structure of West African countries, it is obvious that a large majority of total employment has the attributes of non-productive employment (in terms of, vulnerable employment, low quality employment, and underemployment). The West African economies engage in an intensive production of primary commodities and depend solely on the export of these goods. As a result of this, employment is of low quality and this dependence stands as one of the greatest obstacle preventing the attainment of a high and sustainable income growth within the West African region. In this regard, an encouragement of ‘inclusive growth’ through a long-term improvement in the quality of employment will be able to create an impact in poverty reduction.
In conclusion, after determination of the long-term co-integration relationship between the variables, the Error Correction model (VECM) was used in examining the causal relationship existing between the variables. The Error Correction term’s negative and statistically significant nature indicates the significance of the model. This means that deviations from equilibrium value of poverty amongst West African countries in the short run are corrected in the long run. According to the obtained lagged coefficients, conclusions were made that in the long run, per capita income has a positive influence on poverty reduction. The important policy implication is that policies aimed at improving employment will have delayed effects on poverty, but it should be noted that this effect is insignificant. This means that eradicating poverty is not purely a question of generating economic growth and employment opportunities but in the meantime providing that both the quantity and quality of available work is such that it can lead to poverty reduction (Bell and Newitt, 2010). Our results support studies by Kraay (2004).

Notes

1. In West Africa, it is quite difficult to gather accurate statistics particularly on youth employment. When calculating the unemployment rate, the informal economy and employees working under poor conditions are not taken into consideration. The proportion of the young unemployed in West Africa is one of the world’s highest which was recorded as 18% in 2005. Due to conflicts that arise in certain countries like SierraLeone and Liberia, youth unemployment is much more higher with its rate at 60% and 88% respectively (YEN-WA, 2008).
2. A section of debates made on poverty reduction strategies is associated with the contribution of economic growth to poverty reduction. When elasticity is at a reasonable height, poverty reduction strategies will often depend on economic growth. At the point where elasticity is low, growth as well as the deterioration in income distribution should be taken into account (Bourguignon, 2003).

References

[1]  Acharya, Shankar (2006), “Economic Growth: Some Reflections”, Economic and Political Weekly, 41(43/44), 4573-4578.
[2]  AER (Economic Report on Africa) (2013), Making the Most of Africa’s Commodities: Industrializing for Growth, Jobs and Economic Transformation, Economic Commission for Africa.
[3]  Agénor, P.-R. (1996), “The Labor Market and Economic Adjustment”, IMF Staff Papers, 43, 261–335.
[4]  Agénor, P.-R. (2005), “The Macroeconomics of Poverty Reduction”, The Manchester School, 73(4), Special Issue, 369-434.
[5]  Akanbi, Olusegun and Charlotte B. Du Toit (2011), “Macro-economic Modelling for the Nigerian Economy: A Growth-Poverty Gap Analysis”, Economic Modelling, 28, 335-350.
[6]  Akçoraoğlu, A. (2010), “Employment, Economic Growth and Labor Market Performance: The Case of Turkey, Ekonomik Yaklaşım, 21(77), 101-114.
[7]  Apergis, N., Payne, J.E., 2009. Energy Consumption and Economic Growth: Evidence from the Commonwealth Of Independent States. Energy Econ. 31, 641–647.
[8]  Aryeetey, E. and W. Baah-Boateng (2007), “Growth, Investment and Employment in Ghana”, Working Paper, No.80, Geneva: ILO.
[9]  Azomahou, T. T., Diene, B. and Diene, M. (2009), Technology Frontier, Labor Productivity and Economic Growth: Evidence from OECD Countries, Working Paper Series, United Nations University.
[10]  Basher S.A and Mohsin M., (2003) “PPP Tests in Cointegrated Panels: Evidence From Asian Developing Countries”, Working Paper, No.16.
[11]  Bell, Stuart and Kirsten Newitt (2010), “Decent Work and Poverty Eradication: Literature Review and Two-Country Study”, Ergon Associates, London.
[12]  Birdsall, Nancy, Dani Rodrik and Arvind Subramanian (2005), “How to Help Poor Countries”, Foreign Affairs, 84 (4), 136-152.
[13]  Bodart, V., B. Candelon and J. Carpantier (2011), “Real Exchanges Rates in Commodity Producing Countries: A Reappraisal”, Discussion Papers, Center for Operations Research and Econometrics, Belgium.
[14]  Borenstein, M., L.V. Hedges, J.P.T. Higgins, H.R. Rothstein (2009), Introduction to Meta Analysis, 67-70.
[15]  Bourguignon, François (2003), “The Growth Elasticity of Poverty Reduction: Explaining Heterogeneity across Countries and Time Period” in T. Eichler and S. Turnovsky (eds.), Growth and Inequality, Cambridge, MIT Press.
[16]  Braun, P. A. and S. Mittnik (1993), “Misspecifications in Vector Autoregressions and Their Effects on Impulse Responses and Variance Decompositions”. Journal of Econometrics, 59, 319–41.
[17]  Choi, I. (2001), "Unit Root Tests for Panel Data", Journal of International Money and Finance, 20, 249-272.
[18]  Engle, Robert F. and C. W. J. Granger (1987), “Co-Integration and Error Corrrection: Representation, Estimation, and Testing”, Econometrica, 55(2), 251-276.
[19]  Fisher, R.A., (1932), Statistical Methods for Research Workers, 4th edition. Oliver & Boyd, Edinburgh.
[20]  Galor, O., and D. Tsiddon (1996), “Income Distribution and Growth: The Kuznets Hypothesis revisited”, Economica, 63(250), 103–17.
[21]  Giles J.A., and Williams C.L. (1999), ‘Export-Led Growth: A Survey on the Empirical Literature and some Noncausality Results’, Economics Working Paper, 38.
[22]  Granger, C.W.J. (1969), Investigating Causal Relations by Econometric Models and Cross-spectral Methods, Econometrica, Vol. 37, No. 3. (Aug., 1969), pp. 428.
[23]  Greene, William H. (2008), Econometric Analysis, Sixth Edition. Upper Saddle River, NJ: Prentice Hall.
[24]  Gutierrez, L. 2003. On the Power of Panel Cointegration Tests: A Monte Carlo Comparison. Economics Letters 80 (1), 105-111.
[25]  Hausman, Jerry A. (1978), “Specification Tests in Econometrics", Econometrica, 46 1251-1271.
[26]  Heintz, J. And Robert Pollin (2003), “Informalization, Economic Growth, and the Challenge of Creating Viable Labor Standards in Developing Countries.” PERI Working Paper, No. 60, Amherst, MA: Political Economy Research Institute.
[27]  ILO (2012), Global Employment Trends, 2012, Geneva, ILO.
[28]  ILO (2013), Global Employment Trends 2013, Geneva, ILO.
[29]  Im, K. S., M. H. Pesaran and Y. Shin (2003), “Testing for Unit Roots in Heterogeneous Panels”, Journal of Econometrics, 115, 53-74.
[30]  Islam, Riwnul (2004), “The Nexus of Economic Growth, Employment and Poverty Reduction: An Empirical Analysis”, International Labour Office, Discussion Paper No. 14.
[31]  Kakwani, Nanak, Shahid Khandker, and Hyun H. Son (2004), “Pro-Poor Growth:Concepts and Measurement with Country Case Studies,” UNDP International Poverty Center, Working Paper No.1, Brazil.
[32]  Kao, Chihwa (1999), “Spurious Regression and Residual-based Tests for Cointegration in Panel Data.” Journal of Econometrics, 90, 1–43.
[33]  Khan, Azizur Rahman (2001), “Employment Policies for Poverty Reduction”, Discussion Paper – 1. Recovery and Reconstruction Department, International Labour Office, Geneva.
[34]  Kraay, A. (2004), “When is Growth Pro-Poor? Cross-Country Evidence”, World Bank Policy Research Working Paper, 3225, Washington, DC.
[35]  Levin, A., C.F. Lin ve C.S.J. Chu (2002), "Unit Root Tests in Panel Data: Asymptotic and Finite-Sample Properties", Journal of Econometrics, 108, 1-24.
[36]  Loayza, N. and C. Raddatz (2006), “The Composition of Growth Matters for Poverty Alleviation,” World Bank Policy Research Working Paper 4077.
[37]  Lucas, Sarah, and Peter Timmer (2005), “Connecting the Poor to Economic Growth: Eight Key Questions,” Working Paper, Center for Global Developm ent, Washington, D.C.
[38]  Maddala, G. S. and Shaowen Wu (1999), “A Comparative Study of Unit Root Tests with Panel data and a New Simple Test”, Oxford Bulletin of Economics and Statistics, Special Issue, 631-652.
[39]  OECD (2012), At a Glance “Settlement, Market and Food Security”, [Online]. Available:http://www.oecd.org/swac/westafricanfutures/plaquette_SWAC_WAF_20130329_WEB.pdf
[40]  Odhiambo, Nicholas M. (2011), “Growth, Employment and Poverty in South Africa: In Search of a Trickle-Down Effect”, Journal of Income Distribution: An International Quarterly, 20(1), 49-62.
[41]  Osmani, S. R. (2004), “The Employment Nexus Between Growth and Poverty: An Asian Perspective”, A Report prepared for the Swedish International Development Agency (SIDA), Stockholm and the United Nations Development Programme (UNDP), New York. [Online]. Available: http://www.ipc-undp.org/conference/emprego/paper/asia.pdf
[42]  Pedroni, P. (1999), “Critical Values for Cointegration Tests in Heterogeneous Panels with Multiple Regressors”, Oxford Bulletin of Economics and Statistics, 61, 653-670.
[43]  Phillips P., and Moon H. (2000), “Nonstationary Panel Data Analysis: an Overview of some Recent Developments”, Econometric Reviews, 19(3), 263-286.
[44]  Ravallion, Martin, and Shaohua Chen (2004), “China’s (Uneven) Progress Against Poverty,” Policy Research Paper No. 3408, World Bank, Washington, D.C.
[45]  Satchi, M. and J. Temple (2006), “Growth and Labour Markets in Developing Countries”, Department of Economics, Discussion Papers, No.06/581, University of Bristol.
[46]  Shalini, Ramessur Taruna (2010), “Which is More Important for Poverty Reduction- Growth or Employment? The Case of a Service Based Island”, [Online]. Available: http://www.csae.ox.ac.uk/conferences/2010-EDiA/papers/133-Shalini.pdf
[47]  Stock, James M. and Mark W. Watson (1993). A Simple Estimator of Cointegrating Vectors in Higher Order Integrated Systems. Econometrica 61 (4), 783-820.
[48]  Stock, James M. and Mark W. Watson (2010), Introduction to Econometrics, 3 rd.ed., Addison-Wesley.
[49]  Szirmai, Adam, M. Gebreeyesus, F. Guadogno and B. Verspagen (2013), “Promoting Productive Employment in Sub-Saharan Africa. A Review of the Literature”, UNU-MERIT.
[50]  Tran, Mark (2014), “Africa's economic growth failing to stimulate development and jobs”, The Guardian, 20 January,[Online].Available: http://www.theguardian.com/global-development/2014/jan/20/africa-economic-growth-failing - development-jobs
[51]  The Economist (2011) ‘The Lion Kings?’ 6 January 2011. [Online]. Available: www.economist.com/node/17853324
[52]  UEMOA (2006), Regional Integration for Growth and Poverty Reduction in West Africa: Strategies and Plan of Action, UEMOA, WAEMU Commission and ECOWAS Executive Secretariat.
[53]  UN (United Nations) (2013), Economic and Social Situation in West Africa in 2011-2012 and Outlook for 2013, UN, Economic Commission for Africa Sub-Regional Office for West Africa ECA/SRO-WA.
[54]  World Bank (2006), Global Economic Prospects 2006: Economic Implications of Remittances and Migration, World Bank, Washington DC. YEN-WA (Youth Employment Network Office for West Africa) (2008), Building the Case for Business Collaboration on Youth Employment, YEN-WA.