R. Alema1, T. Odongo2
1Department of Finance, Makerere University Business School (Arua Campus), Arua, Uganda
2Department of Finance, Makerere University Business School (Main Campus), Kampala, Uganda
Correspondence to: T. Odongo, Department of Finance, Makerere University Business School (Main Campus), Kampala, Uganda.
| Email: |  |
Copyright © 2016 Scientific & Academic Publishing. All Rights Reserved.
This work is licensed under the Creative Commons Attribution International License (CC BY).
http://creativecommons.org/licenses/by/4.0/

Abstract
This study uses an imperfect substitution model to investigate the response of Uganda’s traditional export crops to exchange rate volatility in the period 1997 and 2013. The study discovered that Uganda’s traditional export crops respond negatively to exchange rate volatility in the short run but positively in the long run. This performance is possible because in the long run, many factors are at play that can possibly stimulate the export of Uganda’s traditional crops from the country. Some of these factors may include; regional trade agreement which can diversify the export market for Uganda’s traditional crops and also better production policies that can possibly increase the output of Uganda’s traditional export crops available for export. The policy implications for this study include the following: Trade within the region should be encouraged in order to widen the market for Uganda’s traditional export crops. Secondly, in order to broaden the export base of Uganda’s traditional export crops, the list of Uganda’s traditional export crops should be expanded to include even other non traditional export crops.
Keywords:
Response of Exports toExchange Rate Volatility
Cite this paper: R. Alema, T. Odongo, Exchange Rate Volatility and Exports of Uganda’s Traditional Crops, American Journal of Economics, Vol. 6 No. 1, 2016, pp. 41-49. doi: 10.5923/j.economics.20160601.06.
1. Background of the Study
Exchange rate volatility can be regarded as cost of doing business (Benita and Lauterbach 2007). This is because it affects price stability, firms’ profitability and countries’ financial stability. Most developing countries over the years have attempted to moderate their domestic currency fluctuations by imposing regulatory restrictions on exchange rate movements either through monetary measures or through direct intervention in the foreign exchange market and also by restricting the flows of capital from their countries (Benita and Lauterbach 2007). There has been a considerable debate on the effect of exchange rate volatility on economic performance of developing countries. Some scholars contend that exchange rate volatility decreases trade flows between countries Prasad, Rogoff, Wei and Ayham (2003). Thus suggesting that unanticipated variation in the exchange rate adversely affects export competitiveness. Exchange rate fluctuations therefore may create uncertainty in macroeconomic policy, investment decision and may as well affect exports depending on the role played by agents in the market (Baak, 2004). Thus, exchange rate volatility has consequently remained a major concern of developing countries. This is because the values of foreign currencies partially determine prices paid out or received from output produced and sold out in the market as well as profitability of producers (Akhtar and Spence, 1984). Exchange rate volatility thus affects the volumes of goods traded in the market. It may mean significant fluctuations in the values of exchange rate that may considerably affect performance of imports as well as exports. Although there exist a growing body of literature explaining the effect of exchange rate volatility on export performance of developing countries during the 1990s, empirical evidence in this area however, has been ambiguous both within and across countries (Cote, 1994). Many empirical evidence indicated above suggest that increase in exchange rate volatility leads to decrease in trade flows. This is because goods are denominated in terms of currency of either exporting or importing countries in most international transactions. Thus the above argument implies that exchange rate volatility affects exports of developing countries. Given the above background, the response of Uganda’s traditional export crops to exchange rate volatility may not be an exceptional case. The performance of Uganda’s traditional export crops with respect to Real Effective Exchange Rate (REER) movements in the country in the period between 1997 and 2013 is indicated in table 1.Table 1. Uganda’s Traditional Export Crops and REER (1997 – 2013)
 |
| |
|
As indicated in table 1 above, export of Uganda’s traditional crops increased significantly, from 326.08 million kilograms in 1997 to 602.39 million kilograms in 2013. REER on the other hand, depreciated from 75.41 per United States Dollars (USD) in 1997 to 114.92 per USD in 2013. The trend of export of Uganda’s traditional crops during this period fell sharply in the period between 1998 and 2005. Although it attempted to rise in the period between 2005 and 2007, it again fell sharply in the period between 2007 and 2009. The performance of export of Uganda’s traditional crops and its corresponding exchange rate movements in the country in the period between 1997 and 2013 is indicated in figure 1 below.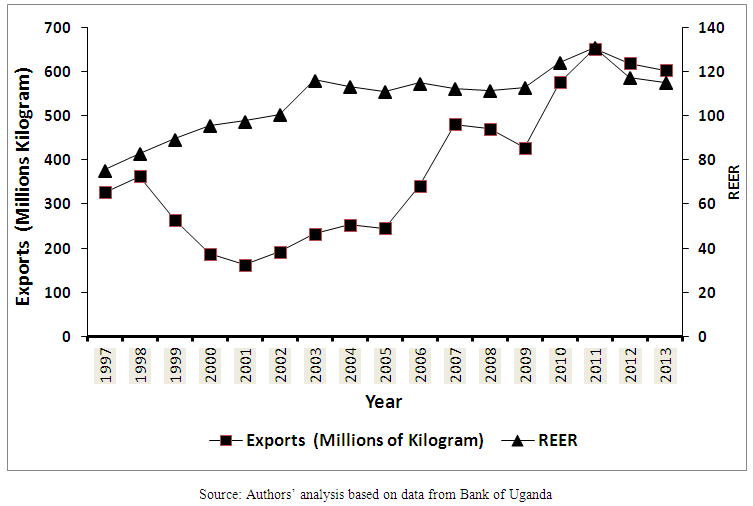 | Figure 1. Trend of REER and Uganda’s Traditional Exports1 Crops (1997 – 2013) (1Traditional Export crops in Uganda includes; Coffee, Cotton, Tobacco and Tea) |
Thus, observing from figure 1 above, despite unfavorable performance in the trend of Uganda’s traditional export crops in the period between 1997 and 2013, the trend of REER in the country during this period has surprisingly been rising in most of the years. The performance of Uganda’s traditional export crops with respect to the performance of REER in the country in the period between 1997 and 2013 therefore indicates that the trend exports of Uganda’s traditional crops in the period between 1997 and 2013 is inconsistent with the trend of REER in the country. The above performance therefore motivates this study to investigate empirically, the response of Uganda’s traditional export crops to exchange rate volatility in the period between 1997 and 2013.There has hardily been any of such study carried out before to investigate the response of Uganda’s traditional export crops to exchange rate volatility in the period between 1997 and 2013. This study is therefore important because it fills the gap of motivating policy makers to a rethinking about the role of exchange rate volatility on Uganda’s traditional export crops.
2. Methodology
2.1. Introduction
This section indicates methodology adopted by this study to analyze the data. The methodology section contains data type and sources, data estimation techniques, models specification and analytical procedures carried out in the study. Details of the methodology adopted by this study are indicated below.
2.2. Data Type and Sources
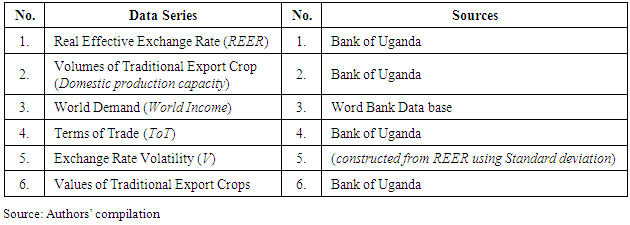
The data type for this study is secondary. This include Real Effective Exchange (REER), Output (Y, which also represent domestic production capacity), World demand (World Income), Terms of Trade (ToT), Volumes of Traditional export crops and exchange rate volatility (V). The response of Uganda’s traditional export crops to exchange rate volatility in this study has been estimated using the data set indicated above. The study uses a quarterly data series dating from 1997 to 2013.
2.3. Data Series and Their Sources
The data series in this study have been obtained from Bank of Uganda (BOU) and World Bank. Details of the data series and their sources in the study are indicated in table 2 below.Table 2. Data Source and Measurement of Variables
 |
| |
|
2.4. Data Estimation Technique
The data estimation technique used in this study is the Vector Error Correction Model (VECM). E-views software has been used in this study to analyze the time series data. Various analyses have been carried out in this study. These analyses include; stationarity test, cointegration test and diagnostic tests. Details of the analyses carried out in this study are indicated below.
2.4.1. Stationarity Test
Stationarity of each individual data series has been estimated in this study using Augmented Dickey Fuller (ADF) test. A unit root null hypothesis has been tested against a stationary alternative. The stationarity test in the study uses regressions of a time series data analyzed against a constant. These regressions can be expressed as follows; 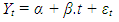 | (1) |
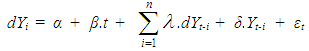 | (2) |
The stationarity of residuals (εt) has been tested. Lag length (p) of the ADF (dYt-i) equation has been selected using Schwarz Information Criterion (SIC).
2.4.2. Cointegration Test
Johnsen (1988) procedure has been adopted by this study to test for cointegrating relationship within endogenous variables, based on Maximum Likelihood test and unrestricted Vector Auto Regression test. Cointegration rank r (number of cointegrating vectors) has been tested using trace statistics and Maximum Eigen Statistics. Trace statistics test null hypothesis that there are at most r cointegrating vectors against alternative of r or more cointegrating vectors, while the Maximum Eigen Statistics on the other hand test null hypothesis of r cointegrating vectors against alternative of r+1 cointegrating vectors.
2.4.3. Vector Error Correction Model (VECM)
The analysis of vector error correction model has been carried out in this study to determine whether there exist any short run or long run causal relationship within variables in the model specified. The presence of cointegrating relationship within endogenous variables is a necessary condition for estimating vector error correction model. Following Odongo (2014), the general form of the vector error correction model estimated in this study can be presented as follows; | (3) |
Where Xt is an nx1 matrix and n = 6 vectors of dependent variables, ∆Xt-1, β and γ are parameters, while Vt is a residual. Error correction mechanism is evidence in the Error Correction Term (ECTt-1). There are as many error correction terms as there are cointegrating vectors (r). Parameter γi associated with ECTt-1 measures proportion of adjustment back towards equilibrium that can be completed within a single period. If parameter γi is not significantly different from zero then there is no error correction process working within the model. Parameter βt on the other hand, indicates the presence of a short term lag from one variable to another and it measures short term adjustment back towards equilibrium.
2.4.4. Model Specification
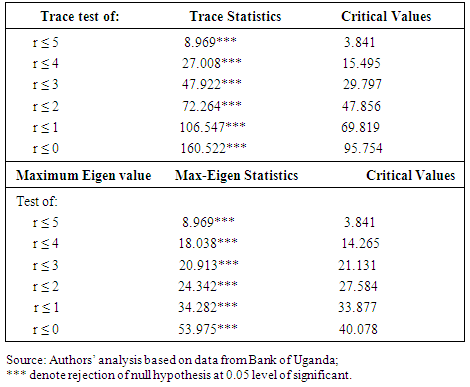
To estimate the response of Uganda’s traditional export crops to exchange rate volatility in the period between 1997 and 2013, the study adopts and modifies an imperfect substitution model used previously by Musonda (2008) to investigate the effect of Exchange rate volatility on export performance of Zambia. This study uses variables specified in export demand function outlined in Prasad (2000), Jongwanich (2007), Musonda (2008) and Odongo (2014), to specify the export demand and supply equations. The export demand and supply equations in this study are examined together to form an imperfect substitution model; where imperfect substitutability between domestic and export products enables domestic and export prices to differ from one another. The basic assumption behind imperfect substitution model is that export commodities are not perfect substitutes for domestic goods in importing countries (Prasad, 2000). This model is expressed as a system of equations for export demand and supply which simultaneously determine performance of Uganda’s tradition export crops. Following Jongwanich (2007), the demand and the supply equations of Uganda’s traditional export crops in the period under the review can be expressed in log linear equilibrium relationship as follows;  | (4) |
 | (5) |
Where: X = Values of Traditional Export crops. Px = Export price expressed in foreign currency. Pw= Price of competing goods in import market expressed in foreign currency. pd= Price of export commodity in domestic market expressed in local currency.  =Pd/e; Pd = Price of exportable in domestic market expressed in local currency. e = Nominal Exchange Rate (Exchange Rate of Uganda Shillings against (USD). Y = Output (domestic production capacity). WD = World Demand (Real income in importing countries).Equation (4) above, indicates that the demand for Uganda’s traditional export crops is inversely related to its own price and that of competing goods in the import market. If other things remained constant, an increase in the price of traditional export crops lowers its demand, while a rise in price of competing goods increases its demand.Equation (5) on the other hand, presents the supply side of traditional export crops in the period under the review. It indicates that the decision to export traditional crops from Uganda depends primarily on relative returns between the values of domestic sales and export given production capacity of Uganda’s traditional export crops (Jongwanich, 2007).From the equations (4) and (5), the export behaviors of Uganda’s traditional export crops are examined using a single equation approach where both the demand and the supply equations of Uganda’s traditional export crops are solved together to yield an expression for equilibrium values of traditional export crops for Uganda (Jongwanich, 2007). This expression is presented in equation (6).
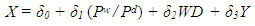 | (6) |
Where;  Thus, the equation (6) has further been reduced as expressed in the equation (7) below.
  | (7) |
Where; REER = Real Effective Exchange Rate is a broad summary measure of price of one country relative to the price of other countries expressed in common currency. WD = World Demand (income in importing countries). Y = Output (domestic production capacity). X = Values of Traditional Export Crops. Thus, the equation expressing determinants of Uganda’s traditional export crops in the period between 1997 and 2013 can be presented as follows; | (8) |
Where; X = Values of Traditional Export Crops. REER = Real Effective Exchange Rate is a broad summary measure of the price of one country relative to the price of other countries expressed in common currency. WD = World Demand (income in importing countries). Y = Output (domestic production capacity). Є = Error Term.
2.4.4.1. Extension in the Model
A measure of Terms of Trade (ToT) has been added to equation (8) to capture performance of Terms of Trade on export of Uganda’s traditional crops in the period between 1997 and 2013. Secondly, a measure of exchange rate volatility has been introduced to equation (8) to capture the response of Uganda’s traditional export crops to exchange rate volatility. Variable “V” that captures performance of exchange rate volatility has been introduced to equation (8). Thus the equation indicating the response of Uganda’s traditional export crops to exchange rate volatility in the period between 1997 and 2013 is indicated below.  | (9) |
Where; REER = Real Effective Exchange Rate is a broad summary measure of price of one country relative to price of other countries expressed in common currency. WD = World Demand (income in importing countries). V = Measure of Exchange Rate Volatility [Calculated using Standard Deviation]. X = Values of Traditional Export Crops. Y = Output (domestic production capacity). TOT= Terms of Trade. єit = Error Term
3. Presentation and Discussions of the Results
3.1. Introduction
This section presents and discusses the results in the study to obtain conclusions from them. The conclusions in this study are obtained from empirical analyses in the study. The policy implications in this study on the other hand, are obtained from conclusions in the study.
3.2. Descriptive Statistics
Descriptive statistics have been estimated in this study to provide explanations on the characteristics of the variables in the study. The results for descriptive statistics in this study are presented in table 3 below. The summary statistics in table 3 indicate that normality test has been rejected in 3 out of 6 variables at 5 percent level of significance. Non-normality in this table appears to be caused by the excess of kurtosis. Table 3. Results for Descriptive Statistics
 |
| |
|
Following the estimation of descriptive statistics, the study proceeds to test for stationarity of endogenous variables. A unit root test has been carried out on each of the variable to test for stationarity.
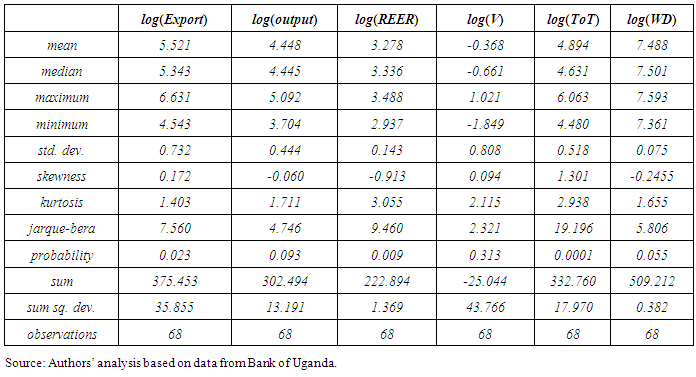
3.3. Test for Stationarity
The stationarity of residuals in this study has been estimated using Augmented Dickey-Fuller (ADF) test. The Augmented Dickey-Fuller (ADF) test uses MacKinnon one-sided p-values to test whether there exist any unit root problem in the data estimated in the study. The summary statistics in table 4 present the ADF statistics for the data estimated. The results in this table indicate that all variables are stationary at first difference except for log (Export) which is stationary at second difference. Table 4. Stationarity Test Results (Estimation period 1997- 2013)
 |
| |
|
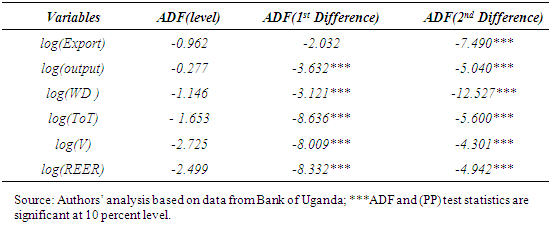
3.4. Test for Cointegration
Cointegration test has been carried out in this study to determine whether there exists any long run relationship within variables in the model specified. The results for cointegration test carried out in the study are presented in table 5. The results from Unrestricted Trace Statistics (UTS) indicate six cointegrating vectors at 0.05 percent level of significance. The results from Maximum Eigen Statistics (MES) also indicate six cointagrating vectors at 0.05 percent level of significance. Thus; there exists long run relationship within variables in the model specified. Table 5. Cointegration Test Results
 |
| |
|
3.5. Diagnostic Test
Following cointegration test carried out in this study, the study proceeds to carry out diagnostic tests in order to determine whether the data series in this study are normally distributed or not. Secondly, ARCH test has been carried out in this study to determine whether there exist serial correlation in the variables specified in the study and thirdly the study carried out RESET test to determine whether there exists misspecification error among the variables in the study. Details of the diagnostic tests carried out in this study are indicated below.
3.5.1. Normality Test
Normality test has been carried out in this study to determine whether the data series estimated in the study are normally distributed or not. The result in figure 2 below displays a histogram and descriptive statistics of the residuals, including the Jarque-Bera statistic that tests for normality. If the residuals are normally distributed, the histogram should be bell-shaped and the Jarque-Bera statistic should not be significant.The reported probability in the above table therefore indicates that Jarque-Bera statistic exceeds the value under the null hypothesis. This study therefore does not accept the null hypothesis of a normal distribution. Following the normality test, this study proceeds to test for serial correlation using Autoregressive Conditional Heteroskedasticity (ARCH) test. Details of the ARCH test carried out in this study are indicated below.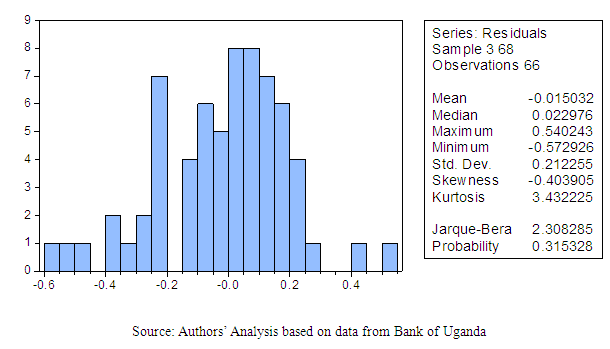 | Figure 2. Histogram and Normality Test |
3.5.2. Autoregressive Conditional Heteroskedasticity (ARCH) Test for Serial Correlation
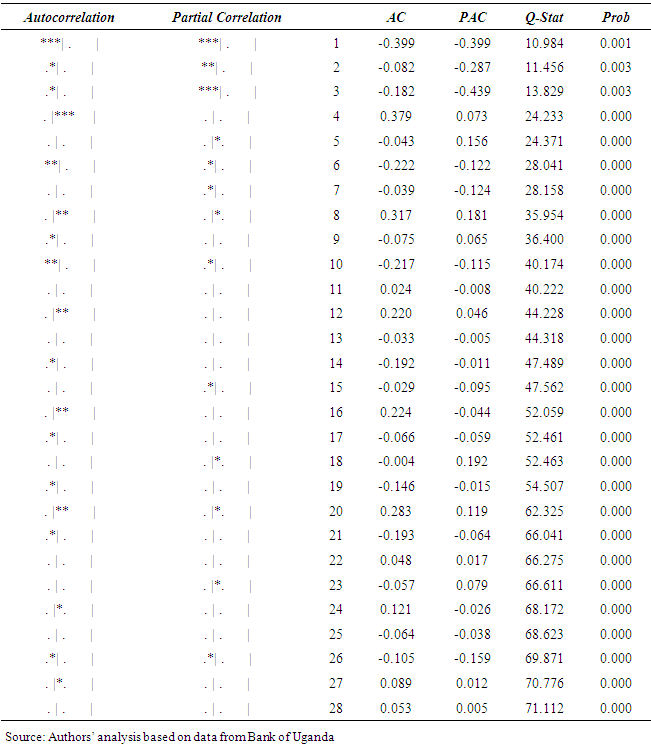
The ARCH test uses autocorrelations and partial autocorrelations of the squared residuals to determine whether there exists any serial correlation in the residual of the variables in the model specified. Details of the results from the ARCH test carried out in this study are presented in table 6.Table 6. ARCH Test for Serial Correlation
 |
| |
|
The above table presents the results for autocorrelations and partial autocorrelations of the squared residuals up to 28 specified numbers of lags. The correlograms of the squared residuals are used to check for ARCH in the residuals. The results in this table indicate no ARCH in the residuals in the study.
3.5.3. Regression Specification Error Test (RESET) for Misspecification
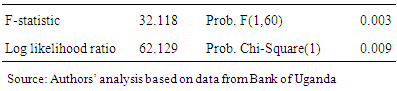
Regression Specification Error Test (RESET) has been carried out in this study to test for specification error in the variables specified in the study. Specification error is an omnibus term which covers any departure from the assumptions of the maintained model. Details of the results from RESET test in this study are indicated in table 7 below.F-statistics and Log likelihood statistics in table 7 indicate that specification error has been rejected at 5 percent level of significant. It affirms the hypothesis that the coefficients on the power of the fitted values are all zero. Following the diagnostic test carried out in this study, the study proceeds to estimate the response of Uganda’s Traditional export crops to exchange rate volatility in the period under the review. Details are indicated below.Table 7. Ramsey RESET Test: for Misspecification
 |
| |
|
3.6. Response of Uganda’s Traditional Export Crops to Exchange Rate Volatility
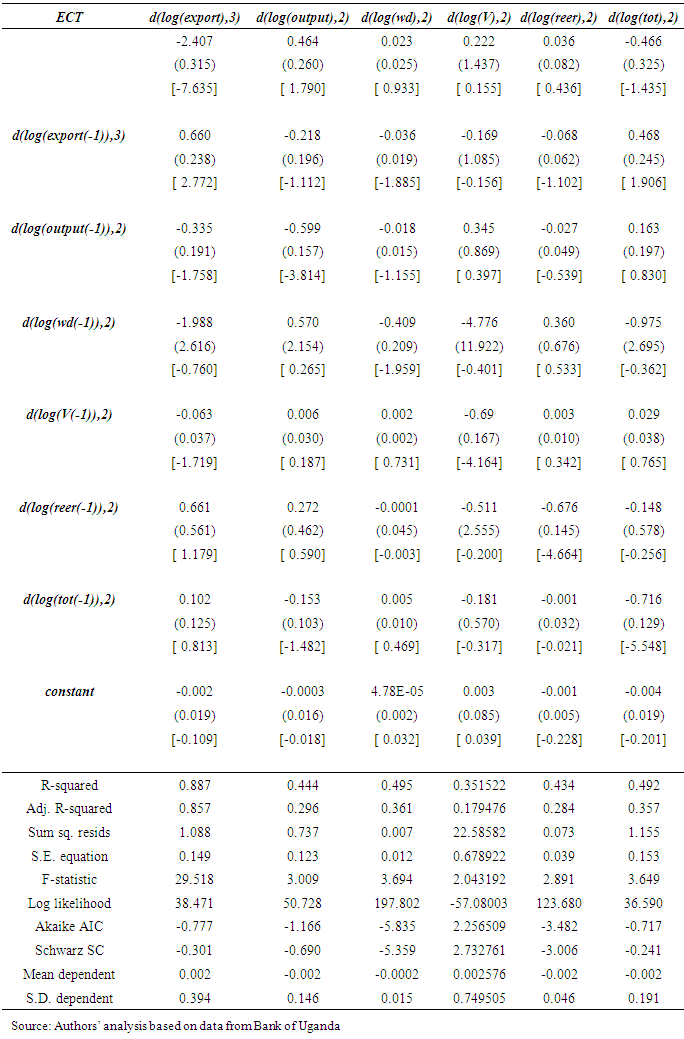
The response of Uganda’s traditional export crops to exchange rate volatility in the period between 1997 and 2013 has been estimated using VECM analysis. Details of the results from the VECM estimated in this study are presented in table 8 below.Table 8. Response of Uganda’s Traditional Export Crops to Exchange Rate Volatility
 |
| |
|
In the short run, when output increases by 1 percent, export reduces by 34 percent, when world demand increases by 1 percent, export falls by 1.99 percent, when exchange rate volatility increases by 1 percent, export reduces by 0.63 percent, when Real Effective Exchange Rate (REER) depreciates by 1 percent, export increases by 66 percent and when Terms of Trade (TOT) improves by 1 percent export increases by 10 percent. Thus, the result for the short run relationship in this study is summarized in the equation (10) below. | (10) |
Thus, the results for the short run relationship presented in table (8) above indicate that exchange rate volatility does promote negative but significant effect on Uganda’s traditional crops in the short run.In the long run however, when output increases by 1 percent, export increases by 46 percent, when world demand increases by 1 percent, export increases by 2 percent, when exchange rate volatility increases by 1 percent, export increases by 22 percent, when Real Effective Exchange Rate (REER) depreciates by 1 percent, export increases by 4 percent and when Terms of Trade (ToT) improves by 1 percent, export reduces by 47 percent. Thus, the result for the long run relationship in this study is summarized in the equation (11) below. | (11) |
Following the estimated results presented in this study, exchange rate volatility encourages positive and significant effect on Uganda’s traditional export crops in the long run.
4. Conclusions and Policy Implications
4.1. Conclusions
The analysis of the response of Uganda’s traditional export crops to exchange rate volatility in the period between 1997 and 2013 has been carried out using VECM. The results in this study indicate that exchange rate volatility does not promote positive effect on export of traditional crops from Uganda in the short run. In the long run however, exchange rate volatility does encourage improved performance of Uganda’s traditional export crops in the period under the review. This performance is possible because in the long run, many factors are at play that can possibly motivate the export of Uganda’s traditional crops from the country. Some of these factors may include; regional trade agreement which can diversify the export market for Uganda’s traditional crops and better production policies that can possibly increase the output of Uganda’s traditional export crops available for export.
4.2. Policy Implications
The policy implications for this study include the following: Trade within the region should be encouraged in order to widen the market for Uganda’s traditional export crops. This is because a wider market for Uganda’s traditional export crops can possibly helps to expand the export of Uganda’s traditional crops and consequently stabilizing the already volatile foreign exchange market in the country. Secondly, in order to broaden the export base of Uganda’s traditional export crops, the list of Uganda’s traditional export crops should be expanded to include even other non traditional export crops. This is because an expanded list of Uganda’s traditional export crops can possibly help to expand the export base of these crops and consequently raise enough foreign currency which can assist in smoothening the already volatile foreign exchange market in the country.
References
| [1] | Akhtar M. and Spence R. H., (1984). “Effects of exchange rate uncertainty on German and U.S trade,” Journal of finance. Pg; 132. |
| [2] | Baak S., (2004). “Exchange rate volatility and trade. International journal of Applied Econometrics and Quantitative studies Vol. 3-1. |
| [3] | Benita G., and Lauterbach B., (2007). Exchange rate Volatility in Nigeria – Central Bank. CBN Journal of Applied statistics 2 No.2. |
| [4] | Cote, A., (1994). “Exchange rate volatility and trade: A survey”. Working Paper No. 5. Bank of Canada, Ottawa. |
| [5] | Johansen S., (1988). Statistical Analysis of cointegration Vectors, Journal of Economic Dynamics and control Vol.1, No. 2-3, pp231-254. |
| [6] | Jongwanich J., (2007). Determinants of Exports Performance in East and Southern Asia. Asian Development Bank 6 ADB Avenue, Mandaluyong City 1550Metro Manila, Philippines. Available at www.adb.org/economics ISSN: 1655-5252. |
| [7] | Lawrence E. and Phil A., (2005) “Exchange Rate volatility and trade in South Africa” Research Journal University of Fort Hare. |
| [8] | Musonda, A., (2008). “Exchange Rate Volatility and Non-Traditional Exports Performance: Zambia, 1965–1999”. AERC Research Paper 185. African Economic Research Consortium, Nairobi, Kenya. |
| [9] | Odongo T., (2014), “Determinants of Uganda’s lint export following Trade liberalization” Research Journali’s Journal 2014/ISSV/2347-8233. |
| [10] | Prasad S., (2000). Determinant of exports in Fiji. Working Paper 2000/04, Economics Development Bank of Fiji. |
| [11] | Prasad E., Rogoff K., Wei S. and Ayham M., (2003). “Effects of financial globalization on developing countries”, Some empirical evidence. |

 Abstract
 Reference
 Full-Text PDF
 Full-text HTML