-
Paper Information
- Paper Submission
-
Journal Information
- About This Journal
- Editorial Board
- Current Issue
- Archive
- Author Guidelines
- Contact Us
American Journal of Economics
p-ISSN: 2166-4951 e-ISSN: 2166-496X
2015; 5(5): 547-552
doi:10.5923/j.economics.20150505.16
Externalities of Sea Transportation Activities at Makassar Port, Indonesia
 Abstract
 Reference
 Full-Text PDF
 Full-text HTML
Nur Dwiana Sari Saudi1, 2, Maryunani3, Multifiah3, Susilo3
1Economics Sciences, Faculty of Economics and Business, University of Brawijaya, Jalan MT Haryono 165, Malang, Indonesia
2Faculty of Economics and Business, University of Hasanuddin, Jalan Perintis Kemerdekaan KM.10, Makassar, Indonesia
3Faculty of Economics and Business, University of Brawijaya, Jalan MT Haryono 165, Malang, Indonesia
Correspondence to: Nur Dwiana Sari Saudi, Economics Sciences, Faculty of Economics and Business, University of Brawijaya, Jalan MT Haryono 165, Malang, Indonesia.
| Email: |  |
Copyright © 2015 Scientific & Academic Publishing. All Rights Reserved.
This study identifies various positive and negative externalities which occurs from sea transportation activities at the Makassar Port. The study used survey method to 90 respondents from service users, workers and people who live around the port. Data were collected by interview and descriptively analyzed using Contingent Valuation Method (CVM) to obtain respondents willingness to accept (WTA and willingness to pay (WTP) values. The analysis showed that the activities at the port cause positive externalities (benefits) and negative externalities (losses). Some of benefits which are got such as economic sectors improvements, aesthetic improvements, informal sector development, transportation, lighting improvement and tourism. In other hand, the perceived losses are increase of water, air, and terrestrial pollution, increase of noise and increase of crime.
Keywords: Makassar port, Negative externalities, Positive externalities, WTA, WTP
Cite this paper: Nur Dwiana Sari Saudi, Maryunani, Multifiah, Susilo, Externalities of Sea Transportation Activities at Makassar Port, Indonesia, American Journal of Economics, Vol. 5 No. 5, 2015, pp. 547-552. doi: 10.5923/j.economics.20150505.16.
Article Outline
1. Introduction
- Indonesia is an archipelago nation (± 17.508 islands) in the world a which is surrounded by vast ocean (± 7.8 million km2). Its coastline is about 81.791 km, the second longest in the world after Canada. Indonesia also has the largest marine biodiversity in the world or mega marine biodiversity which is located in the coastal and marine areas. There are variety of natural resources and the resources of marine services [1].Coastal resources are divided into tradable and non-tradable resources. Port services activities is tradable resources, while the mangrove ecosystem, sea grass, coral reefs and other marine ecosystems are non tradable resources. Both of these components have an equal high economic value. Almost 70% area of Indonesia is an ocean with an enormous economic potential and located in an important geopolitical position, Pacific and Indian Ocean. This region is the most economically and politically dynamic region in the international arena. That is why the marine sector can be used as the basis for national development [2].The centralization point of various activities is located in coastal area. It causes a highly productivity in coastal area. In other hand, human activity either traditional way or technology-based have takes negative effects to coastal area. The main activity in coastal area is the port activities such as supporting transportation and other activities.Makassar port is a gate in the eastern region of Indonesia and also serves as a link hub with the western part of Indonesia. Sea transportation services activity at the Makassar port is quite high. The passengers and goods movement service is increase throughout the year. As a maritime city, Makassar is supported by Makassar port which has the largest infrastructure in eastern Indonesia. Makassar port is one of the seven major port on the policy of Indonesia sea toll lanes by Indonesia government. Seven others port are Kuala Tanjung, Batam, Tanjung Priok, Tanjung Perak, Makassar, Bitung, and Sorong. Seven major ports in sea toll lanes connect to 24 main ports, 36 collector ports, and 7 other feeder ports.With such a large and important role, it is not surprising that the high activity in Makassar will give pressure to the Makassar port and surrounding area. The main problems at the Makassar Port today is the development of capacity, efficiency / productivity and environment. It will certainly have an impact to coastal ecosystem as a location for the Makassar Port, such as pollution in coastal waters of Makassar, high air pollution, increasing volume of waste also noise, and high levels of congestion in the port area. The growth of passengers and goods flowing in Makassar port causes various environmental impacts such as ecological impacts (pollution), economic impacts (high economic costs by limited accumulation of containers and onset of overcrowding), and social impacts (social insecurity and seedy neighborhood). It is important to conduct analysis on condition of Makassar port comprehensively. It is the best way to find alternative effort for optimizing the function of the port and reducing the impact to the environment and society. This is appropiate with international criteria such as sustainable development and environmentally friendly, which are grouped into ecology, economy, social, physical, and institutional (management) [3, 4]. Therefore, this research aims is to identify and clarify various positive externalities and negative externalities from sea transportation activities in Makassar port.
2. Research Methods
- This research was conducted in the area of Makassar Port, Makassar and the settlement which bordering with the Makassar port area. Primary data collection (primary and secondary data) were conducted by survey. It was used to investigate the population directly. The survey was conducted by observation techniques and interviews with a questionnaire guidelines which were constructed according to research necessary. Interviews were conducted on the selected 30 respondents.1. Users of port services2. Workers3. People who get the benefits (positive externalities) and suffer a losses (negative externalities) The collected data were analyzed descriptively.Contingent valuation method (CVM) is used to measure the existence value of the Makassar Port in order to calculate the willingness to pay (WTP) and willingness to accept (WTA) for residents around Makassar Port. This study used an average of the WTA survey results from respondents. It can statistically describe or give an overview to the investigated object through a data sample or population [5]. Descriptive statistics allow researchers to calculate the mean (average) which is a technical explanation of the group based on the average value of the group. WTP aggregate or WTP total can be used to predict WTP overall population with the following formula:
 TWTP is the total WTP, WTPi is the willingness to pay (WTP) of sample respondent of -i, ni is the number of samples of -i who are willing to pay for WTP, N is number of samples, P is number of population and i is respondent of -i who are willing to pay (i = 1, 2, 3, …, n).
3. Result and Analysis
- The impact of development on the environment has two meanings. (1) The difference the existing environmental conditions between before and after development which is expected to has an impact after construction. (2) The difference environmental conditions between existence and absence of development. So the environmental impact can be negative and positive. Inter-sector utilization of existing activities in coastal zones and oceans affect each other and cause two types of impacts, positive and negative impacts. Externalities cause markets experience inefficiencies which is called market failure. When it is happened, the market produce too many specific goods and services but too few to produce other goods and services. Market balance shows that the state of demand is equal to the supply and WTP of marginal buyer of goods (marginal benefit) are indicated by the same request with extra charges (marginal cost) for the goods or supply. Efficient allocation of resources is occurred this condition. Overview from an economic perspective, pollution is not only the loss of economic resources, reduced ability of the quality and quantity of resources for the supply of goods and services, but also the impact of the pollution to public welfare [6]. Pollution is a persuasive phenomenon (always happened) as a result of the economic activity. The principle of natural resource economics claim that the best deal to control pollution is how to control pollution into the most efficient level. In this context, efficient is meant pareto improvement. Pollution results have negative utility and pareto improvement states that no one of party or group can gain benefit from such pollution (no pareto gain).
3.1. Positive Externalities
- Positive externalities are caused by the actions of certain individuals which have a positive effect to welfare of other individuals. This is reflected by the benefit of presence of Makassar port which is enjoyed by the service users, workers, and people around the port area. Some of positive externalities are economic benefits, aesthetic improvements, informal sectors developments, transportation, improvement / street lighting and tourism. The concept of utility measurement by the WTP has been commonly conducted to non-traded public goods or services [7-13]. The reasons for the using of WTP in public goods or services are caused by (1) price or market value fails to be reflected to the public / consumer or (2) absence of market transaction [11, 14]. Another reason is caused by (3) unavailability of demand data from consumer, then WTP survey can solve it [15].WTP is used to measure the benefits from the Makassar port infrastructure by using economic valuation approach, CVM. CVM is introduced by David [16]. CVM is a method to estimate the economic value from a non-traded public goods in market. Based on survey result to the respondents, we obtain information about public advantages or benefits by the existence of Makassar port (Figure 1). These respondent group are people who get the benefits or advantages from the existence of Makassar port.
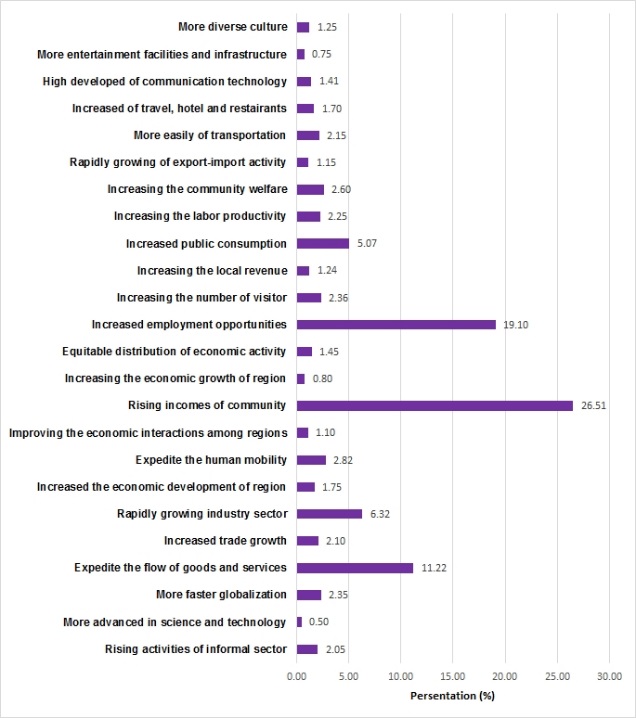 | Figure 1. Various benefits from the existence of Makassar Port which are got by respondents |
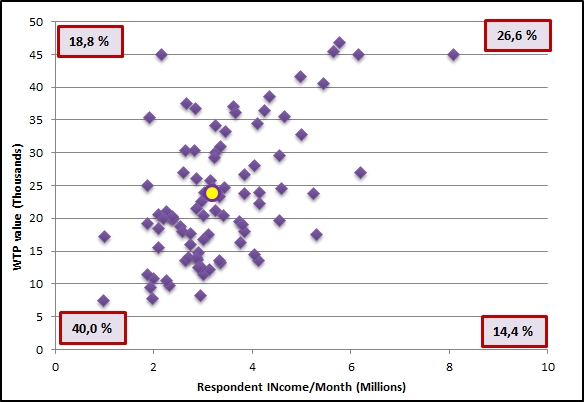 | Figure 2. Distribution of income and WTP value of respondents in the Makassar Port Area |
3.2. Negative Externalities
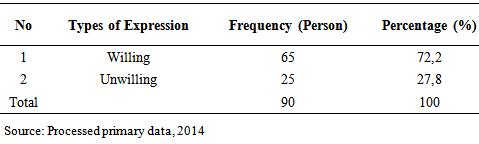
- Negative externalities or diseconomies externalities is a reduced incidence of the welfare of a group by other groups [17]. This is reflected by variety of disadvantages experienced by users of the service, workers, and people around the port area. Negative externalities, disadvantages from the existence of Makassar Port, consist of water pollution, air pollution, land pollution, noise, congestion and crime. Air pollution in Makassar port are Sulphur dioxide, nitrogen dioxide, carbon monoxide, ozone and other particles. It detected in Makassar port area and 60% of air pollution is carbon monoxide. Water pollution is serious problem in Makassar port. Pollution index show that water quality (pH, BOD, COD, DO, PO4 and PO3) is 3.94-5.38 in port areas. furthermore, The noise in the makassar port is above the standard. The noise reach up to 84 dB in makassar port [18, 19].WTA is a measure of economic assessment concept for environmental goods and services. This measure provides an information about amount of compensation that may be accepted by people for environmental degradation in surrounding areas. This compensation is equivalent to the cost of environmental quality repairing. Assessment of environmental goods and services from the WTA side involves the minimum amount of money which is monthly or annually received by people around affected area.CVM method is used to estimate the WTA value from the service users, workers and people around the port whom accept and bear the externalities from marine transportation activity at the Makassar Port. WTA analysis was conducted by asking 90 respondents. The distribution of willing-unwilling choice from the people, who bear the externalities from marine transportation activity at the Makassar Port, relects their losses or disadvantages (Table 1).
|
|
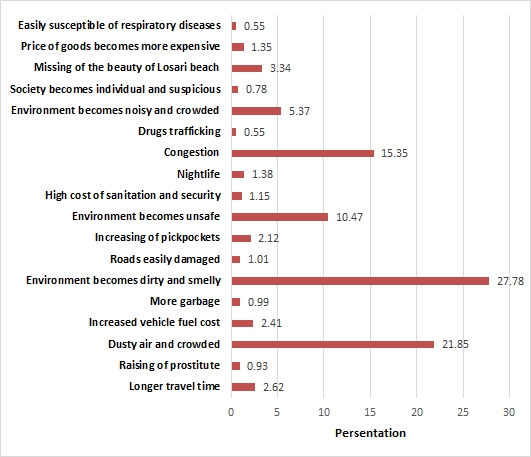 | Figure 3. Various losses of respondents from Makassar Port presences |
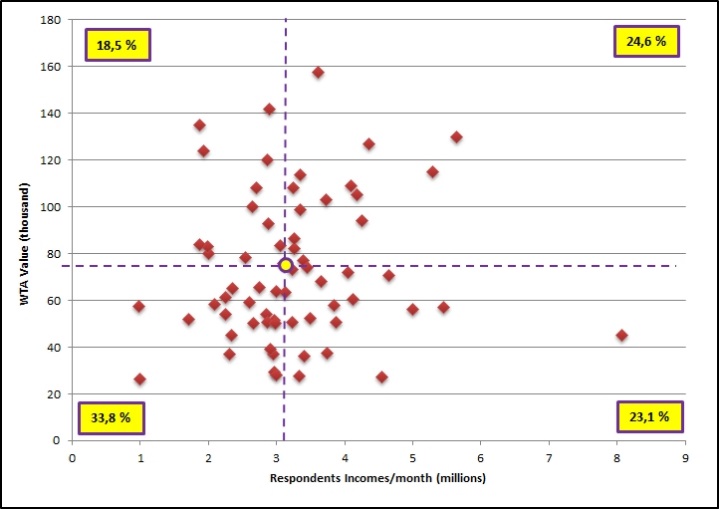 | Figure 4. Distribution of income and WTA value of respondents in the Makassar Port Area |
4. Conclusions
- Sea transportation activities at the Makassar Port not only give positive impact (economic benefits, aesthetic improvements, development of informal sector, an increase in mobility / transportation, improvement / street lighting, and tourism) but also give negative impacts (water pollution, air pollution, land pollution, noise, congestion, and crime / accident increase).Makassar Port management causes unequal distribution between economic and social costs. The analysis result at the Makassar Port showed that WTP value is lower than WTA. It means that the management of the Makassar Port need to reform and improve on environmental sustainability aspects due to externalities arising from marine transportation activities. WTP value reflects the desire of community to pay, while WTA value reflects the willingness of people to bear the environmental degradation due to the port activities.
ACKNOWLEDGEMENTS
- This work is supported by Directorate General of Higher Education (DGHE), National Education Ministry Republic of Indonesia.