-
Paper Information
- Previous Paper
- Paper Submission
-
Journal Information
- About This Journal
- Editorial Board
- Current Issue
- Archive
- Author Guidelines
- Contact Us
American Journal of Economics
p-ISSN: 2166-4951 e-ISSN: 2166-496X
2015; 5(5): 526-533
doi:10.5923/j.economics.20150505.13
Catastrophic and Impoverishing Effects of Out-of-Pocket Health Expenditure: New Evidence from Egypt
 Abstract
 Reference
 Full-Text PDF
 Full-text HTML
Ahmed Shoukry Rashad1, 2, Mesbah Fathy Sharaf1
1Department of Economics, Faculty of Commerce, Damanhour University, Damanhour, Egypt
2Philipps-Universität Marburg, Marburg, Germany
Correspondence to: Mesbah Fathy Sharaf, Department of Economics, Faculty of Commerce, Damanhour University, Damanhour, Egypt.
| Email: |  |
Copyright © 2015 Scientific & Academic Publishing. All Rights Reserved.
Conventional poverty estimates do not take into account out-of-pocket (OOP) health payments. OOP health payments could cause financial catastrophe to households, which may push them into poverty. OOP payments are the principal mean of financing healthcare in Egypt. This paper investigates the catastrophic and the impoverishing impact of OOP health payments in Egypt. A nationally representative sample of 10,550 households from the Eighth round of the Egyptian Family Observatory Survey is used. OOP payments for healthcare are considered catastrophic if exceeding 40% of the household’s capacity to pay. The impoverishing impact of OOP health payments is evaluated using poverty head counts and poverty gaps before and after the OOP payments. The determinants of catastrophic health expenditures are examined using a multivariate logistic regression. Results show that OOP health payments drive 6% of households to encounter financial catastrophe. 7.4% of households fell below the poverty line after controlling for healthcare expenditures. OOP health expenditures have exacerbated the normalized poverty gap by 1.4%. The multivariate logistic regression shows that when compared to urban households, rural households are more likely to incur catastrophic health expenditure (Odd Ratio (OR) = 1.73; 95% Confidence Interval (CI) = 1.38-2.17). The odds of catastrophic health expenditure are higher among households with no private health insurance (OR = 2.74; 95% CI = 1. 55-4.82), and households whose head are unemployed (OR = 2. 30; 95% CI = 1.80-2.95). A female-headed household has less risk to incur catastrophic health expenditure compared to a male-headed household (OR = 0.71; 95% CI = 0.52-0.96). Large households are less likely to encounter catastrophic health expenditure than small households (OR = 0.78; 95% CI = 0.72-0.84). Having a sick member with chronic disease is a risk factor for catastrophic health expenditure (OR = 5.08; 95% CI = 1.78-14.4). Households with young children (less than five years) are more likely to face financial catastrophe than households without young children (OR=1.36; 95% CI= 1.11-1.66). OOP health expenditures have catastrophic and impoverishing effects in Egypt. Poverty reduction policies in Egypt should target vulnerable households with high risk of experiencing catastrophic health expenditure.
Keywords: Out-of-Pocket Payments, Catastrophic Health Expenditure, Poverty, Egypt
Cite this paper: Ahmed Shoukry Rashad, Mesbah Fathy Sharaf, Catastrophic and Impoverishing Effects of Out-of-Pocket Health Expenditure: New Evidence from Egypt, American Journal of Economics, Vol. 5 No. 5, 2015, pp. 526-533. doi: 10.5923/j.economics.20150505.13.
Article Outline
1. Introduction
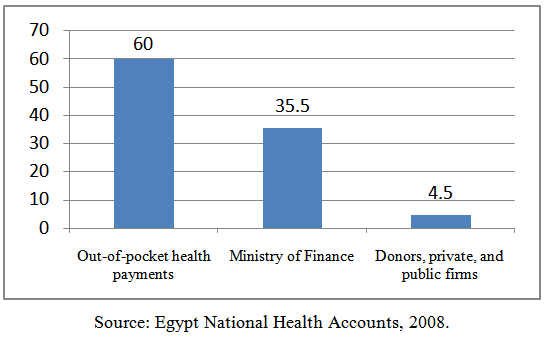
- Poverty alleviation remains a major challenge in Egypt, one that has taken on increased salience after the 2011 revolution, which called for social justice. In 2007, the World Bank announced that poverty is affecting two in every five citizens in Egypt (World Bank, 2007). Several studies have examined poverty in Egypt, but very few such as Abou-Ali (2007) and Elgazzar et al. (2010) have examined the impact of OOP healthcare payments on exacerbating poverty. OOP payments have become the principal mean of financing healthcare in Egypt. According to the National Health Accounts, in 2008, OOP payments accounted for 60% of health spending in Egypt. Reliance on OOP payments in financing healthcare exposes households to the risk of incurring a large medical expense, in the case of illness. Therefore, health shocks could push households into financial catastrophe, resulting from healthcare payments and lost earnings due to inability to work (Xu et al., 2003). The Seventh round of the Egyptian Family Observatory Survey revealed that 80% of households have at least one member covered by public health insurance. However, the survey pointed out that only 25% of households are benefiting from the public insurance, due to the low quality of services and excessive red tape. This suggests that health shocks may push non-poor into poverty, and exacerbate the poverty of the poor (Information and Decision Support Center, 2010).Health expenditures are considered catastrophic if they force households to reduce their basic consumption, sell assets, and borrow, so as to pay for healthcare to an extent that leads to disruption to their living standards. There are two approaches to measure the extent of catastrophic health expenditure: Van Doorslaer et al. (2007) approach and Xu (2005) approach. Both approaches share the intuition that OOP expenditures on health services should not exceed a certain threshold. Van Doorslaer et al. (2007) suggested that OOP expenditures on health services are considered catastrophic if they exceed a pre-specified fraction of the household total expenditure. On the other hand, Xu (2005) considered OOP expenditures on health services, catastrophic if it exceeds 40% of non-subsistence expenditure. Previous studies that addressed OOP payments, and catastrophic health expenditure in Egypt, such as Abou-Ali (2007) and Elgazzar et al. (2010), have investigated the extent of catastrophic expenditure by using the approach of Van Doorslaer et al. (2007). To the best of our knowledge, no study has examined the extent, determinants or impoverishing impact of catastrophic expenditure in Egypt based on the methodology of Xu (2005). Thus, the current study seeks to fill this gap in the literature.The paper is organized as follows: Section 2 presents a review of the related empirical literature. Section 3 provides an overview on the structure of the health system financing in Egypt. The data is described in section 4. The empirical methodology of the paper is presented in section 5. Section 6 discusses the results. Section 7 summarizes the findings of the paper and proposes some policy recommendations. Section 8 concludes the paper.
2. Literature Review
- A growing literature has emerged to examine the extent of catastrophic health payments, and the impoverishing impact of OOP health expenditures, in a wide range of countries, and using different methodologies (e.g. Van Doorslaer et al., 2007; Elgazzar et al., 2010; Shahrawat and Rao, 2012; Van Minh et al., 2013; Narcı et al., 2015). Impoverishment due to OOP health payments occurs when households who are considered to be non-poor are pushed into poverty after the payment for healthcare services. Van Doorslaer et al. (2007) examined the impoverishing impact of OOP payments for healthcare in 11 Asian countries, and found that OOP expenditures exacerbated the extent of poverty. In particular, poverty estimates after controlling for OOP health expenditures were much higher than the conventional estimates, ranging from an additional 1.2% of the population in Vietnam to 3.8% in Bangladesh. In another study, Van Minh et al. (2013) examined the catastrophic and poverty impacts of OOP health expenditures in Vietnam, and found that between 2002 and 2010, 4 to 5% of households have incurred catastrophic health expenditure, and between 3 to 4% of households have been impoverished because of OOP payments for healthcare. Shahrawat and Rao (2012) found that 5% of the households in India suffered from catastrophic health expenditures, and that the poverty deepening impact of OOP health payments was at a maximum among people below the poverty line compared to those above the poverty line. Narcı et al. (2015) reported an increase in catastrophe, and poverty in Turkey due to OOP health expenditures during the period 2004 to 2010.It has been documented that government health financing plays a vital role in protecting households from financial catastrophe. In a study of 59 countries, Xu et al. (2007) found a negative correlation between the extent of catastrophic expenditure, and the size of public health spending. In addition, reducing reliance on OOP payments in financing healthcare also contributes to the protection of households from financial catastrophe resulting from illness. Xu et al. (2003) identified three preconditions for catastrophic health expenditure: expensive healthcare, poor population and the lack or failure of health insurance to cover health expenses. There is limited evidence on the magnitude of catastrophic health payments, and the poverty impact of OOP health expenditures in Egypt. To the best of our knowledge, only two cross-country studies, Abou-Ali (2007), and Elgazzar et al. (2010) have explored the catastrophic and the impoverishing impact of health expenditure in Egypt using the Van Doorslaer et al. (2007) approach. In a cross-country study, Elgazzar et al. (2010) examined the extent of OOP payments for healthcare, and its effect on living standards in Six Middle East and North African countries including, Yemen, the West Bank and Gaza, Egypt, Iran, Tunisia, and Lebanon. They found that on average, OOP expenditures constituted 49% of total national healthcare expenditure, and that households paid an average of 6% of their total expenditure on healthcare services. 7 to 13% of households faced catastrophic health expenditures, and poverty rates increased by up to 20% after healthcare spending is accounted for. They also found that lower-income, and rural households faced greater risk of experiencing catastrophic health expenditure.The current study differs from previous related studies, which examined Egypt, along several dimensions. First, unlike previous studies, the current study uses a logistic regression model to examine the determinants of catastrophic health expenditure. This is to identify the factors, which increase the risk of experiencing a financial catastrophe due to health expenditure. Identifying these risk factors would help in designing effective policy measures, which would help protect poor households from financial risks. Second, the current study uses a different dataset, and a different methodology. In the current study, we used the Eighth Round of the Egyptian Family Observatory Survey (FOS), which is recent data set, and we utilized Xu (2005) methodology, unlike the other two studies, which used the Van Doorslaer et al. (2007) methodology.In sum, this paper adds to the extant literature by providing empirical evidence on the prevalence, intensity, and determinants of catastrophic health payments, and the effect of OOP health expenditures on impoverishment in Egypt on which limited research has been conducted.
3. Structure of Health System Financing in Egypt: An overview
- The health system in Egypt provides healthcare services through three channels: government sector, private sector, and civil society. The government sector includes the different ministries that provide health services such as, the Ministry of Health (MOH), Ministry of Higher Education, Ministry of Defense, and the Ministry of Interior. In addition, the government sector includes Health Insurance Organization (HIO), and the Curative Care Organization (CCO), which are financially independent organizations under the authority of MOH. The private sector refers to for-profit hospitals, clinics, and pharmacies. The civil society consists of non-profit NGOs, including religious healthcare providers.
 | Figure 1. Healthcare Financing in Egypt |
4. Data
- This paper uses data from the Eighth Round of the Egyptian Family Observatory Survey (FOS) conducted in September 2010. FOS is a nationally representative survey of the Egyptian population, drawn from all governorates except the border governorates, and was launched by the Information and Decision Support Center (IDSC). The survey has micro data on a wide range of socio-demographic variables, such as household social status, education level, and distribution of household expenditure, along with other demographic information. The sample size is 10,550 households, weighted to be nationally representative (IDSC, 2010). To calculate the size of the catastrophic health expenditure, the following variables are utilized from the FOS:• Food expenditure
 refers to the amount spent on all food and drinks.• Food expenditure share
  is given by the monthly amount spent on food and drinks divided by the total household expenditure. It is reported in the survey as a percentage of total households spending. • Total household expenditure
  consists of all monthly payments on all goods and services. • Household size
  refers to the number of individuals in a household. • OOP payments on health refer to the payments made by households at the point of receiving health services. It includes treatment and medication payments. The OOP payments are net of any insurance reimbursement.
5. Empirical Methodology
5.1. Incidence of Catastrophic Health Expenditures
- A household is considered to be facing catastrophic health expenditure if OOP expenditures on healthcare are greater than or equal 40% of the household’s capacity to pay
 Capacity to pay is the difference between total household expenditure and subsistence expenditure
  is calculated using the methodology of Xu (2005) which is explained in the following steps: First, large households gain from the economies of scale of the household size. Thus, to take into account the effect of the household’s economies of scale,
  is adjusted as in Equation (1).
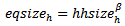 | (1) |
 is the equivalent household size,
  is the actual household size, and
  reflects the economies of scale. Previous studies suggested 0.56 as a value for
  (Xu, 2005).Second, adjusted food expenditure (
 ) is calculated by dividing food expenditure
  by
by  as in Equation (2).
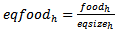 | (2) |
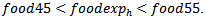
 that is in the
  to
to  percentile range across the whole sample. A weighted average of
  in the 45th to the 55th percentile range is then calculated as in Equation (3).
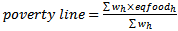 | (3) |
 Lastly, to get
  for a household, the poverty line is multiplied by its
  as in Equation (4).
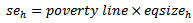 | (4) |

5.2. Determinants of Catastrophic Health Expenditures
- To examine the determinants of catastrophic health expenditures, we used a logistic regression model as in Equation (5), which was adopted from the World Health Organization report (Xu, 2005).
 | (5) |
 is a dummy variable equals one if a household is facing catastrophic health expenditure, and equals zero otherwise. The logistic regression in Equation (5) included the following standard set of covariates: place of residence: urban, rural (reference group); sex of household head: male, and female (reference group); working status of household head: employed, and unemployed (reference group), household head education: educated, and non-educated (reference group); private insurance coverage: at least one member insured, and none (reference group); expenditure quintile; household size; age dependency ratio (number of aged member(s) to number of working age member(s) within household); number of public health insured member(s) divided by
  ; number of chronically sick member(s) divided by
  and number of children less than 5 years old.
5.3. Impoverishment and Poverty Gap
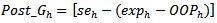
- The conventional methodology of measuring poverty defines a poverty line expressed in monetary values. Households in poverty are those whose level of expenditure is below the poverty line (World Bank, 2011). In addition, the normalized poverty gap is commonly used to reflect the intensity of poverty. It estimates the amount to which households fall below the poverty line as a percentage of that line. However, these measures do not take OOP health payments into account (Doorslaer et al., 2007). Thus, to show the impact of OOP health expenditures on the poverty headcount and normalized poverty gap, the methodology of Xu (2005) is utilized.A household is impoverished due to OOP health expenditures when its total spending falls below the poverty line after paying for the healthcare services. Therefore, the difference in the poverty headcounts before and after OOP payments for healthcare reflects the poverty impact of OOP health payments, or what is called the “impoverishment impact”. A new dummy variable
 is created to examine the impoverishment impact of the healthcare payments. It equals one when the total household spending falls below
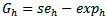
  after paying for healthcare, and equals zero otherwise. To determine the effect of OOP payments for healthcare on the intensity of poverty, we calculate the difference between the normalized poverty gap before and after making OOP health expenditures. The normalized poverty gap is calculated before OOP deduction as in Equation (6).
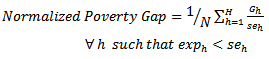 | (6) |
 for poor households; the gap equals zero for non-poor households. Then the normalized poverty gap is re-calculated after making OOP health payments as in Equation (7).
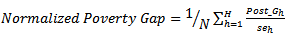 | (7) |
 for poor households, including households that spend less than
  after making OOP health expenditures. While for non-poor households, the normalized poverty gap equals zero. We compare the conventional normalized poverty gap, and the normalized poverty gap after paying for healthcare. The World Bank software ADePT is used to calculate these measures. It is designed to simplify the calculation of poverty measures for raw disaggregated data sets.
 6. Results
6.1. Incidence of Catastrophic Health Expenditures
- Results show that OOP health payments expose 6% of households in Egypt to encounter catastrophic health expenditure, which influenced households at all expenditure quintiles, but with a different degree. The poorest quintile has the highest incidence of catastrophic health expenditure, while the richest quintile has the lowest. The Chi-Square test (Pearson chi-square=151, p-value=0.000) suggests that there is a significant relation between the extent of catastrophic health expenditure within each quintile, and the level of expenditure, as households at the poorest quintile are more likely to encounter catastrophic health expenditure compared to the other quintiles. The proportion of households encountering catastrophic health expenditure at the second, middle, and fourth quintile is very similar, as their level of total expenditure is very close (refer to Figure 2).
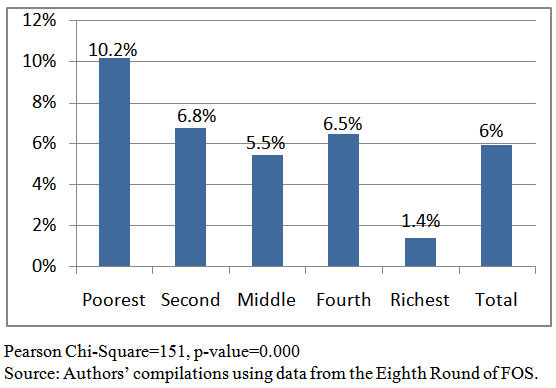 | Figure 2. Catastrophic Health Expenditure-by-Expenditure Quintiles |
6.2. Impoverishment and Poverty Gap
- The adopted methodology reveals that the poverty line for a household composed of a single member equals LE 310 per month, which is equivalent to $2 per day. On the other hand, the food poverty line estimation is based on the cost of obtaining 2470 calories per day per person (Egyptian Ministry of Economic Development, 2008). In 2010, Egypt Human Development Report suggested that the cost of obtaining 1000 calories was nearly LE 2 (United Nations Development Program, 2010). The food poverty line for a household composed of single member is, therefore, LE 5 per day, or LE 150 per month. For a household composed of four members, which is the average size of households in Egypt, the poverty line, based on the adopted methodology, would be LE 5.6 per day per household member. This reflects the reliability of the study's methodology, and points out to the consistency of the IDSC dataset with other datasets. The conventional methodology of measuring poverty suggests that 19.1% of households spend below the poverty line. This estimate is very close to the estimate of the Egyptian Ministry of Economic Development, which is 19.9% (Egyptian Ministry of Economic Development, 2008). However, an additional 7.4% of households are pushed below the poverty line after paying for healthcare. Thus, the extent of poverty, including those who are impoverished by health payment, is 26.5%. Figure 3 displays the impoverishment impact of OOP health expenditures by expenditure quintiles. As shown, the proportion of impoverishment at the poorest quintile is very low, as households at the poorest quintile are already living below the poverty line. The impoverishment impact of health payments reaches the middle quintile. None of the households in the fourth and richest quintiles are impoverished by OOP health payments. The second quintile has the highest proportion of households being pushed into poverty.
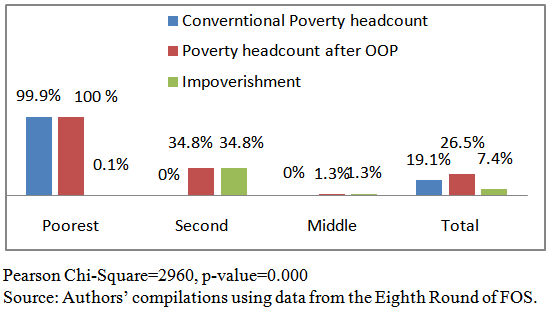 | Figure 3. Impoverishment Impact of OOP Health Payments by Expenditure Quintiles |
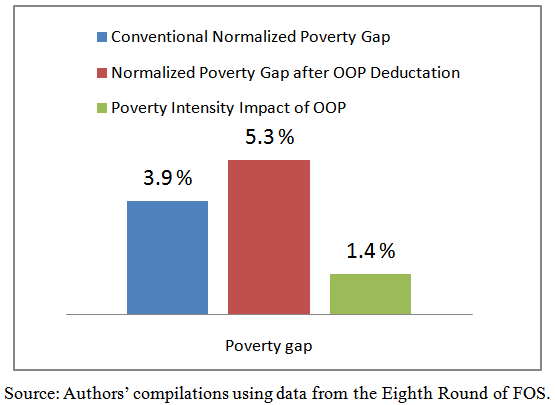 | Figure 4. Impact of OOP Health Expenditures on Poverty Intensity |
6.3. Determinants of Catastrophic Health Expenditures
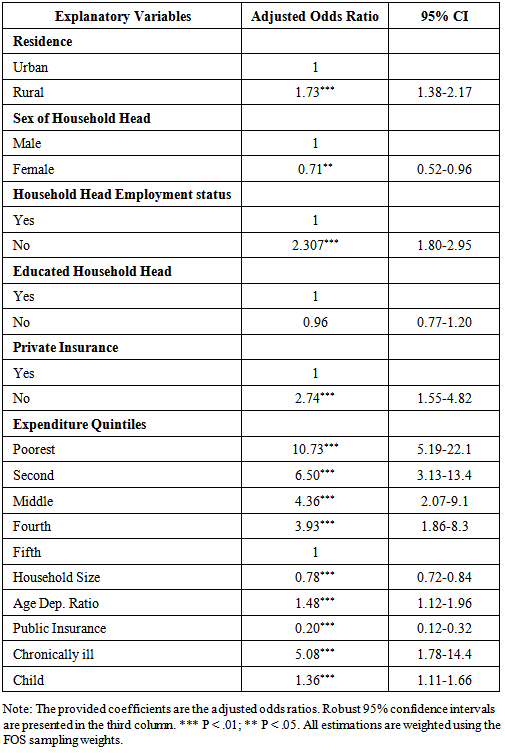
- Table 1 presents results of the multivariate logistic regression model for the determinants of catastrophic healthcare expenditure. The results reveal that rural households are less protected against catastrophic health expenditure than urban households. In particular, rural households are more likely to incur catastrophic health expenditure compared to urban households (Odd Ratio (OR) =1.73; 95% Confidence Interval (CI) = 1.38-2.17). Employment and insurance coverage are protective factors against catastrophic health payments. The odds of catastrophic health expenditure are higher among households with no private health insurance (OR=2.74; 95% CI=1.55-4.82), and households whose head is not employed (OR=2.30; 95% CI = 1.80-2.95).
|
6.4. Chronic Disease and Catastrophic Health Expenditure
- Chronic disease is a key risk factor for catastrophic health payments. Figure 5 illustrates that 31% of households that encountered catastrophic health expenditure have at least one chronically sick member. In particular, 8% of households with at least one member suffering from heart disease are facing catastrophic health payments, while 7% of households with at least one member suffering from diabetes are encountering catastrophic health expenditure. 7% of households with at least one member suffering from bone illness are facing catastrophic health payments.
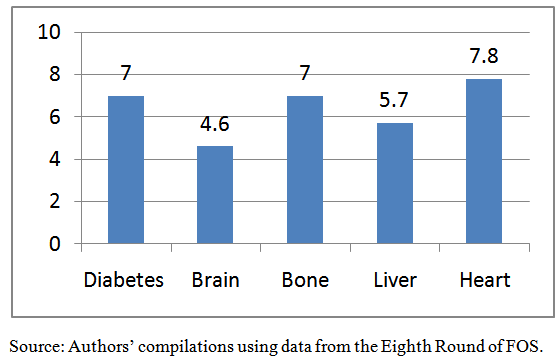 | Figure 5. Chronic Disease and Catastrophic Health Expenditure |
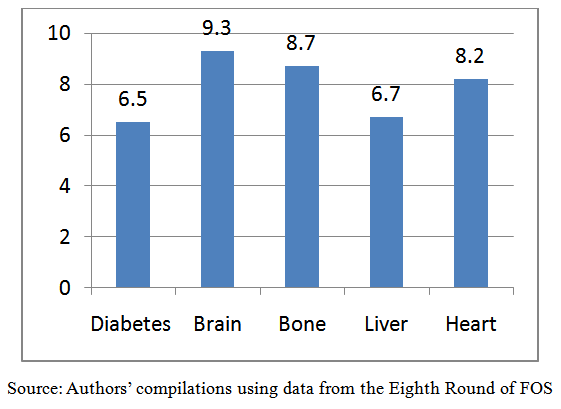 | Figure 6. Chronic Disease and Impoverishment |
7. Discussion and Policy Implications
- Empirical results showed that households at different expenditure quintiles are all exposed to catastrophic health expenditure, with different degrees. In general, high OOP health expenditures drive 6% of households to encounter financial catastrophe. The poorest quintile is the most vulnerable to catastrophic payments. The analysis illustrated that 7.4% of households fell below the poverty line after controlling for healthcare expenditures. More than one third of households at the second quintile were pushed into poverty because of OOP health payments. The OOP health expenditures have exacerbated the poverty gap by 1.4%.The prevalence of catastrophic health expenditure and impoverishment in Egypt is higher than many lower middle-income countries. For instance, the size of impoverishment in some poor Asian countries like Bangladesh, India and Sri Lanka is below 3.8%, which is half the extent of impoverishment in Egypt (Van Doorslaer et al., 2007).The results of the logistic regression analysis suggest that factors such as economic status, proxied by expenditure quantiles, employment status of the household head, insurance coverage, and chronic illness are significant determinants of catastrophic health expenditure. Accordingly, health and social policy reforms such as developing an exemption scheme for the poor households with chronic illness would help to reduce the extent of catastrophic payments and impoverishment in Egypt.The findings of the current study are similar to that of several previous studies. For example, Arsenijevic et al. (2013) found that OOP health expenditures have a catastrophic effect on poor households in Serbia. They also found a higher likelihood for catastrophic OOP health payments in rural areas, in larger households, and among chronically sick household members. In an earlier study, Cavagnero et al. (2006) used the same methodology, as in the current study, for Argentina, which is an upper middle-income country, and found that having aged members in the household increases the likelihood of catastrophic payments. They also found that an employed household head is more protected from catastrophic payments, and households in the richest quintile are the most protected relative to other quantiles. However, in the Argentinean case, having young children does not increase the risk of facing catastrophic payments. Unlike Egypt, education in Argentina protects households from catastrophic payments (Cavagnero et al., 2006).The current study is not free from limitations. One limitation is its cross sectional design, which limits our ability to make causal inferences, and to examine how the problem of catastrophic health payments, and the impoverishing impact of OPP health expenditures evolve over time. The availability of longitudinal data in the future would facilitate conducting further research to study the dynamics of the problem under investigation, which will help in designing effective policies to tackle it. Based on the findings of this study, we suggest some policy measures to protect households from encountering catastrophic health payments and impoverishment. One policy measure is to develop an exemption scheme for households that are more likely to face catastrophic expenditure. This includes poor households with chronically sick members, young children, and uninsured poor households. Another strategy is developing new public health facilities in governorates with high impoverishment rates, such as Qena and El Sharkia. Increasing public investments in the health sector are also needed to cope with the increasing demand for the publicly provided healthcare services. Previous studies suggest that the share of government spending on health is a key determinant of the size of catastrophic health payments across countries.Health financing system in Egypt is facing numerous obstacles, which hinder the public provision of free healthcare services as suggested by the constitution. The government of Egypt is one of the lowest spenders on healthcare across lower middle-income countries. In addition, the poor quality of public healthcare services pushes households to use expensive private health providers. Moreover, the national health insurance does not cope with the beneficiaries’ needs or protects households from the financial risks associated with illness. As a result, households are overburdened by OOP health payments, and the current situation is conducive to the growth of catastrophic health payments within the society.The findings of this study suggest that reducing reliance on OOP health expenditures, and increasing public health investments would not only increases access to healthcare, and subsequently improves citizens’ health, but also would protect households from financial risks arising from health payments. This paper urges further research on the optimum amount of funds that are needed for achieving universal healthcare coverage in Egypt. Future research should also assess the efficacy of non-traditional health financing mechanisms, such as micro banking on health, and social capital and community based health insurance, on protecting households against catastrophic health expenditure and impoverishment.
8. Conclusions
- OOP payments for healthcare pushed 6% of households in Egypt to encounter financial catastrophe, and exacerbated the poverty gap by 1.4%. 7.4% of households were impoverished after controlling for healthcare expenditures. The risk of catastrophic health expenditure was higher among rural households, those with no health insurance, households whose head was not employed, households with young children, and those with a chronically sick member. Anti-poverty policies in Egypt should target vulnerable households with high risk of experiencing catastrophic health expenditure.
ACKNOWLEDGMENTS
- We would like to thank the anonymous reviewers, and the academic editor of this journal for the invaluable comments and suggestions that substantially improved the manuscript. We would also like to thank Samer Atallah, Sherine Shawky, Laila El Baradei, Jennifer Bremer, Ford Foundation, and the Social Research Center at the American University in Cairo for useful comments and support on an earlier version of the manuscript.