Thitivadee Chaiyawat, Pojjanart Vinijpitayakul
Department of Statistics, Chulalongkorn Business School, Chulalongkorn University, Thailand
Correspondence to: Thitivadee Chaiyawat, Department of Statistics, Chulalongkorn Business School, Chulalongkorn University, Thailand.
| Email: |  |
Copyright © 2015 Scientific & Academic Publishing. All Rights Reserved.
Abstract
Natural catastrophes continue to significantly rise in these recent years. Catastrophe risk quantification is to explore to optimize capital consumption for hedging catastrophic losses. This study therefore focuses on the Loss Distribution Approach (LDA) measuring catastrophe risk economic capital based on financial service firm’s own historical loss data. Severity distribution is generated employing mathematical convolution usually conducted by Monte-Carlo simulation in practice. Catastrophe losses in this study are classified into 3 risk event types which are 1) flood, 2) windstorm, and 3) earthquake. The data of catastrophe risks of an insurance company in Thailand used in this study are from 2005 to 2012.Firm-wide catastrophe losses distribution is believed to have strong dependence on the loss distribution of each risk event type. Therefore, this study conducts a dependence analysis between catastrophe risk profile of an insurance company using Gaussian, Student’s t, and Gumbel copula. Modeling dependence between severities and frequencies using dependence between risk profiles grasps diversification benefits and yields lower economic capital for catastrophe risk of an insurance company. In the case of believing that catastrophe loss would have the pattern of large claim similar to the past two years Gumbel copula, used under extreme value assessment, indicates that insurance company should hold a capital of THB1,870 million or 77% of an insurer’s total available capital to hedge against catastrophe risks. However, if an insurer believes that catastrophe, especially flood, occurring in the past two years was the rare event, Gaussian copula assessment suggests that economic capital of only THB645 million, 27% of total available capital, should be enough to make sure that an insurer would be 99.9% financially solvent.
Keywords:
Catastrophe Risk, Economic Capital, Insurance, Copula
Cite this paper: Thitivadee Chaiyawat, Pojjanart Vinijpitayakul, Catastrophe Risk Capital Charge: Evidence from the Thai Non-Life Insurance Industry, American Journal of Economics, Vol. 5 No. 5, 2015, pp. 488-494. doi: 10.5923/j.economics.20150505.08.
1. Introduction
The term “catastrophe” in the property insurance industry denotes a natural or man-made disaster that is unusually severe. Such an event is generally considered a catastrophe by the insurance industry when claims are resulted in a large number of individual losses involving many insurance policies and expected to reach a certain amount threshold. Currently the threshold is set at USD25 million, and more than a certain number of policyholders and insurance companies are affected (Insurance Information Institute [1]). Natural catastrophes such as floods, storms, earthquakes, and hails have been the key risks for non-life insurers for decades. The average annual cost of insured claims from natural catastrophes has increased eight-fold since 1970. Claim amount has been increased from USD5 billion in the 1970s and 1980s to over USD40 billion in 2010 (Allianz Global Corporate & Specialty [2]). Natural catastrophe losses continue to significantly rise in these recent years. The main reason is economic growth, population growth, urbanization, and a higher concentration of assets in exposed areas. In addition, the impact of climate change also contributes on the loss. This leads to a 10-year average in 2004 to 2013 insured losses from weather-related events average rose to a 0.077% of global GDP. In 2013, Swiss Re reported that insured worldwide losses in a total of USD37 billion are from natural catastrophe (Sigma [3]). Therefore, catastrophe risk has been a challenge for insurance industry due to a series of claim threatening insurers’ liability. High claim liability of an insurance company of course affects insurer’s financial solvency.Solvency II framework aiming on insurer’s financial solvency therefore recognizes that recently it is a new wave of demand for insurer to maintain sufficient capital in the future to cover catastrophe risks. It defines catastrophe risk as “the risk of loss, or of adverse change in the value of insurance liabilities, resulting from significant uncertainty of pricing and provisioning assumptions related to extreme or exceptional events” (Munich Re [4]). Catastrophe risk quantification is to explore the catastrophe risk sensitivity inherent in the methodology to optimize capital consumption for hedging catastrophic losses (Amendola [5]). Insurance regulators in many countries are therefore triggering the development of a sound internal catastrophe risk model and quantification (International Association of Insurance Supervisors [6], [7]).NAIC [8] proposed catastrophe risk capital charge based on the worst once-in-100 years. Data will be used in the calculation of the catastrophe risk-based capital charge for property insurance companies. Using the worst year in 100 means that aggregate losses from possible multiple events in one year should be modeled, not the worst single occurrence one in 100 year event. Risk-Based Capital (RBC) proposed by a catastrophe risk working group in 2014 would charge capital based on a property insurer’s catastrophe risk exposure for earthquake and hurricane by multiplying the RBC factors by the corresponding modeled losses and reinsurance recoveries. The charges for the hurricane and earthquake perils will be considered to be independent of each other.Solvency II proposed 2 valuation methods for insurance companies to test for catastrophe capital requirement. The two valuation methods are 1) Method 1: Standard Scenarios, and 2) Method 2: Factor-Based Approach (Munich Re [4]). Method 1 draws a distinction between natural catastrophes and man-made catastrophes. First, the catastrophe capital requirements for each peril are aggregated at country level to determine the catastrophe risk capital per peril. The catastrophe risk capital requirements are summed using a correlation matrix. The natural catastrophe risk capital and the risk capital for man-made catastrophes should then be aggregated on the assumption that they are independent of each other. Method 2 is a factor-based approach. The capital requirement is calculated by multiplying a risk factor by a volume figure. The risk factors relate to individual events. The volume figure is calculated by apportioning the gross premiums written for a business segment to the events. It was noted that insurance companies should only use method 2 only if a company is not able to use method 1. Risk capital requirements vary considerably between countries across Europe. Some countries has capital requirement for natural catastrophes relates to windstorm scenarios. However, many countries have main risk exposure to earthquake. While in the other European Union (EU) countries flooding accounts for more than 80% of the main risk exposure. On average in the EU, just under 40% of natural catastrophe capital requirements relate to windstorm scenarios, around a third to flooding and 12.5% to each of earthquake and hailstorm. The Monetary Authority of Singapore (MAS) proposed, in 2012, new risk categories--spread risk, operational risk, insurance catastrophe risk and liquidity risk--calculated for insurance risk-based capital charge according to RBC phase II framework (Munich Re [9]). MAS would like insurers to capture this catastrophe risk impact which includes man-made and natural catastrophe scenarios on both life and general insurers’ financial solvency (McHugh [10]).For life business, the explicit insurance catastrophic risk charge can be derived based on a pandemic event. The Office of Insurance Commission (OIC), a regulator of Thailand’s insurance industry adopted RBC in 2011 and has proposed RBC Phase II, tentatively implementing in 2016, to further measure operational risk, liquidity risk, group risk, and insurance catastrophe risk. Among new risks proposed for RBC phase II, catastrophe risk may be the most crucial risk for the Thai property casualty insurance industry. This is because in 2011 was a very notable year in Thailand as the country endured enormous damage in the wake of the worst flooding in at least five decades. Economic losses were estimated by the World Bank at THB1.4 trillion (USD45.7 billion), which makes the floods one of the top five costliest natural disaster events in modern history. It was expected that insured losses from the July-December floods were in excess of THB337.0 billion (USD10.8 billion) (Aon Benfield [11]). Therefore, an analysis of catastrophe risk impact on the Thai insurer’s capital structure is interesting for all stakeholders.Loss Distributional Approach (LDA) measures catastrophe risk economic capital based on historical loss data. LDA involved two types of distribution fitting and analysis which are loss and frequency distribution. Then severity distribution is generated employing mathematical convolution usually conducted by Monte-Carlo simulation in practice (Glasserman [12]). Catastrophe loss data of general insurance company in Thailand are mainly from flood, windstorm, and earthquake. Firm-wide catastrophe losses distribution is believed to have strong dependence on the loss distribution of each risk event type—flood, windstorm, and earthquake (Zhao [13]). Copula is a function that joins or couples multivariate distribution function and marginal distribution function. Marginal and joint distribution function can be separated by using copula with appropriate dependence structure. It makes copula very useful to model multivariate distribution in practical views (Kole, et. al. [14]).
2. Purpose of the Study
This study investigates the implication for using internal model under actuarial loss distribution approach as a method to assess economic capital charges for catastrophe risk for property casualty insurance companies.
3. Importance of Research
This study is important for at least three reasons. First, this study estimates economic capital for property casualty insurance companies on the basis of capital optimization. The amount of capital required under catastrophe loss based on historical data of an insurer’s experience.Second, the study recognizes that some insurance firms have dependent or correlated losses and risk event types which may cause a lower requirement of capital charges for hedging financial insolvency due to catastrophe risk coverage. Therefore, copula is employed in this study to find the magnitude of correlation and therefore a reduction in catastrophe risk capital requirement.This research additionally expands the body of knowledge related to risk-based capital of the insurance industry in developing countries. Despite the importance of the capital requirement under a risk-based capital philosophy, not many studies have examined catastrophe risk economic capital charges of an insurance market especially in a developing country.
4. Insurance Review of Literature on Efficiency
National Association of Insurance Commissioners (NAIC) risk-based capital requirement for catastrophe risk charge calculates the sum of (1) net catastrophe loss and (2) additional component intended to address the risk of ceded reinsurance being uncollectible, for the worst year in 100. This approach is also used for the calculation of the earthquake catastrophe charge, and the hurricane catastrophe charge (Navigation Advisors [15]). The formula used to calculate either earthquake or hurricane loss is as follows: | (1) |
Value-at-risk (VaR) at 99th percentile of the catastrophe losses would be used to calculate earthquake and hurricane catastrophe capital charge.The Monetary Authority of Singapore (MAS) allowed insurers to develop their own empirical model as an alternative to the standardized approach to quantify required capital for catastrophe risk. Financial resources are required to meet at least total risk requirement corresponding to a VaR 99.5% over one-year period.
5. Methodology
This study will use LDA to quantify natural catastrophe risk capital for an insurer. First loss occurrence in a random variable modeled by a counting process in a given time horizon, typically one year, will be adopted to conduct frequency distribution. Frequency distribution is usually a Poisson distribution. This study however uses development factors of reported claim count or frequency in order to be able to simulate development factors of claim counts for each accident year and each development year. This is because claim may develop more than one year before it is ultimate. Therefore, Gamma distribution or Cauchy distribution may be more appropriate for the distribution of development factors of frequency.Second loss distribution will be calibrated by using information of catastrophe loss amount which is also known as severity. The independency of loss occurrence distribution and that of the loss severity sequence is assumed in this study. This paper uses development factors of average claim in order to be able to simulate development factors of average claims for each accident year and each development year. The average claim incurred is calculated as follows:  | (2) |
Therefore, Exponential distribution, Lognormal distribution, Pareto distribution, Logistic distribution, Weibull distribution or Gamma distribution may be more appropriate for the distribution of development factors of average severity.Ultimate losses for each accident year under the multiplication of 10,000 Monte Carlo simulation values of development factors of claim counts and those of development factors of average claims would reveal catastrophe losses. The Thai regulatory catastrophe risk capital requirement for the insurance industry is currently the 95% of aggregate loss distribution (AggL-1(0.95)).However, the correlation between loss occurrence is feasible. Correlation between loss severities of different classes is also possible. Therefore, to generate aggregate loss distribution, it is needed to conduct mathematical convolution of frequency and severity distribution by using Monte-Carlo simulation and copula function (Afambo [16]; Chavez-Demoulin et.al [17]). Copula function links univariate marginal distributions to their joint distribution. This paper will compute the catastrophe economic capital charge for insurance company in the context of Guassian copula, Student’s t-copula, and Gumbel copula. This approach is based upon the well-known the result of Sklar [18] that any d-dimensional distribution function F with marginal F1,…Fd can be expressed as | (3) |
The function C so-called copula, a distribution function on [0,1]d with uniform marginal. The aggregate catastrophe loss of an insurance company can be written in equation (4) as shown below.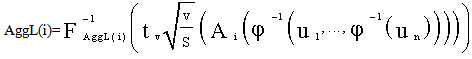 | (4) |
where tv is the cumulative distribution function with v degree of freedom, S is a random number generated from the chi-square distribution random number variable  independent from each of the standard normal variable
6. Catastrophe Loss Data
The data used in this study are drawn from the natural catastrophe loss data of one insurance company during 2005 until 2012. Catastrophe risks are classified for 3 types which are flood, windstorm, and earthquake. Data of average claim incurred during accident year of 2005-2012 would be calculated. Then development factors of average claim incurred during accident year of 2005-2012 would be calculated. Data of reported claim count during accident year of 2005-2012 would be calculated. Then development factors of reported claim count during accident year of 2005-2012 would be calculated.
7. Results
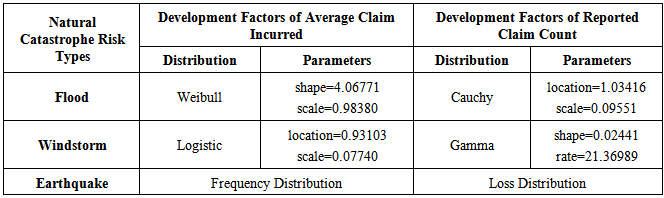
Loss severity and loss frequency for each catastrophe risk event type are simulated according to their distributions and parameters using Monte-Carlo. Flooding, windstorm, and earthquake under Kolmogorov-Smirnov Test have shown that distributions are shown in Table 1. Table 1 also shows distributions and parameters of development factor of frequencies and those of severities of the three catastrophe risk types of an insurance business.Table 1. Parameters and Distributions of Development Factors of Reported Claim Count and Those of Development Factors of Average Incurred Claim of Three Catastrophe Risks of Accident Year 2005-2012
 |
| |
|
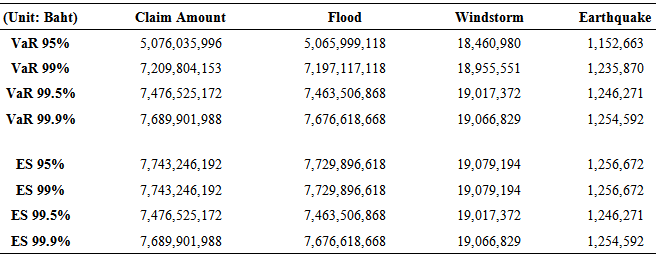
Table 2 shows the value-at-risk (VaR) and expected short fall (ES) of aggregate claim of flooding, windstorm, and earthquake at confidence level of 95%, 99%, 99.5%, and 99.9% without any consideration of correlation between each catastrophe risk.Table 2. Value-at-Risk (VaR) and Expected Short Fall (ES) without using Copula
 |
| |
|
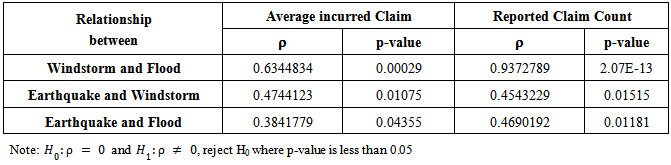
Table 3 shows pearson’s product – moment correlation which is represented by a symbol ofρ (rho). Rho (ρ) has a value from -1 to +1 where negative value means an opposite correlation and a positive value means a positive correlation between each risk. The correlation of each pair of risks are shown below.Table 3. Pearson’s Product – Moment Correlation (ρ) of Each Pair of Risk
 |
| |
|
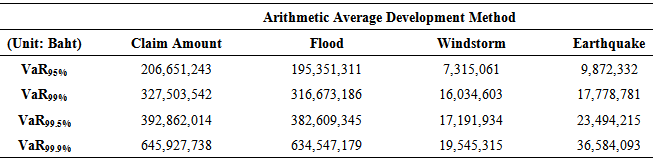
The pears on correlations in Table 3 show that both claim average severity and claim frequency of three catastrophe risks are correlated. Therefore, evaluating economic capital for catastrophe risks should be appropriate using copula techniques. The calibration of the loss severity and frequency distribution for the insurance natural catastrophe risk economic capital in this research is focused on using Guassian copula, Student’s t copula, and Gumbel copula. Modeling dependence between severities and frequencies from different risk and within risk using dependence between risk profile is expected to yield lower economic capital for catastrophe of an insurance company.Table 4, 5, and 6 shows economic capital measuring by VaR under the arithmetic average development method and weighted average for the last two years development method at confidence level of 95%, 99%, 99.5%, and 99.9% with using Monte Carlo Simulation of Gaussian copula, Student’s t copula, and Gumbel copula, respectively.Table 4. Economic Capital Measuring by Value-at-Risk (VaR) With Using Monte Carlo Simulation of Gaussian Copula
 |
| |
|
Table 5. Economic Capital Measuring by Value-at-Risk (VaR) With Using Monte Carlo Simulation of Student’s t Copula with 4 Degrees of Freedom
 |
| |
|
Table 6. Economic Capital Measuring by Value-at-Risk (VaR) With Using Monte Carlo Simulation of Gumbel Copula
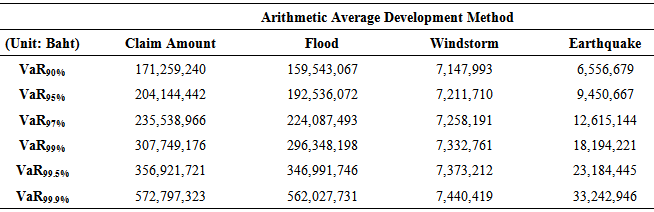 |
| |
|
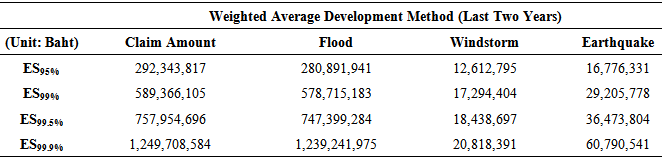
Monte Carlo simulation of Gaussian copula under the arithmetic average development method shows the highest VaR, representing economic capital of an insurance company to prepare for the three catastrophe losses. However, Monte Carlo simulation of Gumbel copula under the weighted average of the last two years development method reveals the highest VaR, representing economic capital requirement, at 99.9% confidence level.Table 7, 8, and 9 shows economic capital measuring by ES under the arithmetic average development method and weighted average development method at confidence level of 95%, 99%, 99.5%, and 99.9% with using Monte Carlo Simulation of Gaussian copula, Student’s t copula, and Gumbel copula, respectively.Table 7. Economic Capital Measuring by Expected Short Fall (ES) With Using Monte Carlo Simulation of Gaussian Copula
 |
| |
|
Table 8. Economic Capital Measuring by Expected Short Fall (ES) With Using Monte Carlo Simulation of Student’s t Copula with 4 Degrees of Freedom
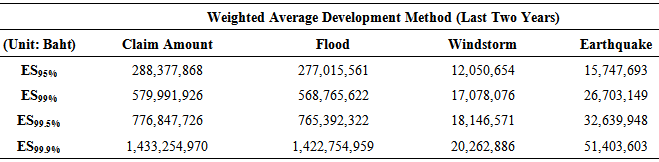 |
| |
|
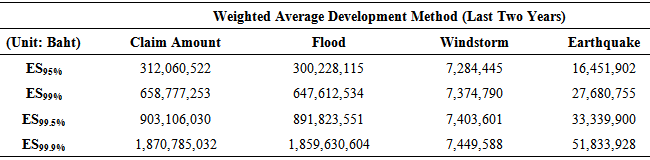
Table 9. Economic Capital Measuring by Expected Short Fall (ES) With Using Monte Carlo Simulation of Gumbel Copula
 |
| |
|
At 95-99% confidence level ES is about the same under Gaussian, Student’s t, and Gumbel. However, at higher confidence level--99.9% Monte Carlo simulation of Gumbel copula under the arithmetic average development method shows the highest ES, representing economic capital of an insurance company to prepare for the three catastrophe losses. In addition, Monte Carlo simulation of Gumbel copula under the weighted average of the last two years development method reveals the highest ES, representing economic capital requirement, at every confidence level.
8. Conclusions
Catastrophe risks of flood, windstorm, and earthquake are dependent. This is shown by the positive correlation of the three catastrophe--earthquake, windstorm, and flood--in Table 3. That is an insured at risk of an earthquake may consequently be exposed to risk of flood. Therefore, copula technique is suit to grasp the dependence of both frequency and severity of these catastrophe risks. Insurance company could refer to value-at-risk (VaR) or expected short fall (ES) as a measurement to hold an economic capital against catastrophe risks. Therefore, the result suggests that an appropriate amount of economic capital for catastrophe risk should fall in the range as shown in Table 4-9. That is the calculated capital amount shown in Table 2, under catastrophe risk independency assumption, is too high for an insurer to hold for supporting three catastrophe risks.Gaussian, Student’s t, and Gumbel copula suggest different levels of economic capital. The higher amount of economic capital means higher financial solvency with a trade-off higher cost of capital for an insurer.As a result, on the one hand if insurers believe that catastrophe loss would have the pattern of large claim similar to that of the past two years, Gumbel copula, used under extreme value assessment, is applicable. The result indicates that an insurer should hold a capital of THB1,870 million or 77% of an insurer’s total available capital to hedge against catastrophe of flood, windstorm, and earthquake. This high amount of capital of course ensures the very low probability of capital shortage, 0.1%, with an adjustment of low expected return to shareholders. On the other hand, if an insurer believes that catastrophe, especially flood, occurring in the past two years was the extremely rare event, Gaussian copula may be suitable for the capital measurement. Economic capital assessment using Gaussian copula suggests that an insurer should hold only THB645 million or merely 27% of total available capital. Such amount should be enough to make sure that an insurer would be 99.9% financially solvent.
References
| [1] | The Insurance Fact Book 2014. Insurance Information Institute. New York, January 2014. |
| [2] | Global Claim Review 2014: Loss Trends and Emerging Risks for Global Business. Allianz Global Corporate & Specialty (AGCS). Munich, Germany, September 2014. |
| [3] | Swiss Reinsurance Company. Natural Catastrophes and Man-Made Disaster in 2013: Large Losses from Floods and Hails; Haiyan Hits the Philippines. Sigma. Zurich, 2014. |
| [4] | Munich Re. Solvency II and Catastrophe Risk: Measurement Approaches for Property Casualty Insurers, May 2011. |
| [5] | Amendola, A., et al. A Systems Approach to Modeling Catastrophic Risk and Insurability. Kluwer Academic Publishers, 2000, 381-393. |
| [6] | International Association of Insurance Supervisors. Principle on capital adequacy and solvency, http://www.Iaisweb.Org/02solvency.Pdf, 2002a. |
| [7] | International Association of Insurance Supervisors. (2002b). Report on solvency, solvency assessment and actuarial issues and some of their practical applications. IAIS SubCommittee on Solvency and Actuarial Issues,http://www.Iaisweb.Org/08151istansolv.Pdf, 2002b. |
| [8] | National Association of Insurance Commissioners. Proposal for Risk-Based Capital Charge for Property Catastrophe Risk Based on the Result of Catastrophe Modeling, NAIC Risk-Based Capital Catastrophe Risk Charge Subgroup, 2010. |
| [9] | Munich Re. Introduction to a New Risk-Based Capital Framework in Singapore-Convergence or Divergence in relation to Solvency II. Munich, Germany, December 2013. |
| [10] | McHugh, M. Introduction of a new risk-based capital framework in Singapore – Convergence or divergence in relation to Solvency II ?. Solvency ConsultingKnowledge Series, 2013, 1-8. |
| [11] | 2011 Thailand Floods Event Recap Report: Impact Forecasting. Aon Benfield. Chicago, March 2012. |
| [12] | Glasserman, P. Monte Carlo Methods in Financial Engineering, Springer, 2003. |
| [13] | Zhao, N. Modelling Dependence in Catastrophe Risk Portfolio and Optimizing Capital Loading. Management, Technology and Economics, Swiss Federal Institute of Technology (ETH). Master of Science, 2010 (73). |
| [14] | Kole, E., et al. Selecting copulas for risk management. Elsevier, 2007(31): 2405-2423. |
| [15] | National Association of Insurance Commissioners. Catastrophe Risk Charge in the P/C Risk-Based Capital Requirement. Navigation Advisors, 2013. |
| [16] | Afambo, E. F. Operational Risk Capital Provisions for Banks and Insurance Companies. Doctoral Dissertation Department of Risk Management and Insurance, Georgia State University, 2006. |
| [17] | Chavez-Demoulin, V., Embrechts, P., and Neslehova, J. Quantitative Models for Operational Risk: Extremes, Dependence and Aggregation, http://www.Math.Ethz.Ch/∼baltes/ftp/manuscript_cen.Pdf. Journal of Banking and Finance, forthcoming, 2005. |
| [18] | Sklar, A. Fonction de Rapartitionsa n Dimension et LeurMarges. Publ. Inst. Stat.Univ. Paris., 1959 (8), pp. 229-131. |
 Abstract
 Reference
 Full-Text PDF
 Full-text HTML