-
Paper Information
- Previous Paper
- Paper Submission
-
Journal Information
- About This Journal
- Editorial Board
- Current Issue
- Archive
- Author Guidelines
- Contact Us
American Journal of Economics
p-ISSN: 2166-4951 e-ISSN: 2166-496X
2015; 5(3): 353-362
doi:10.5923/j.economics.20150503.07
An Empirical Relationship between Share Price and Economic Growth: New Evidence on Selected Industrialized Economies
 Abstract
 Reference
 Full-Text PDF
 Full-text HTML
Mohammad Kamal Hossain1, Anowar Hossain2
1Cardiff Metropolitan University, UK
2Department of Economics and Finance, Brunel University, UK
Correspondence to: Mohammad Kamal Hossain, Cardiff Metropolitan University, UK.
| Email: |  |
Copyright © 2015 Scientific & Academic Publishing. All Rights Reserved.
This study attempts to examine the equilibrium relationship (short and long-run) and the causality relationship between share price and economic growth in the USA, the UK and Japan based on quarterly data for a time period of 22 years ranging from 1991 to 2012. Two econometric models, namely Engle-Granger co-integration and Granger causality are employed in order to uncover the relationship between variables. Overall results indicate the absence of any equilibrium short and long-run relationship between share price and economic growth in the USA and Japan; however, as in the UK, there is no long-run but a short-run relationship exists between the variables. As regards causality, the study finds that changes in share prices provide reliable predictions of near term future economic growth in the USA and the UK. However, changes in economic growth are not related to share price movements, while in the case of Japan, share price movements do not appear to be a useful leading predictor for near term economic growth and vice-versa.
Keywords: Share price, Economic growth, Co-integration, Granger causality, Industrialized/Developed economies
Cite this paper: Mohammad Kamal Hossain, Anowar Hossain, An Empirical Relationship between Share Price and Economic Growth: New Evidence on Selected Industrialized Economies, American Journal of Economics, Vol. 5 No. 3, 2015, pp. 353-362. doi: 10.5923/j.economics.20150503.07.
Article Outline
1. Introduction
- Numerous theories in economics suggest that movement in share prices might affect economic growth significantly in a number of ways; however, empirical studies suggest contentious and inconclusive results (no or strong/weak impact) (Madsen et al., 2013) [1]. Theoretically, proponents often claim that a fall in share prices decreases domestic wealth results in lower demand for domestic money and interest rates, and foreign investors cut their investment down in domestic assets and currencies (Noman et al., 2012) [2], thus affecting GDP negatively which means a pessimistic economic growth can be predicted. In contrast, a rise in share prices increases domestic wealth as domestic and foreign investors become eager to invest in a country’s equities, which leads to capital inflows and currency appreciation (Granger et al., 2000 [3]; Caporale et al., 2002 [4]; Stava´rek, 2005 [5]; Pan et al., 2007 [6]), thus affecting GDP positively so that an optimistic economic growth can be predicted. In the same way, the link between share price and economic growth should be robust provided that the share price is the discounted present value of payouts of firms. The discounted-cash-flow model infers that share prices cause real economic activity if shareholders’ expectations with regard to future payouts of firms are typically precise. In addition, there are other hypothetical propositions underpinning the relationship between these two variables. Tobin (1969) [7] opines that share prices have an effect on the cost of capital as an increase in share price causes a rise in the value of the firm in relation to the replacement cost of its share capital. This subsequently gives rise to increased investment expenditure and to higher volume of aggregate economic yield, because firms become able to accumulate finance easily for investment expenditures. This happens because the investment would be easier as a firm requires a lower share offering in a higher share price situation. Similarly, Modigliani (1971) [8] suggests that a permanent rise in share prices gives rise to an increase in the individual’s wealth holdings to ensure higher permanent income. He postulates that inter-temporally, consumers smooth their consumptions in order to maximize utility, thus, enabling consumers to re-adjust their upward level of consumption in each period.On the other hand, hypothetically, the nexus between share prices and economic growth also hinges on the nature and behavior of the share markets. For example, share prices of the weak-form of market efficiency may not contribute in predicting economic growth in the same way as the semi-strong or strong-form of market efficiency does. The reason is distinct in that the participants in the weak-form of markets are not well informed and behave irrationally comparing to the semi-strong or strong-form of markets. This is because of the dearth of adequate information in a suitable form, structural profile, scarcity of regulations, supervision and lax administration in the application of prevailing rules (Mobarek and Keasey, 2000) [9], absence of well-timed information, high cost of acquiring new information, and perhaps higher uncertainty about the future (Mason, 1972 [10]; Wai and Patrick, 1973 [11]). Consequently, the weak-form of markets moves dramatically over a period of time, which turns the market into a speculative and a gambling one from which large investors and insiders make profit by controlling and manipulating markets. Conversely, it is believed that share markets in industrialized economies like Europe, the USA and Japan, are efficient in the semi-strong or strong form. The salient feature of these markets is that all new and additional available information is reflected in the share price (Singh, 2010) [12] and potential investors purchase shares upon information which is released, and investors are not able to benefit from the market by trading on new information. Consequently, the semi-strong or strong forms of markets are unlikely to move dramatically over a period of time and large investors and insiders are also unlikely to make a profit by controlling the market. Therefore, share prices of these markets symbolize the real economic growth while the weak-form of markets does not. Contrary to theories, plenty of quantitative and qualitative studies have been carried out to sketch the relationship between share market development or share returns and economic growth in an individual or combined country. Share market development or share returns analysis does not make obvious the basic question: whether the share price causes changes in the long or short-run economic growth or development of a country, or whether the causation runs in the opposite direction? Moreover, a number of empirical studies (e.g., Campbell, 1998 [13]; Share and Watson, 2001 [14]; Hassapis and Kalyvitis, 2001 [15]; Bingswanger, 2004 [16]) have been conducted earlier than World financial tsunami of 2008-10, suggesting that share price acts as an important indicator of economic growth and development whereas others do not. The mounting importance of share price volatility around the world has recently opened a new research avenue into the relationship between share price and economic growth, particularly following the contemporary financial tsunami. To the best of our knowledge, however, there has been limited research with regard to the interrelationship between share price and economic growth of industrialized economies following the recent financial turmoil.This paper focuses on the relationship between share prices and economic growth with special references to the USA, the UK and Japan which are the best branded as financially developed markets. The three markets are inter-reliant for numerous reasons, including international diversification, adoption of flexible exchange rates, removal of barriers to capital flow and cross-market return correlations (Wong and Zhou, 2011 [17]). The Japanese financial system, however, is bank-based, which is different from the USA and the UK whose financial systems are market-based. Therefore, the policy makers of the sampled countries need to realize the relationship between these two variables in order to develop appropriate share market policy, and domestic and foreign potential investors are required to also realize the relationship in order to make farsighted investment decisions to gain steady returns.The study runs Engle and Granger (1987) [18] co-integration tests and the Granger (1969) [19] causality tests using quarterly data spanning 22 years. Overall results indicate the absence of any equilibrium short and long-run relationship between share price and economic growth in the USA and Japan. However, as in the UK, there is no long-run but the short-run relationship exists between the variables. As regards the causality relationship, there is a unidirectional causal relationship, i.e. share price can be considered as a leading indicator of economic growth in the USA and the UK, but not vice-versa, while there is no causality relation between variables either ways in the Japan. The rest of the paper is structured as follows: a literature review in Section 2; data and methodology are presented in Section 3, while Section 4 presents empirical results. Finally, Section 5 presents a discussion and conclusions.
2. Empirical Literature Review
- A significant number of studies have thus far examined the relationship between share price behavior and economic growth and development, albeit there are heterogeneous results found from previous studies. For example, Campbell (1998) [13] employs the log-linear asset pricing model to examine the empirical relationship between share prices and output in France, Germany, the UK, Japan and the USA reveals a statistically insignificant relation between variables, and share prices insignificantly cause to output. Later, Share and Watson (2001) [14] bear out Campbell’s the findings. They find evidence that share prices have a negligible predictive content for output at the two, four and eight quarter horizon for each of the seven most developed economies (Canada, France, Germany, Italy, Japan, the UK and the USA). Though, the extent of prediction by share prices for output differs across countries and over decades. However, Hassapis and Kalyvitis (2001) [15] find a statistically significant relationship between real share price changes and output growth of the G-7 economies using the VAR methodology, as predicted by the theoretical model. The bivariate framework also provides worthwhile information for realizing the response of economic growth and real share prices to external shocks.On the contrary, Binswanger (2004) [16] uses a different methodology and comes up with a contradictory conclusion to Campbell but similar to Hassapis and Kalyvitis that there is a statistically significant relationship between industrial production and lagged real share returns for all G-7 countries except for Italy and France. Subsequently, Humpe and Macmillan (2005) [20] also corroborate results of Hassapis and Kalyvitis and Binswanger by using a log-linear model in order to examine the extent to which macroeconomic variables affect share market movements in the USA and Japan. They find a statistically significant relationship; however, to a different extent in both countries that a 1% increase in industrial output triggered a 1.09% increase in the USA share prices while a 1% increase in Japanese industrial output caused a 0.4% increase in Japanese share prices. Similarly, Aboudou (2010) [21] examines the short run and long run impact of stock market development on economic growth in West African Monetary Union by using a time series over the period 1995-2006. The study finds that stock market development positively affects economic growth in West African Monetary Union both in the short run and long run. Similarly, Adusei (2014) [22] examines whether the stock market contributes to the growth of the Ghanaian economy using cointegration and Granger causality in the vector error correction model based on quarterly data (2006Q1–2013Q2). The results of the cointegration analysis indicate that there is a long-run cointegrating relationship between stock market development and economic growth. While the results of the causality analysis exhibit that there is a unidirectional causality running from stock market development to economic growth. Madsen et al. (2013) [1], however, finds divergent results which uses a century of data for 20 OECD (Organization for Economic Co-operation and Development) countries. He finds that there is a positive relationship between stock returns and economic growth over the period 1916-1951, when the output volatility was persistent; however, no relationship is found beyond this period between the variables. These findings are consistent with the predictions of the theoretical model.Many studies (for example, Kwon and Shin, 1999 [23]; Ibrahim, 1999 [24]; Maysami and Koh, 2000 [25]) have examined how share prices act in response to changes in individual macro-economic variables such as inflation, real activity and interest rates. Some others (e.g., Ibrahim and Aziz, 2003 [26]; Liu and Shrestha, 2008 [27]; Zhao, 1999 [28]) examined the co-integration between share price movements and combined macro-economic variables.Kwon and Shin (1999) [23] suggests a long-term relationship between share prices and four macroeconomic variables viz. exchange rate, industrial production index, money supply and trade balance for Korea. Similarly, Ibrahim (1999) [24] exposes a co-integration between share prices and three macroeconomic variables (official reserves, the price level and credit aggregates), and the significant influence of the exchange rates in explaining short-run movements of the share prices. Maysami and Koh (2000) [25] also documents the significant influence of exchange rate and interest rates in the long-run relationship between share prices and a range of macroeconomic variables in Singapore. Later, Ibrahim and Aziz (2003) [26] carried out a study in Malaysia using the co-integration method and vector auto-regression to examine dynamic linkages between share prices and a number of macroeconomic variables viz. money supply, exchange rate and liquidity. The empirical results are consistent with Ibrahim (1999) [24] who advocates the existence of a long-run relationship between these variables and share prices and statistically significantly short-run interactions among them. Similarly, in a study of Liu and Shrestha (2008) [27] on the Chinese share market indices and a set of macro-economic variables, i.e. money supply, industrial production, inflation, exchange rate and interest rates find a long-term co-integrating relationship between share prices and the macro-economic variables. Zhao (1999) [28] also finds a significant positive relationship between share returns and unexpected output growth but a significant negative relationship between shares returns and expected output growth in the Chinese economy. Then again, he finds a statistically significant negative relationship between share prices and inflation; though the reverse relationship is absent following the effects of output growth is controlled. Sarkar (2005) [29], however, conducts a counter research study who claims there are no positive relationship offerings between real share price, other stock market variables and the growth of real GDP and industrial output either in the short or long-run during 1950-51 to 2005. Hsieh (2013) [30], however, examines the effect of selected macroeconomic variables on the New Zealand stock market by using the exponential GARCH model. The result shows that New Zealand’s real GDP positively affects the stock market. However, the ratio of the government debt to GDP, the domestic real interest rate, the nominal NZD/USD exchange rate, the domestic expected inflation rate, and the USA government bond yield negatively effects on the stock market index.The other most stifling and enduring inconclusive issues in economics are the causality relationships between share price and economic growth, i.e. whether share prices causes economic growth or whether it is a consequence of increased economic activities. According to Padhan (2007) [31] both the share price (BSE Sensex) and economic activity (IIP) are integrated of order one, i.e. I (1) suggests the presence of one co-integrating vector which dismisses spurious relations and indicates the existence of no less than one direction of causality. However, the TYDL model suggests that there is a bi-directional causality between share price and economic activity during the post-liberalization period, inferring that a well-organized share market could boost economic activity and vice-versa. However, Liu and Sinclair (2008) [32] find short-run causality running from share prices to output, but not the other way around, however output affects share prices in the long-run.Choi et al. (1999) [33] examines the relationship between lagged real share returns and industrial production (IP) growth rates for the G-7 countries using both in-sample co-integration and error-correction models and the out-of-sample forecast-evaluation procedure, suggesting a long-run equilibrium relationship between the log levels of IP and real share prices, while the error-correction models indicate a correlation between IP growth and lagged real share returns for all countries except Italy. On the other hand, the result of out-of-sample tests show that in several sub-periods the USA, the UK, Japanese, and Canadian share markets enhance predictions of future IP. Similarly, Peng et al., (2009) [34] find a long-run co-integrating relationship between share prices and GDP, and a statistically significant long-run causality from the economy to the share price but not vice-versa. However, they find statistically insignificant weaker evidence of a similar short-run effect. Also, Comincioli (1995) [35] suggests that there is a unidirectional causal relationship between the share price and the economy, i.e. share prices Granger-cause economic activity, but no reverse causality is observed. The empirical results of Comincioli are validated by Duca (2007) [36] who also observed that unidirectional causality between GDP and share prices in the developed economies denotes the economic activity level in a country can potentially rely on the share market behavior amongst other variables.Osamwonyi (2013) [37] examines the causal relationship and the direction of causality between stock market development and economic growth in Ghana, Kenya and Nigeria by using the Granger Causality test for the period 1989 – 2009. The study used five proxies of stock market, namely, stock market capitalization (MC), stock turnover ratio (STO), stock-traded value (TVL), the number of listed securities (LS), and the stock market index (MI). The empirical results show that there is no causal relationship between stock market development and economic growth in Ghana and Nigeria, while a bidirectional causal relationship between stock market development and economic growth confirms it in Kenya. When MC was used as a proxy for stock market development, MC and LS were found to Granger cause economic growth. Bidirectional causality was found between STO and GDP. TVL was found to have a strong negative effect on GDP. Similarly, Ishioro (2013) [38] examines the causal relationship between stock market development and economic growth in Zimbabwe for the period 1990:I to 2010:IV by applying the Augmented Dickey Fuller unit root tests and the long-run Grangernon-causality estimation technique. The empirical results exhibit that in line with the supply leading hypothesis, a bi-directional causality exists between economic growth and stock market development. Nguyen (2014) [39] examines the causality relationship between stock market development and economic growth in Canada and Australia based on the time series data for the period of 1981 Q3 to 2012 Q3. The results of the Granger causality test suggest the causality between stock market development and economic growth in Canada but this is not the case in Australia. The results indicate that stock market and economic growth has a long-run relationship and that stock market development does help improve the future growth in some developed countries.
3. Data and Methodology
- The study uses quarterly data for the time period of 22 years, ranging from 1991 (first quarter) to 2012 (last quarter). Gross Domestic Product (GDP), proxy variable of economic growth and share price (SP) are used as the response and predictor variable, respectively. However, the log forms of GDP and SP are also used for carrying out the estimations. The share price (SP) data of sampled countries are collected from the New York Share Exchange (NYSE), London Share Exchange (LSE) and Tokyo Share Exchange (TSE) and the GDP data from the database ‘DataStream’. In order to obtain results e-views 6.0 software is used for the planned regression.
3.1. Model Specifications
- Two econometric models are employed in order to examine the relationship between share price and GDP. First, the co-integration test is applied to observe a long-term relationship followed by the Error Correction Model (ECM) for short-term relationship between variables. Finally, the Granger causality test is performed to discover the nature of causality between SP and GDP. However, these models require that underlying variables must be stationary, which is examined by using the Augmented Dickey-Fuller (ADF) approach. Therefore, we first carried out a unit-root test to examine the stationary behavior of the data time series.
3.1.1. Unit-root Test
- The ADF approach infers that variables do not have unit roots if variables are stationary, then the series is said to be 1(0). While ‘if variables under investigation are non-stationary in its level form, but stationary in its first-difference form, which means that variables do have unit roots, then they are said to be 1(1)’ (Ageli, 2013, p.4) [40]. The ADF test involves the following regression:
 | (1) |
 is the number of lagged term chosen to ensure that εt is a pure white noise term error and where
 etc. Null and alternative hypothesis defines about the result of the unit root investigation. If the null hypothesis is accepted it means an alternative hypothesis is rejected then the variable is non-stationary, otherwise the variable is stationary. Based on the estimation above, the null and alternative hypothesis of unit root tests are as follows;
 does have unit root – the time series is non-stationary)
 does not have unit root – the time series is stationary)
3.1.2. Co-integration Test
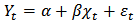
- A co-integration approach is proposed by Engle and Granger (1987) in order to examine the long-run relationship between variables. If two non-stationary time series tend to move together through time, they are said to be co-integrated. According to Engle and Granger, the variables are co-integrated when they are I (1) on their level, but the linear combination is I (0). The following equation is used to observe co-integration by regressing
 with
with 
 | (2) |
 is dependent variable (GDP),
  is an independent variable (SP) and
  is a random error term. Moreover,
  and
and  denote as the estimated regression coefficient vectors, we saved residual vector from the equation (2). Then the equation for the residual vector is:
  | (3) |
 is integrated with order zero. Moreover,
  is called a cointegrating vector if the series is stationary and
 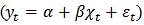 is a cointegrating equation, which means that there is a long-run relationship between variables.Engle-Granger representation theorem suggests that there might have an error correction mechanism if a long-run relationship exists between the variables. For this purpose, Eagle and Granger (1987) [17] suggested an error correction model (ECM) that determines the short-run co-integration between variables. The ECM model specification is as follows:
  | (4) |
 constant,
  first difference of the log of GDP,
  first difference of the log of share price, ECM: Error Correction Mechanism term (saved residual from the first stage of regression).
3.1.3. Granger Causality Test
- Despite having a long and short-run relationship between variables, there might be a causal relationship between them. The Granger causality test has been carried out in order to examine the direction of causality that runs between two variables in our model. This test is designed to discover whether past values of one variable help predict changes in another variable. In our study, for example, SP Granger causes GDP if SP helps to forecast GDP, given past GDP values. SP does not Granger cause GDP if the GDP’s bivariate Wold representation is the same as the univariate Wold representation. Therefore, SP does not Granger cause GDP if the projection of GDP on past GDP and SP is the same as the projection of GDP on past GDP alone. A similar definition applies whether GDP Granger causes SP. The test involves estimation of following two bivariate regression equations:
 | (5) |
 | (6) |
 and
and  is uncorrelated. The study distinguishes four possible different situations of causality relationship between variables from the equation (5) and (6).1. Unidirectional causality from SP to GDP, i.e. SP can predict GDP, but not the other way around. Therefore
  and
and  2. Unidirectional causality from GDP to SP i.e. GDP can predict SP but not the other way around. Therefore
  and
and  3. Bidirectional (or feedback) causality from SP to GDP and GDP to SP as well. Therefore
 and
and  4. Independence between SP and GDP i.e. no Granger causality in any direction between them. Therefore
  and
and  The test is conducted within the framework of f-test. If the p-value of f-test is significant (i.e. α=<0.05) at the 5% significance level, we can reject the null hypothesis.
 4. Empirical Results
- The empirical result begins with the unit root test of the time series in order to examine the data stationary behavior by applying the Augmented Dickey-Fuller (ADF) approach. Later the co-integration and Granger causality test results are presented.
4.1. Unit-root Test Results
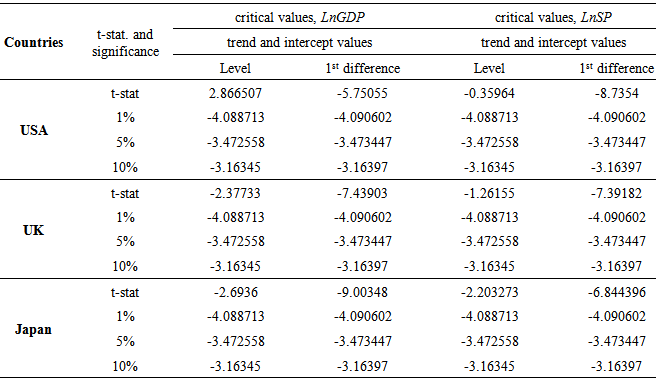
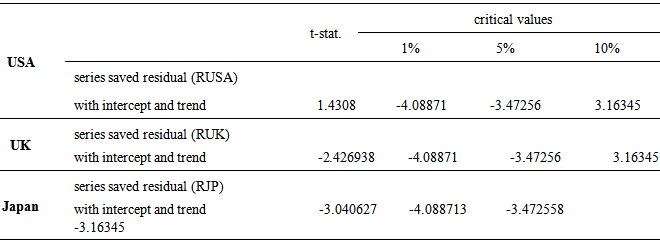
- The unit-root test result of the USA, the UK and Japan shows (Table 1) that t-statistic values of LnGDP with intercept and the trend in the level form is (-2.866507, -2.377333 and -2.6936, respectively) higher than the critical values at 1%, 5% and 10% significance level. Therefore, GDP of all sampled countries is integrated with order I (1) and indicates a non-stationary behavior, thus it fails to reject the null hypothesis. While the 1st difference form of LnGDP of all sampled countries is integrated with order zero (0) as the t-statistic values with intercept and trend is (-5.75055, -7.439207 and -9.00348, respectively) less than the critical values at same significance levels, which means the series is stationary. Similarly, t-statistic values of LnSP of all sampled countries with intercept and trend in the level form is (-0.359637, -1.261546 and -2.203273, respectively) higher than the critical values at 1%, 5% and 10% significance level inferring that they are integrated with order I (1) and shows non-stationary behavior. However, the unit-root test for the SP at 1st difference form shows stationary as the t-statistic values with trend and the intercept is (-8.7354, -7.391821 and -6.844396, respectively) less than the critical values at the same significance levels.
|
4.2. Co-integration Test Results
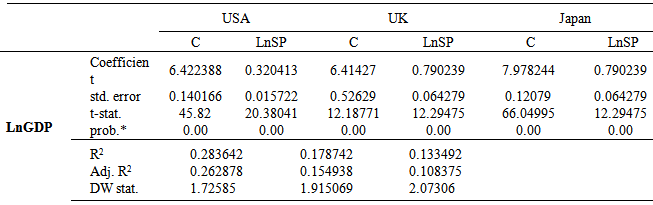
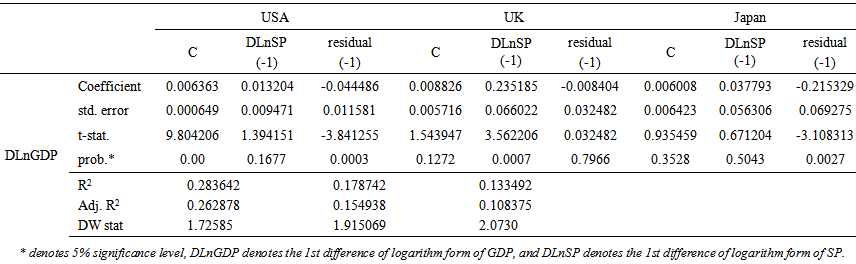
- 1st-stage regression The 1st-stage regression was run by using the traditional ordinary least squares (OLS) method. The coefficients of determination (Table 2) i.e. R2 suggests that the variation of the response variable (GDP) can be explained by the variation of the predictor variable (SP) of the USA, the UK and Japan no less than by 85.22%, 67.64% and 13.49%, respectively. However, whenever the degree of freedom is adjusted the overall model becomes the tiniest weak (denoted by adj.R2) indicates that at least 85.02%, 67.29% and 12.29% of variation in GDP of the sampled countries can be explained by the variation of SP, respectively. Table 2 also shows that the Durbin-Watson (D-W) statistics of the USA and the UK are less than 1 denotes high consequential positive autocorrelation, i.e. successive error terms are, on average, close in value to one another, and while, in the case of Japan, the statistic is significantly less than 2 indicate evidence of strong positive serial correlation.
|
|
 | Table 4. 2nd stage regression test results |
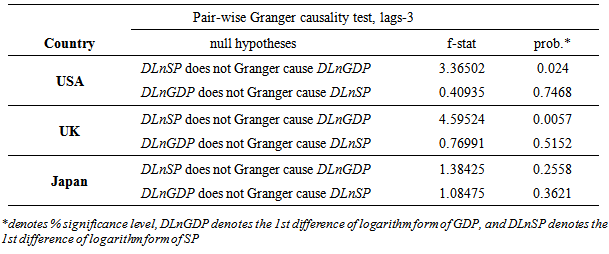
4.3. Granger Causality Test Results
- Table 5 presents the Granger causality test results of variables of all sampled countries. The test is performed by using the 1st difference in order to ascertain the causality relationship between share price and economic growth of sampled countries. The study used three lags (lag 3) as the extant literatures provide documents that the Granger causality test results are sensitive to the choice of lag length.
|
5. Discussions and Conclusions
- The paper attempts to examine the long-run and short-run relationship and also the existence of causality relationship between share price (SP) and GDP (proxy of economic growth) in selected industrialized countries, namely, the USA, the UK and Japan. The study used quarterly data for the time period of 22 years, ranging from 1991 (first quarter) to 2012 (last quarter). The co-integration test is performed to observe the equilibrium relationship followed by the Granger causality test to discover the nature of causality between SP and GDP. Before running regressions, a+ unit root test is carried out by applying the Augmented Dickey-Fuller (ADF) approach in order to confirm that all variables are stationary so as to avoid spurious correlation problems.The empirical evidence obtained in the study suggests that there is no evidence of a long-run equilibrium relationship between share price movements and economic growth in all sampled countries. Similarly, the study finds no short-run relationship between the variables in the USA and Japan; the result, however, in the case of the UK, confirms something contrary to the other sampled countries i.e. there is a short-run relationship between share price and economic growth. These empirical results are contrary to theories (Tobin, 1969 [7]; Modigliani, 1971 [8]) of movement (increase or decrease) that share prices increase or decrease domestic wealth by affecting the demand of domestic money, foreign investment, rates of interest and inflation, which ultimately shake economic growth. These results also do not confirm findings of a number of prior studies (e.g. Campbell, 1998 [13]; Share and Watson, 2001 [14]) suggested a statistically insignificant relationship while others (e.g. Hassapis and Kalyvitis, 2001 [15] and Bingswanger, 2004 [16]) confirmed a significant relationship between share price and output.On the other hand, the Granger causality runs from share price to GDP implying that share market behavior affects economic growth in the USA and UK, but not the other way round. That is, there is no evidence of causality running from economic growth (GDP) to share price index, which implies a unidirectional relationship between share price and economic growth. In other words, movements of share prices could be taken to be a foremost painter of the economic growth in the USA and the UK, but economic growth could not be considered as a predictor of the share price index. The result, by contrast, in the case of Japan, suggests that there is no causality relationship either ways. That is, the share price index cannot be considered as a barometer of economic growth, and economic growth also cannot be considered as a predictor of the share price index. One notable issue in the study is that, as regards the USA and the UK, there is a conflict in results of co-integration tests with Granger causality tests. The result obtained in this study, as regards the USA and the UK, is consistent with Choi et al. (1999) [34]. However, it is the contrary in the case of Japan. Choi et al. (1999) [34] provides evidence that the result of out-of-sample tests in several sub-periods the USA, the UK and Japanese share markets enhance predictions of future industrial production (IP).There might have many possible reasons to explain the seeming inconsistency of the study results with prior studies; the time frame undertaken for the study and the contemporary economic environment are worth mentioning. As has been mentioned earlier most of the prior studies were conducted before the financial tsunami of 2008-10 when the world’s economic environment was thriving and steady, while this study was done following the recent tsunami and therefore this might have an impact on results. The other stimulating issue is that results as regards the USA and the UK are the same, albeit different features of share markets. The USA share market is dominated by the number of households’ shares resultant in their spending behavior explains rapid share price volatility, while the UK share market is dominated by institutional investors whose behavior does not respond to share price volatility as quickly as that in the USA. On the other hand, even if the Japanese financial system is different from the USA and the UK, the co-integration results are same as the others; however the result as regards the causality relation is contradictory to the others.Therefore, policy makers of the sampled countries need to realize the relationship between these two variables in order to develop appropriate share market policy, and domestic and foreign potential investors are required to realize the relationship as well in order to make farsighted investment decisions to gain steady returns. The study has several methodological limitations, and results may not be statistically robust. For example, the R2and adjusted R2 in the 2nd-stage regression results of all sampled countries is significantly lower, inferring results from the equation (4) are not completely reliable; however, equation (2) provides a notably high coefficient of determination implying a greater reliability of results. The constant terms (which can be taken to mean as capturing the causal trend) appear to be a weak factor in the 2nd-stage regression for GDP growth; however they are significant in the 1st-stage regression. Using the Durbin-Watson statistic tests, some issues of serial correlation are found in all regressions which further underpins the dearth of reliability of results. Hence, the equilibrium short and long-run and causality relationship between share price and economic growth may suggest new conclusions in future research by minimizing or removing these limitations.