Olatomide Waheed Olowa, Omowumi Ayodele Olowa
Department of Agricultural Education, Federal College of Education (Technical), Akoka, Lagos
Correspondence to: Olatomide Waheed Olowa, Department of Agricultural Education, Federal College of Education (Technical), Akoka, Lagos.
| Email: |  |
Copyright © 2015 Scientific & Academic Publishing. All Rights Reserved.
Abstract
Bank of Agriculture (BOA) is the epicenter of agricultural development via its rural credit services. The agricultural sector in Nigeria is undergoing transformation and transformation can only be successful and sustainable when it is supported by good credit progrramme and institution which makes BOA to be germane to agricultural development in Nigeria today. Should BOA failed through poor service quality to farmers, then the transformation programme is doomed. Thus, the paper analyses the service quality of BOA by using the already known model for service quality assessment- SERVIQUAL. The study concludes that farmers were relatively more dissatisfied with the service quality dimension ‘assurance’. In other words, assurance is the weakest area of BOA’s services with a highest weighted gap score of 0.21, followed by reliability, responsiveness, empathy and tangibles with weighted gap scores of 0.20, 0.12, 0.08, and 0.05 respectively.
Keywords:
Quality Gap, Bank of Agriculture, Farmers, Credit
Cite this paper: Olatomide Waheed Olowa, Omowumi Ayodele Olowa, Service Quality Gaps and Bank of Agriculture: Farmers’ Perceived Value Analysis, American Journal of Economics, Vol. 5 No. 1, 2015, pp. 29-36. doi: 10.5923/j.economics.20150501.04.
1. Introduction
BOA is Nigeria’s premier agricultural and rural development finance institution, 100% wholly owned by the federal government of Nigeria. The ownership structure is – Central Bank of Nigeria (CBN) 40% and Federal Ministry of Finance Incorporated 60%. Bank of Agriculture Limited is supervised by Federal Ministry of Agriculture.The Bank was incorporated as Nigerian Agricultural Bank (NAB) in 1973 and in 1978, was renamed Nigerian Agricultural and Cooperative Bank (NACB). Subsequently in 2000, it was merged with the People’s Bank of Nigeria (PBN) and took over the risk assets of Family Economic Advancement Programme (FEAP) to become Nigerian Agricultural Cooperative and Rural Development Bank Limited (NACRDB), a name that has always be considered too long and unwieldy. A plan to reposition the Bank into an effective and sustainable national agricultural and rural development finance institution in 2010 led to a further name change to Bank of Agriculture Limited (BOA). Among other functions, It Provides affordable credit facilities to segments of the Nigerian society who have little access to the services of conventional banks, accepts savings deposit from customers and encourage banking habits at the grass-roots.As the nation’s apex agricultural and rural development finance institution with well over two hundred (200) branches located around the country, The Bank of Agriculture has disbursed ₦41 billion to over 600 enterprises across Nigeria in the last 10 years, ₦3 billion on-lending facilities to about 12 states of the federation and ₦4 billion to about 30,000 beneficiaries sourced from collaboration with 30 institutions and 1.8 million account holders.The Millennium Development Goals (MDG) of halving poverty and increasing food availability, accessibility and affordability by 2015 has made various National governments initiate policies and strategies at meeting these goals. In Nigeria, the transformation agenda of the Federal Government in agricultural sector has led to various credit liberalization policies (Nigeria Incentive-based Risk Sharing Agricultural Lending- NIRSAL, a product of the synergy between the Federal Ministry of Agriculture and the Central Bank of Nigeria happens to be a good example) which have made lending to farmers by commercial banks easier, cheaper and attractive than it used to be. Thus, competitive lending environment for agricultural credit is created as farmers now have enabling environment to make choices between specialised Bank like BOA and commercial banks sources. But, Commercial bank credit, because of the business-like manner it is transacted and sometimes unaffordable loan collaterals required, favours big-sized farmers than smallholders. However, this fact does not in any way affect patronages enjoyed by commercial banks as farmers now organize themselves into groups to enable them meet the banks requirements. With the active participation of commercial banks in agricultural credit in Nigeria today and establishment of more commercial banks in the rural areas, BOA faces competition as its main domain is encroached and invaded. To keep the teaming customers who are majorly farmers, commitment and upgrading of the concerned departments in its operation is germane.The BOA is experiencing service gaps with regard to perception and expectation parameters of the farmers. The farmers’ expectations are standards or reference points that the farmer brings into the service experience, while farmers’ perceptions are subjective assessment of the actual service experience. Farmer expectations often consist of what a farmer believes should or will happen. This gap gives an opportunity for a bank to identify the critical areas of service delivery where it is falling short and improve upon the existing practices and create new ways and means of satisfying customers. The ever-increasing competitive pressure has led banks to keep an eagle eye on the quality of the services delivered. The point to make is that service quality generated is largely attributable to the vibrancy brought in by post-liberalisation setup. The intense competition has forced players to focus on quality. Service quality is the degree of excellence which is dependent on a number of crucial parameters. A customer attaches different values to different parameters depending on his/her needs. This valuation of a bank’s product by the customer has potential to influence the decision making of any banking organization including government-owned like BOA. The key to zenith in any service business is the rendering of quality services to customers. The reason behind quality is to satisfy the customer. Thus, research on measuring same is highly desirable. Hence this paper seeks to identify gaps in service quality of the BOA in order to stimulate the creation of satisfaction points between Nigerian farmers’ expectation and perception within the agricultural credit transaction nexus.
2. Literature Review and Theoretical Framework
The approximate behavior of quality manifested through various permutations and combinations is quite cumbersome to be put down in quantitative terms. In fact, quality lies along a continuum reflecting the relative position between two extremes. Here, it is imperative to define quality first.Quality, according to Japanese production philosophy implies ‘zero defects’ in a firm’s offerings. The concept of quality that started with production has permeated other sectors. Now, quality means twin goals of winning customer satisfaction and improving productivity to reduce the associated costs.David Garving identified five perspectives on a product’s quality: transcendent approach, product-based approach, user-based approach, manufacturing-based approach and value-based approach. These five categories were developed from manufacturing perspective and cannot perfectly suit the services. Researchers argued that services being different from physical goods needed a distinctive approach to define and measure quality. As a result of customer involvement in service production, it may be harder to evaluate the quality of service than that of a physical good. However, the researchers have developed several models, which can be used to measure the service quality. A few among them are Gronroos (1983) model, Oslen (1992) model, a three-component service quality model (Rust and Oliver, 1994), SERVEQUAL model, SERVPFE model, to mention but few.A common point agreed upon by various researchers is that expectations of customers act as the raised bar against which delivered services are compared. However, using expectations as determinants of quality has been a bone of contention among various researchers. Parasuraman, Zeithaml and Berryl (1995, 1998) advocated that customer’s expectations should be used for measuring service quality, while Cronin and Taylor (1992), Teas (1993) and others emphasized inclusion of only performance of services and exclusion of expectations of customers in the measurement of service quality. Consequently, two measuring tools SERVQUAL and SEVPERF have emerged. A common consensus is still absent at large regarding the superiority of these two scales. SERVPERF relies on psychometric analysis, while SERVQUAL is endowed with diagnostic capabilities which a manager can use to spot the points where quality fails/declines, and take subsequent measures to arrest the shortfall. Cronin and Taylor (1992) argued that measuring service quality using SERVQUAL (performance less expectation basis) is inappropriate and suggested that SERVPERF measurement (performance only) is a better method. However, Parasuraman, Zeithaml and Berryl (1994) contended that the SERVQUAL scale using expectation/ performance gaps is a richer approach to measure service quality, supporting their earlier assertion that service quality is a multi-dimensional rather than a one-dimensional construct. Angur, Natarajan and Jahera (1999) found in their study on applicability of alternative service quality measure in India retail banking industry, that SERVQUAL scale provides greater diagnostic information than SERVPERF.Parasuraman, Zeithaml and Berryl (1985) pioneered a study that developed a Gap Model (SERVQUAL). The gap model states that a customer’s satisfaction is directly related to disconfirmation of a customer’s experience (perception) against pre-experience expectations. On a continuum, service quality is viewed as the difference between expectations and perceptions between two extremes of acceptable and unacceptable quality. Parasuraman et al (1988) opined that while a negative discrepancy between perceptions and expectations (a ‘performance gap’ as they call it) causes dissatisfaction/unhappiness, a positive discrepancy leads to consumer delight/happiness. They identified 22 variables each for expectations and perceptions, totaling 44 variables. These variables tagged five dimensions named RATER: Reliability, Assurance, Tangibility, Empathy and Responsiveness. Here, customers’ feedback related to expectations and perceptions are obtained on a 7-points Likert scale and are compared to arrive at GAP (E-P) scores. The higher the difference between E and P, the higher is perceived to be the service quality.In an equation form, service quality can be expressed as:Service Quality =Customer’s Expectations – Customer’s Perception. Thus,Service Quality Gap=1-(Customer’s Expectations – Customer’s Perception), if Customer’s Perception is less than or equal to Customer’s Expectations; And Service Quality=1, if Customer’s Perceptionis greater than Customer’s Expectations. And 1 is the best quality if the index of service quality is within [0, 1].SERVQUAL has been widely used in a variety of studies. For instance, studies on retail banking (Hussey, 1999; Engelland, Workman and Singh, 2000; Dutta and Dutta, 2009; Mishra, Kumar and Singh, 2013), financial services sector (Newman, 2011) and most of these studies measured service quality either by replicating (Dutta and Dutta, 2009; Nair, Ranjith and Shri, 2010) or by adopting (Johnston, 1997; Lloyd-Walker and Cheung, 1998; Aldlaigan and Buttel, 2002) Multidimensional service model of Parasuraman et al (1988).While the SERVQUAL has been widely used and acknowledged as the best instrument for measuring service quality, to our knowledge, Multidimensional service model has not been applied to specialized Bank like the BOA which forms the focus of this study.
3. Objectives
The main objectives of this study are:1. Understand the demographic profile of farmers transacting/holding account with BOA2. Find out the expectations and perceptions of these farmers regarding various dimensions of service quality.3. Identify the gap between the farmers’ expectations and perceptions.
4. Methodology
4.1. Data
Bank of Agriculture has eight branches in strategic location within Lagos state namely Ikeja, Shomolu, Agege, Ajegunle, Epe, Lagos island, Badagry and Ikorodu. A sample of 15 farmers each was randomly selected from each of the branches, totaling 120 farmers together. Data were collected from these farmers using a pre-test SERVQUAL questionnaire. The questionnaire elicited information regarding various dimensions of service quality and demographic profile of farmers. Information on service quality were elicited under five categories (also called dimensions) namely Tangibles (physical facilities), Reliability, Responsiveness, Assurance and Empathy. Each of the dimensions has between four to five questions. The same version of questions were repeated under expectations and perceptions but the expected responses in the two cases were tempered by the introductory aspect which request farmers to show their expectation concerning an item and the extent to which it has been seen or experienced in the services of BOA. The questions revolves around the 22 service quality attributes in the SERVQUAL from which expectations and perceptions are obtained on 7-point Likert scale and are compared (E-P) to arrive at Gap scores.
4.2. Analytical Technique
Simple descriptive statistics like percentage, mean, weighted mean, standard deviation, and paired sample t-test were used. Z-test is used to test the significant difference between expectations and perceptions. In SPSS, t-value option is used even for large samples (>30). But the procedure and formula for calculating the t-value for a large sample is the same as the calculation of Z-value in statistical analysis. Since we have used SPSS for the analysis of collected data, we also use the term t-value instead of Z-value. The reliability of the collected data was tested using Cronbach’s α.t-value = (Mean Expectation – Mean Perception) / ((Standard Error) / the square root of n) (n is the number of samples) The formula that determines the reliability of data through Cronbach’s α method is fairly simple and makes use of the numbers of items in the scale (k) and the average correlation between the pairs of items (r). The coefficient α varies from 0 to 1 and a value of 0.6 or less generally indicates unsatisfactory internal consistency reliabilty (George and Mallery, 2009). It is thus represented as:Cronbach’s α = (k x r) ÷ {1 +(k – 1)r}
5. Results and Discussion
5.1. Demographic Profile of Farmers
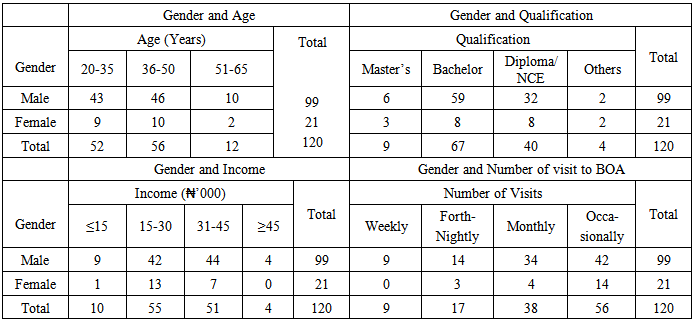
A detailed demography of the sampled farmers is cross-tabulated according to gender and age, gender and qualification, gender and income and number of visits. From the sample, 99 of the 120 farmers were male and 21 were female. Majority of the farmers were between 20 and 50 years, an indication that they within their productive age. In educational attainment, majority of the farmers had bachelor’s degree, followed by diploma/ Nigerian Certificate in Education (NCE), The educational attainment of these farmers is not surprising considering that Lagos is a metropolitan cities where graduate job-seekers flocks. Likely, Most of these farmers were graduate seeking credit to either start or expand their agricultural SME. However, the average monthly income of the farmers shows majority are already in business and are only transacting with BOA to keep their enterprise status or expand it as majority of them fell within the income bracket of between ₦15,000 and ₦45,000 monthly income. Their visit is mostly monthly or occasionally perhaps, for business advice from expert credit officers.
5.2. Data Reliability Test
A reliability test is done using Cronbach’sα to ascertain internal consistency of the data due to the nature of the study. The overall value of reliability coefficient, Cronbach’s α = 09383. It indicates internal reliability of the data. The Cronbach’s α for the five dimension of service quality is presented in Table 2.Table 1. Cross-Tabulation of the Demographic Profile
 |
| |
|
Table 2. Reliability Analysis
 |
| |
|
5.3. Analyses of Farmer’s Expectations and Perceptions
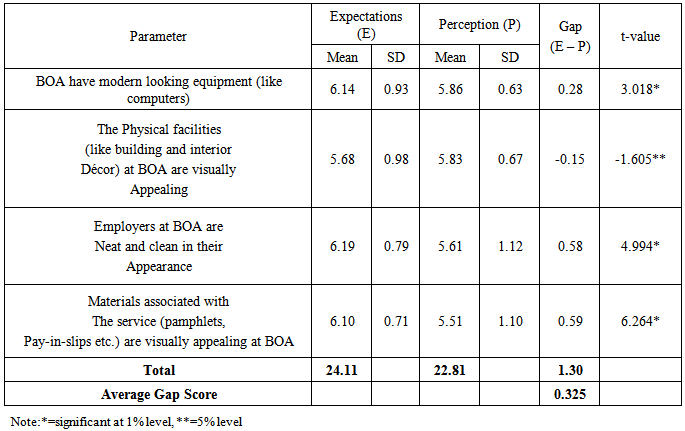
Tables 3-7 indicate the mean score and standard deviation of farmers’ expectations and perceptions for each of the 22 service quality attributes and the average gap score. A positive gap indicates that the farmers’ expectation of service attribute is more than their perception, while a negative gap indicates that the farmers’ perception exceeds their expectation. Furthermore, the last column of these tables Also shows the results of paired t-test through which judgments can be made on the significance of the mean difference (i.e. gap) between the farmers’ expectations and perceptions of service quality.The highest gap between the expectations and perceptions exists at materials associated with the service (0.59), that is, materials associated with the service could be matter of concern at service quality dimension ‘tangibles’. The lowest gap is -0.15 which exists between expectations and perceptions about physical facilities (Tables 3). With this analysis, prima facie it seems that the farmers are satisfied with the physical facilities of service quality dimension ‘tangibles’ because the perception of the farmers exceeds their expectation. But further analysis with t-test indicates that the difference between the expectation and perception is only significant at 5% level (table 3).Table 3. Average Gap Score for Service Quality Dimension: Tangibles
 |
| |
|
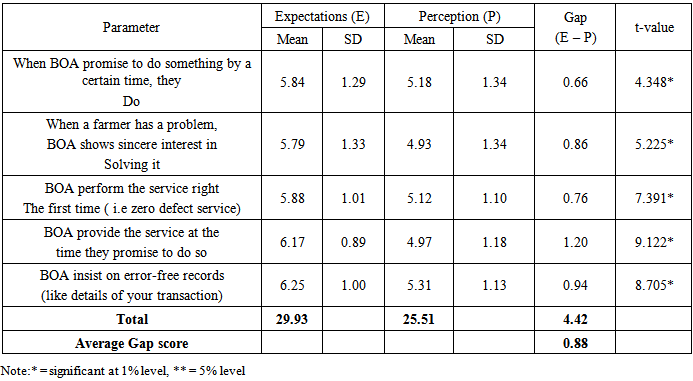
While analyzing the gap score for service quality dimension ‘reliability’, it is found that the most critical area is punctuality (providing the service at the promised time) of service delivery. It has the highest gap score of 1.2. That is, the gap between the expectation of the farmers and their perception is high for punctuality. The t-value indicates that all the differences between expectation and perception are significant at 1% level (table 4).Table 4. Average Gap Score for Service Quality Dimension: Reliability
 |
| |
|
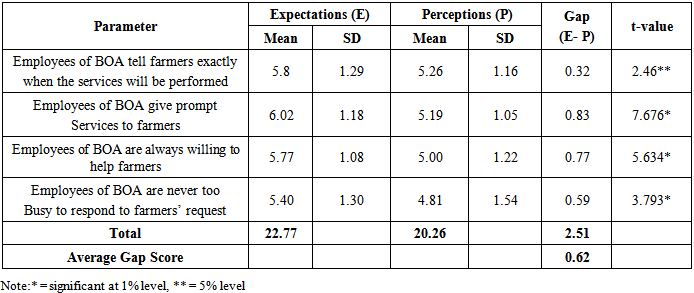
The gap score of service quality dimension ‘responsiveness’ (Table 5) indicates that prompt delivery of service could be the biggest cause of dissatisfaction for average farmer because it has the highest gap score of 0.83. Communicating exactly when the service will be performed to the farmers received the lowest gap score of 0.32. But on the application of t-test on all the service quality attributes, the difference (0.32) is not significant while other differences are significant.Table 5. Average Gap Score for Service Quality Dimension: Responsiveness
 |
| |
|
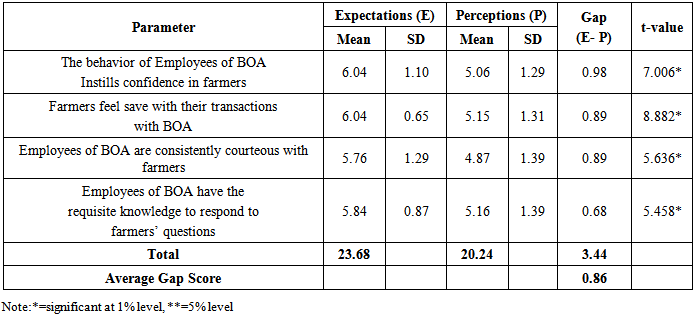
While assessing service quality dimension ‘Assurance’ (Table 6), it was found that the highest gap score between expectation and perception of the farmers was 0.98 for the service quality attribute instilling confidence in customers. The t-test indicates that all the gaps are significant.Table 6. Average Gap Score for Service Quality Dimension: Assurance
 |
| |
|
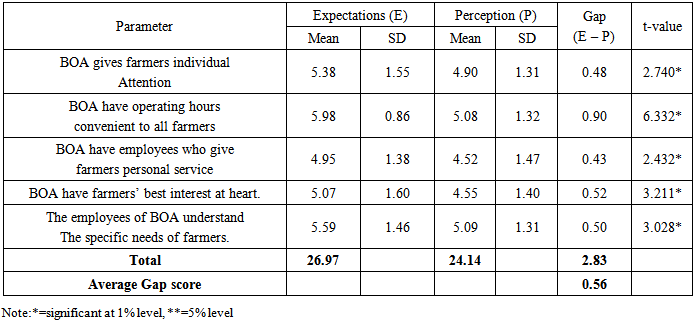
The highest gap scores of 0.90 exists for the service quality attribute banks BOA have operating hours convenient to all farmers, and the t-value indicates that all gaps between expectation and perception of farmers are significant except one (Table 7).Table 7. Average Gap Score for Service Quality Dimension: Empathy
 |
| |
|
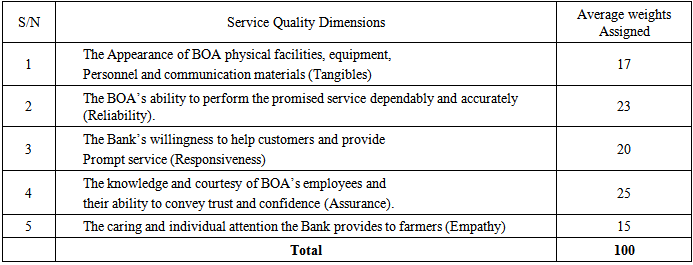
5.4. Average Weights Assigned to Different Service Quality Dimensions
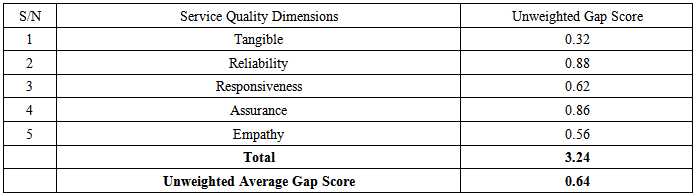
One of the limitations of unweighted average gap score (presented in table 8) is that it gives equal importance to all the service quality dimensions. But in real life, it is observed that people do not give equal importance to all the service quality dimensions. Hence, unweighted gap scores presented in table 8 do not provide full information about the farmers’ satisfaction or dissatisfaction. Because, many a time farmers do not give much importance to the factor which might be highly dissatisfying or satisfying. Hence, the calculation and adjustment of relative importance/weights attached to each service quality dimension becomes important. And, without it, our calculations do not provide full insight into the situation. Table 9 presents average weights assigned by the farmers to different service quality dimensions.Table 8. Unweighted Average Gap Score for Service Quality Dimensions
 |
| |
|
Table 9. Average weights Assigned to Service Quality Dimensions
 |
| |
|
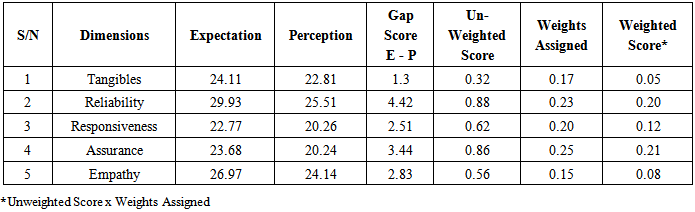
5.5. Composite Analysis
The composite data table (Table 10) provides all the important data in a single table. It makes the comparison and understanding easier to the readers. It is clear from the table that reliability received an average score of 0.88. It is the highest gap score among all the service quality dimensions. Then comes assurance, responsiveness, empathy and tangibles with gap scores of 0.86, 0.62, 0.56 and 0.32, respectively. But, when the farmers were asked to assign how much importance / weight they attach to each service quality dimension, assurance (0.25) was found to be the most important service quality dimension for them (not reliability). After assurance, reliability, responsiveness, tangibles and empathy were important in a series with importance score of 0.23, 0.20, 0.17 and 0.15, respectively (tables 9).Table 10. Composite Data Table
 |
| |
|
After adjustment of unweighted average gap score with relative importance or weights attached to service quality dimensions, the final conclusion can be drawn. Assurance received highest weighted gap score of 0.21. Reliability, responsiveness, empathy and tangibles were critical with weighted gap scores of 0.20, 0.12, 0.08, and 0.05 respectively.
6. Conclusions
The findings of the study reveal the strong and weak areas in BOA services. Focusing on such areas would result in increased satisfaction and loyalty among farmers. The study concludes that farmers were relatively more dissatisfied with the service quality dimension ‘assurance’. In other words, assurance is the weakest area of BOA’s services with a highest weighted gap score of 0.21, followed by reliability, responsiveness, empathy and tangibles with weighted gap scores of 0.20, 0.12, 0.08, and 0.05 respectively. This study is useful in determining the weak point of such an important bank- BOA’s services where immediate steps are necessary. If such deficiencies are ignored, it leads to loss of reputation and credibility and ultimate frustration of government transformation agenda in agricultural sector.
References
| [1] | Aldlaigan AH and Buttel FA (2002), “SYSTRA-SQ: A new Measure of Service Quality”. International Journal of Service Industry Mangement, Vol 13. No.4, pp362-381. |
| [2] | Angur MG, Natarajan R and Jahera JS (1999), “Service Quality in Banking Industry: An Assessment in a Developing Country”. International Journal of Bank Management Vol. 17, No. 3, pp116-123. |
| [3] | Cronin JJ and Taylor SA (1992), Measuring Service Quality”: A Re-examination and Extension” Journal of Marketing, Vol. 56, pp. 55-68. |
| [4] | Dutta K and Dutta A (2009), Customer’s Expectations and Perceptions Across the Indian Banking Industry and the Resultant Financial Implications”. Journal of Services Research, Vol. 9, No. 1, pp.31-43. |
| [5] | Engelland BT, Workman L and Singh M (2000) “Ensuring Service Quality for Campus Career Service Centres: A Modified SERVIQUAL Scale. Journal of Marketing Education, Vol.22, No. 12, pp.236-245. |
| [6] | George D and Mallery P (2009), SPSS for Windows Step by Step, 8th Edition, p.223.New Delhi; Pearson Education. |
| [7] | Gronroos C (1983), “Strategic Management and Marketing in Service Sector”. Report, pp. 83-104, Marketing Science Institute, MA Cambridge. |
| [8] | Hussey MK (1999), Using the Concept of Loss: An Alternative SERVIQUAL Measure”. The service Industries Journal, Vol. 19. No. 4, pp. 89-101. |
| [9] | Johnston R (1997), “Identifying the Critical Determinants in Service Quality in Retail Banking: Importance and Effect”. International Journal of Bank Marketing, Vol. 15, No. 4, pp. 11-116. |
| [10] | Lloyd-Walker B and Cheung YP (1998), “IT to support Service Quality Excellence in the Australia Banking Industry”. Managing Service Quality, Vol. 8, No. 5, pp.350-358. |
| [11] | Mishra A, Kumar BR and Singh DB (2013) A study of Gaps in Service Quality at a Leading Private Sector Commercial Bank in Greater Noida. The IUP Journal of Bank Management, Vol. XII, No. 1. |
| [12] | Nair R, Ranjith PV, Bose S and Shri C (2010), “A study of Service Quality on Banks with SERVQUAL Model”. SIES Journal of Mangement, Vol. 7, No. 1, pp.35-45. |
| [13] | Newman Karin (2011), ‘Interrogating SERVQUAL: A Critical Assessment of Service Quality Measurement in a High Street Retail Bank”. The International Journal of Bank Marketing. Vol. 19, No. 3, pp. 126-139. |
| [14] | Oslen M (1992) “Quality in Banking Services: A Working Paper 11A”, Department of Business Studies, Stockholm University. |
| [15] | Parasuraman A, Zeithaml VA and Berryl LL (1985), “A Conceptual Model of Service Quality and its Implications for Future Research” Journal of Marketing, Vol. 49, No.4, Pp. 41-50. |
| [16] | Parasuraman A, Zeithaml VA and Berryl LL (1988) “SERVQUAL: A Multiple Item Scale for Measuring Customer Customer Perception of Service Quality”. Journal of Retailing, Vol. 62, No. 1, pp. 12-40. |
| [17] | Parasuraman A, Zeithaml VA and Berryl LL (1990), “Delivering Quality Service, Balancing Customer Perceptions and Expectations, The Free Press, New York. |
| [18] | Parasuraman A, Zeithaml VA and Berryl LL (1994), “Re-assessment of Expectations as a Comparison Standard in Measuring Service Quality: Implications for Further Research”. Journal of Marketing, Vol. 58, No.2, pp. 111-124. |
| [19] | Rust RT and Oliver RL (1994), Service Quality: New Directions in Theory and Practice pp. 1-9, Sage Publications. |
| [20] | Teas R (1993), Expectations, Performance Evaluation and Consumers’ Perceptions of Quality” Journal of Marketing, Vol. 57, No. 4, pp. 18-34. |
 Abstract
 Reference
 Full-Text PDF
 Full-text HTML