Bui Trinh 1, Pham Le Hoa 2
1Vietnam National Account Department, 6b Hoang Dieu-Badinh-Hanoi
2Head of R & D Department of Haidang Tourist Joint Stock Company, 19-Tran Khanh Du-Haiphong Cty
Correspondence to: Bui Trinh , Vietnam National Account Department, 6b Hoang Dieu-Badinh-Hanoi.
| Email: |  |
Copyright © 2014 Scientific & Academic Publishing. All Rights Reserved.
Abstract
Based on the structure of the Input-Output table is always one of the optimal ways to analyze and evaluate the economic relationship between one country with the others, especially in case of economic relationship between Vietnam and China. In this paper, the author especially tried an attempt in order to find some problem on Vietnam economic structure in trade relationship with China and other countries.
Keywords:
Induced effect of import to income and production in case of Vietnam and China
Cite this paper: Bui Trinh , Pham Le Hoa , Some Findings of Vietnam’s Economic Situation in the Relationship with China, American Journal of Economics, Vol. 4 No. 5, 2014, pp. 213-217. doi: 10.5923/j.economics.20140405.03.
1. Introduction
Vietnam’s Import statistics shows that for many years, 60% of import was for production, 30% for savings and only 10% for final household consumption approximately. Therefore, in order to study the actual structure of the induced impacts from the final demand to value adedd and import, we need to consider the domestic final demand [1].The suggestion by OECD regarding this issue provided a quantitative method of value added by exports (Trade in value added: Concepts, methodologies and challenges, 2012) [2]. Robert Kopman et al (2008) studied China in a working paper “How much of Chinese export is really made in China? Assessing Domestic value added when processing trade is pervasive”. They analyze this case by quantifying the value added of crudely exported products and processed exported products [3].This study was based on the input-output tables of ASEAN countries and China [4] was estimated by the supply and use tables of these countries that published by ADB [5] December, 2012. The years of these tables were 2005 and 2007 for Vietnam.However, in 2013 Vietnam compiled the input-output tables for 2012 from sample survey sponsored by Vietnam Government. This table give us new economic structure and then we can shown the economic structure change of Vietnam economy in the comparing with other countries.
2. Methodology
This paper used the expansion intra-national input – output table with non-competitive type of Vietnam, which separated the import from China and rest of the world (ROW) and the supply and use table of China (2005). Based on this model and these tables, it can be estimated backward linkages, forward linkages, spreading to China and spreading to rest of the world. Finally, it can indicate that which sectors should be prioritized for development for domestic economy (Vietnam). Further, it can estimate the domestic final demand of Vietnam induced to output and production income of China. Besides, Leontief was quantified Keynes's idea in the relationship between supply and demand sides [6]. This means the relationship between elements of final demand and supply side is quantified, and this is a “cause and effect” relationship between demand side and supply side. Thereby, leading to the change in income and backward influence the behavior of demand. From the expansion intra-National I-O table with non-competitive type, it can also calculate the spreading of final aggregate demand factors to production and income in the domestic economic, which can make some judgments about the macroeconomics. This model goes further than basic I-O models. In the basic I-O models, assumption is that only the final demand factors (consumption, investment and export) influence of the production. In expanded non-competitive I-O model, the production depends not only on the final demand factors of the domestic economic, but also depends on the final demand factors of other countries. This could be understandable by the economic theory: any changes in the final demand factors of a specific region will lead to the changes of production value of that region. These changes are followed by changes in other regions, because the production of one region uses the products of the others as the input costs. These impacts are shown by input-output multipliers. These ideas seem to be like “The Law of Cause and Effect” in the Buddha theory and it is shown as the figure below. | Figure 1. The induced impact and inter-country feedback effects |
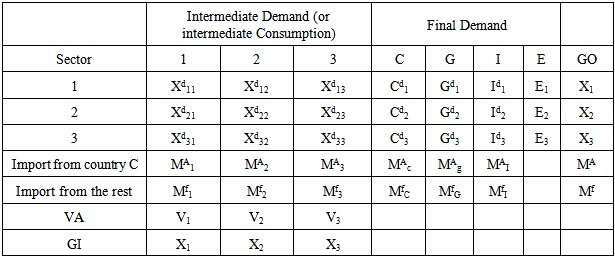
The national input-output table with non – competitive type) shown at Table 1.Table 1. National input-output table – non-competitive and extended type is in form
 |
| |
|
Relationships in the National input-output table with extended non-competitive type is shown as below:In the National I-O table with non-competitive type, every factors of intermediate demand and final demand is splitted into demand of domestic product; negative column about “Import from country A” and “Import from the rest” are not exist if splitting import stream of country A and the rest. In which:Xdij present element of domestic intermediate input matrixCdi: final consumption of household for domestic product “i”Gdi: final consumption of government for domestic product “i”Idi: Domestic gross capital formation of “i”Ei: Export of product “i”MAj: Import by sector from country A for intermediate consumptionMfj: Import by sector from rest of the world for intermediate consumption MAc and Mfc: Total import from country “A” and rest of the world for household consumption expenditure.MAg and Mfg: Total import from “A” and rest of the world for final consumption of governmentMAI and MfI: Gross capital formation was imported from country A and rest of the world;Basic relationsIn non-competitive I-O table, relations are shown as below: | (1) |
 | (2) |
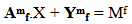
In which:Ad is the matrix of coefficient intermediate cost of domestic product;AmA is the matrix of coefficient intermediate cost of imported product from country A;Amf is the matrix of coefficient intermediate cost of other countries:Yd: is the matrix of final demand of domestic product (including export)YmA and Ymf are the vectors of final demand of imported product from country “A” and rest of the world. It includes household’s consumption, final government’s consumption, gross capital formation and export.Easily we can see: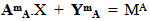 | (3) |
 | (4) |
MA and Mf are also export of country A and rest of the world.On the other hand, relation (2) is re-written as: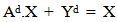 | (5) |
Or:  | (6) |
Thus, relation (6) became standard relation of Leontief’s domestic and non-competitive relation. Reversing domestic Leontief’s matrix (I-Ad)-1 reflects the sensitiveness and dispersion of sectors in the national economic. From relation (6), factor of income is defined as: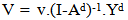 | (7) |
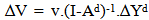 | (8) |
In which: V is gross value added, v is the coefficient matrix of value added and output factor. The equation (7) and (8) shown value added of Vietnam induced impact by factor of final demand. Other way, relation (2) could also be written:  | (9) |
Or: | (10) |
Matrix (I- Amd)-1 is called multiplier matrix of import from country A. In equation (9) and (10), demand of import from country A is spread by the domestic demand. Similar, relation (2) could also be written: | (11) |
Or: | (12) |
Matrix (I - Amf)-1 is called as multiplier matrix of import from the rest of the world. In equation (11) and (12), import demand from the rest of the world spread by the regional demand. Coefficient of import from other countries is defined:Thus, the National Input-Output table with extended non-competitive type would help us to know, how much the output, income and import was induced impact by final demand, So, from the input – output tables of Vietnam and China we can estimate import from China to Vietnam induced impact to output and income of China.
3. Realistic Research
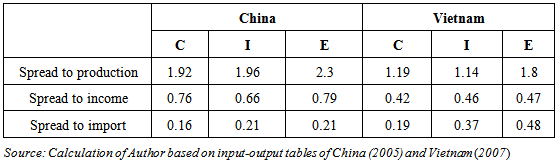
The calculation of competition affect of 2 economies had shown the dispersion affect from demand to production and income of China and Vietnam. Because of strong supply, if we interfere final demand, gross value added will grow strongly, it’s the opposite of us. With China, domestic consumption spread to income equal to export (1 added unit of consumption spread to import 0.76 and export 0.79). When in Vietnam, spreading from domestic consumption and export are both lower, approximately 0.42 and 0.47. The situation is the same in investment, they (China) increases 1 unit of investment will spread to income 0.66, greater than us (Vietnam) 20 percent point. We could see that China is really strong in supply side, but not us. Table 2. Competition of the dispersion of final demand to production and income of China and Vietnam
 |
| |
|
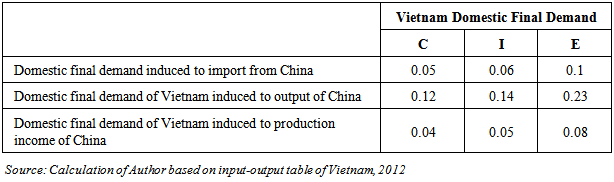
Therefore, we should focus on supply side for a long-term. From that, coming up with ideas to reconstruct the economy, but in fact, we have a passion for controlling final demand. Besides that, corruption is also a reason for this. If comparing the dispersion of investment to production of 2 periods, we could see that investment value that could not come to production is 17%. By the way, all-sided foreign policy is not really accurate, foreign priority is not only at the FDI but also not right with final demand (Consumption, saving, and export). Almost every policies are aim to export but totally forget domestic market, while the dispersion of domestic consumption of China to production and income are almost the same.By using National input-output table of 2010, updated for 2012 according to 2010’s price of Vietnam, and dividing export and import into: export to China and to other countries; import from China and to other countries. Then, analyzing the influence level of China to Vietnam.There are the assumptions: Total income gets stuck; Investment from FDI decreases 50%;Export decreases 20%; Import decreases 20%.So, if total income and investment from China decrease, import also decreases 40%.In this circumstance, total influence of GDP decreases about 1.68%. However, if total income could be replace by other country or other domestic partner, and the production is not much relate to import, this influence would be less. Besides that, if exporting 5% to other countries (not China), and the export structure is changed (transfer the export quantity of industry sector to service sector), this influence would increase the GDP about 0.22% - 0.5% approximately. The economic structure that we need is transferring the export quantity of industry sector to service sector. This study dose not only indicate the spread of domestic final demand to output and income of Vietnam, but also show the spread to output and income of China induced impact by Vietnam’s domestic final demand (table 3). For example, in 2012 Vietnam imported 12 billion USD from China, this will induce to income of China about 9 billion USD, in which domestic final demand of Vietnam induced to production income about 2.5 billion USD.Table 3. The spread of domestic final demand to output and income of Vietnam and the spread to output and income of China induced impact by Vietnam domestic final demand
 |
| |
|
In another study of a group of Kyoto University showed the result as: If 20% of export to processing and manufacturing sector is transferred to service sector, the growth would be stable. The dispersion coefficient of service sector will be higher than the average coefficient of the economy, and the contribution of this sector would be approximately 50% to GDP.By using this study in several Asian countries, we could compare several factors of regional economy. The result showed that Vietnam and China are 2 of the most typical countries with a strong processing and manufacturing industry. This result is similar to the one of Mr. Vu Quang Viet, the current manager of National account department (UN). Mr. Viet believes that Chinese economy is a manufacturing economy and Vietnamese economy is also a processing one. The size of Chinese economy is much larger than Vietnamese economy but they are similar in some points. They are vulnerability and low affection. In other side, the dispersion level from final domestic demand to supply side has a clear and big change (increases from 2.59 in 2007 to 3.57 in 2012, but the dispersion to domestic production decreases from 1.77 in 2007 to 1.66 in 2012). Thus, the dispersion to import strongly grows about 1.0 in 2007 to 1.91 in 2012. This means if continuing focus on final demand, it only lead to trade deficit of domestic economic sectors.
4. Conclusions
If Vietnamese economy still has low interest and focus in processing industry, the ratio of intermediate input per output increased by approximately 20 percentage points from 2000 to 2012. Only in the period of 5 years (2007-2012), this ratio grow almost 10 percentage points (see Appendix), dispersion level to value added from final demand are being low (the lowest one among countries in the region). Finally, we could see that even there is no drilling rig of China, Vietnamese economy would be always “sick” and it would not “stand up” in one day.Plus the drilling rig trouble, we have to follow fast and dratted the message of the Prime Minister in early 2014. Also, the economic structure needs to be changed from export in processing industry to export in service.To focus on supply side, it also increases processing of domestic consumption’s products. And finally, we should not only focus on good policy for export, but also focus on processing domestic consumption’s products.The Vietnam’s economy needs a level-playing field between the property sectors (State sector, non-state sector and FDI sector).
Appendix
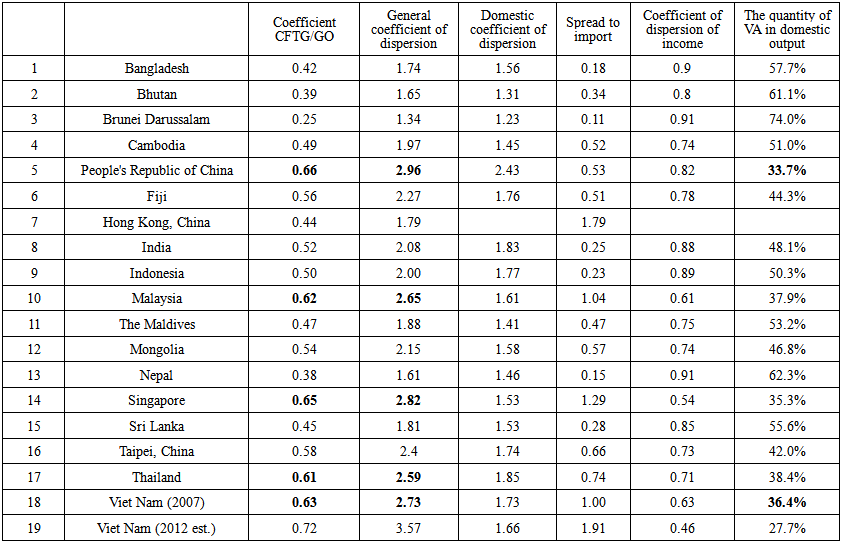 | Appendix 1. Comparison of Several Factors in Several Asian Countries |
References
| [1] | H.W Richardson. Input-Output and Regional Analysis. John Wiley and Sons, New York; 1972. |
| [2] | Bui Trinh, Kiyoshi Kobayashi, Trung-Dien Vu, Pham Le Hoa, Nguyen Viet Phong. New Economic Structure for Vietnam Toward Sustainable Economic Growth in 2020. Global Journal of Human Social Science Sociology Economics & Political Science. 2012;12(10):1.0. |
| [3] | OECD. Trade in value – Added: Concepts, Methodologies and Challenges. OECD – WTO; 2012. Available: htp:/www.oecd.org/sti/nd/49894138.pdf. Economics & Political Science Volume 12 Issue 10 Version 1.0 2012. |
| [4] | Bui Trinh Kiyoshi Kobayashi and Kwang Moon Kim. The Supply and Use tables: The approach for conversion to input-output table; Advances in Management & Applied Economics, vol.2, no.2, 2012, 83-89; International Scientific Press, 2012 |
| [5] | ADB, Supply and Use tables for selected Economies in Asia and the Pacific, December, 2012. |
| [6] | Leontief W, Strout A. Multiregional Input-Output Analysis. In: T. Barna (ed.).Structural Interdependence and Economic Development, New York: St-Martin’s Pres. |
 Abstract
 Reference
 Full-Text PDF
 Full-text HTML