Istis Baroh1, Nuhfil Hanani2, Budi Setiawan2, Djoko Koestiono2
1Department of Socio Economics, Muhammadiyah University, Malang, Indonesia
2Department of Socio Economics, Brawijaya University, Malang, Indonesia
Correspondence to: Istis Baroh, Department of Socio Economics, Muhammadiyah University, Malang, Indonesia.
| Email: |  |
Copyright © 2014 Scientific & Academic Publishing. All Rights Reserved.
Abstract
The purpose of this research is to analyze the competitiveness of Indonesian coffee in the international market by using secondary data years 1990-2011. The analytical tool used is Armington models, which consists of a demand equation, the equation of supply and price equations. Armington model analysis results, review from the demand side are a Brazilian coffee competitors in Japan and Germany, while the Columbian coffee are competitors in Japan and the Netherlands. While the other coffee exporting countries are partners and potential partners. Review from supply side: Indonesian coffee offer in Japan and Australia are affected by supply last year, while in the Netherlands, United States and Germany are influenced by Indonesian coffee prices (producer prices). Review from price side: Consumer prices in the five Indonesian coffee importing countries (Japan, Netherlands, United States of America, Germany and Australia) is influenced by producer prices, the exchange rate against the United States dollar and technology, while consumer prices last year had no significant effect except in the German states.
Keywords:
Competitiveness, Armington models
Cite this paper: Istis Baroh, Nuhfil Hanani, Budi Setiawan, Djoko Koestiono, Indonesian Coffee Competitiveness in the International Market: Armington Model Application, American Journal of Economics, Vol. 4 No. 4, 2014, pp. 184-194. doi: 10.5923/j.economics.20140404.03.
1. Introduction
Coffee is one of Indonesia’s important export commodities. In terms of production, Indonesia ranks third after Brazil and Vietnam. On the other hand, the volume of Indonesia's coffee exports in the world market ranks third, after Brazil and Columbia. In 2000 and 2010, the volume and value of coffee exports increased by 4.7% and 14.7% respectively (Kustiari, 2012). The increase of world coffee production unequal with demand for coffee cause international trade competition is getting tougher. Over-supply problem faced by world coffee market has caused the price of coffee beans in November 2000 in international market slumped. Coffee commodity prices in the national economy has decreased as a consequence of the collapse of world coffee prices due to over-production. The growth rate of Indonesian exported coffee prices fluctuated within 21 years. Coffee prices reached its highest point in 1994 (61.84%) and reached its lowest point in 1996 (-62.22%). Since 1997, the growth rate of coffee price fluctuated but never exceeded its highest point in 1994 (Intan NT, 2012). On the other hand, the volume of exports of Indonesian coffee beans rose quite sharply in 2008, reaching approximately USD 989.41 million, but fell back in 2009 to USD 822.31 million, and decreased again in 2010 to USD 812,53 million. This situation means that the growth of Indonesia exported coffee is declining, but the decline faced by Indonesia is higher than the world. The growth of Indonesian coffee exports are negative, indicating some weaknesses, including the composition of the product, market distribution and competitiveness. Indonesia does not take advantage of the type of processed coffee products whose demand is growing in many countries, in addition to unability to compete with other exporting countries when the price of coffee has decreased. Based on this background, there are two specific issues that will be examined in this study. First, how the competitiveness of Indonesian coffee among other commodities in the domestic market. Second, the competitiveness of Indonesian coffee in the international market among other coffee exporting country. Value of coffee exports decreased from year to year (2008-2010), while the economic value of Indonesian coffee is very high and the coffee plantation area has increased. It was shown by the comparison of the volume and value of coffee exports increased respectively by 4.7% and 14.7% a year during the period 2000-2010. The increase in the value of exports to 3x faster than the increase in export volumes. Price per unit a year Indonesian coffee exports increased by 10.8% a year, while the per unit value of coffee exports in the world market increased by 12.4% (UN, 2011). Fluctuations in the value of exports of coffee and coffee exports among other export commodities in international trade can not be separated from the competitive and comparative advantage are deeply affected. With regard to comparative advantage and competitive advantage, the value of coffee exports decreased while an increase in the price per unit is relatively high is a problem that needs to be studied further. According Istis B et al (2014), Indonesian coffee has a its competitiveness in the domestic market that is in the order of No. 7 among 8 other existing export commodities. The competitiveness of Indonesian coffee than coffee exporting countries other international markets.
2. Literature Review
2.1. The Theory of Export and Import
According to Krugman and Obstfeld (1991), and Nopirin (1997) inter-state trade or international trade arise because of differences in commodity prices between the two countries. The price difference is caused by the difference in the cost of production in the two countries (Nopirin, 1997). When the price of a country is higher than the world price, then the country will make a purchase or import of items needed. Conversely, if the price of goods in one country is lower than the market price, then the country will make a sale to the world market, or export the surplus of production over domestic demand. Graphically mechanism of trade between countries can be shown by Figure 1. 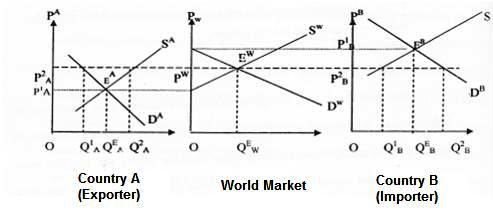 | Figure 1. Mechanism of Coffee Export and Import |
P1A:Domestic coffee price before trade in the exporting countryP2A:Domestic coffee price in the exporting country after free tradePw: World coffee priceP1B:Domestic coffee price in the importing country before the tradeP2B:Domestic coffee price in the importing country after the tradeQEA:The quantity of coffee traded in country A before the trade between countriesQ1A: The quantity of coffee demanded in state A after free tradeQ1AQ2A: Excess supply in the coffee exporting country after free tradeQEB:The quantity of coffee traded in the importing country before the free tradeQ1BQ2B: Excess demand for coffee in the importing country after free tradeIn Figure 1. it appears that in the beginning there is a difference between the price of coffee in country A and country B, which reach equilibrium of EA and EB for country A and country B respectively. In each equilibrium point, quintity of coffee traded by country A is QEA at the price PEA , while the quantity of coffee traded by country B is QEB at the price PEB. This difference leads to a trade between countries A and B, namely the creation of import demand and export supply in the world market.
2.2. Government Policy on International Trade
One of the government's policies relating to trade and intended to protect producers in exporting countries are export subsidies. Export subsidies are payments from the government on companies that send goods overseas. When the government offers export subsidies, the producers increase exports where the domestic price is higher than the export price. Export subsidies intended to protect producers or exporters. Export subsidies made to improve the competitiveness and keep the price in the domestic market. Export subsidy mechanism is presented in Figure 2. 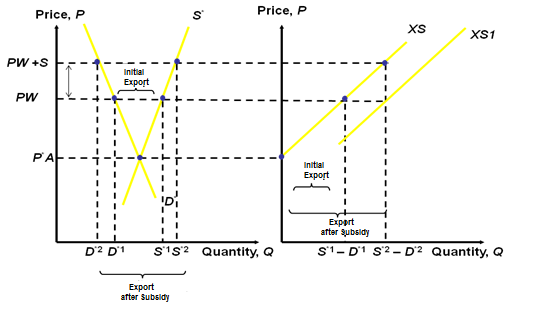 | Figure 2. Export Subsidies in Small Countries |
The impact of export subsidies is to raise the price in the exporting country and lower the price in the importing country. Price in the exporting country rose from PW to PS, but the price in the importing country fell from PW to P'S, the price increase is smaller than the amount of the subsidy. In the exporting country, the consumers suffered loss while the producers gain benefit. On the other hand, the government suffered loss due to the export subsidy given to the exporters.
3. Data and Methods
3.1. Data
This study uses secondary time series data with a period of 21 years, starting from 1990 to 2011. Secondary data are obtained from various government agencies and related institutions, including the Ministry of Agriculture, Ministry of Trade, the Central Statistics Agency (BPS), FAO, ICO and literature studies as well as other information. Term limitation to avoid differences in perception include: 1. Volume is measured in tonnes. This study is attempted only to examine the coffee beans, not including the varieties. 2. Value of exports and imports and the price is expressed in US dollars. 3.The competitiveness of Indonesian coffee in the international market is analyzed from demand side using Armington demand models.
3.2. Methods
Methods are used in this study. Armington models is employed to determine the competitiveness of Indonesian coffee in the international market.Econometric model to formulate the competitiveness of Indonesian coffee in the world market using Armington models consist of three (3) structural equation, namely: demand equation, supply equation, and price equation. The model can be described in the following equations: a. Demand Equation Importing CountriesParameters which describe the elasticity of demand for state-i toward coffee produced by state-j (nijj) and the elasticity of demand for state-i toward coffee produced by state-h (nijh) are estimated using Armington Demand System.Coffee import demand equation models generated by each importing country can be formulated as follows:  | (1) |
Where: i = 1, 2, 3, 4, 5, 6 for coffee importing countries, namely Japan, the Netherlands, USA, Germany, Australia and ROW (Rest of the World) Importj = Indonesian coffee exportersb. Supply EquationCoffee production of a country depends on the producer price, land area, technology, the input price and others. The percentage of the change in production, in the supply equation can be formulated as price dependent form below: | (2) |
Dimana: Pj = the percentage of the change in the price of coffee in the country-j Sj =the percentage of the change in supply of coffee from country-jsj =price elasticity of supply of coffee from country-jZj =determinant of exogenus, which is determined by changes in precipitation, new planting, production costs, technology and government policies such as taxes, or tariffs .c. Price EquationThe price equation is the relation in producer (Pj) and consumer price coffee (PIJ). The difference in the two prices as exogenous shifter (TIJ) which is determined by transportation costs, import tariffs, export taxes, exchange rates and other trade policies issued by the importer and exporter countries. The model equations can be formulated as follows: | (3) |
Where: tij = coffee price transmission elasticity from country-j to country- i (the percentage of the change of Pij caused by changes in Pj) Tij =exogenousslider, such as import tariffs, export taxes, exchange rates and other trade policies issued by the importing or exporting countries
4. Results
4.1. Analysis of Results with Demand Equation
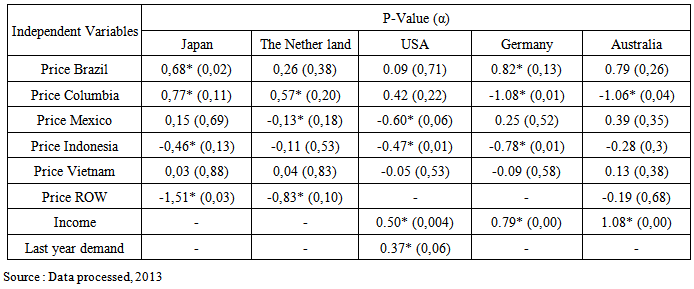
Armington Demand Model is employed to analyze the demand of Indonesian coffee in Japan, the Netherlands, United States, Germany and Australia. Using 8 (eight) independent variables which are Indonesian coffee price, Brazilian coffee prices, Columbian coffee prices, Mexican coffee prices, Vietnamese coffee prices, coffee prices from other countries (ROW), income and demand for Indonesian coffee last year, the detailed results are presented in Table 1. below. Table 1. Demand Analysis Results of Indonesian Coffee in 5 Importing Countries
 |
| |
|
Based on the analysis of Indonesian coffee demand in 5 countries above, it can be concluded that Indonesian coffee face different competitors in each country. Income only affected Indonesian coffee demand in United States, Germany, and Australia. While demand for Indonesian coffee last year only affected demand for Indonesian coffee in United States.
4.2. Analysis of Results with Supply Equation
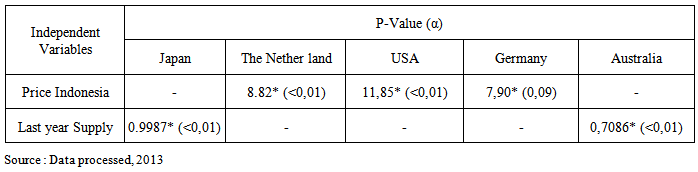
The results to the analysis of aspects supply Armington model in this study is the estimation results in five importing countries. Indonesian coffee supply in the Netherlands, United States and Germany are influenced by producer prices except in Japan and Australia. The detailed results are presented in Table 2. below.Table 2. Supply Analysis of Indonesian Coffee in 5 Importing Countries
 |
| |
|
Indonesian coffee supply in Japan and Australia is not affected by the upward and downward trends of coffee price in Indonesia, but is influenced by the amount of supply in the previous year, shown by the results of the regression analysis which was 0.9987 with α <0.0001 (in Japan) which means that if last year’s Indonesian coffee supply is increased by 1%, Indonesian coffee supply increases 1% and vice versa, and 0.7086 with α <0.0001 (in Australia) means that if last year’s Indonesian coffee supply is increased by 1%, Indonesian coffee supply increases 0.71% and vice versa, both at the level of trust > 99% Indonesian coffee supply in the Netherlands, United States and Germany is heavily influenced by the price of Indonesian coffee. The influence is 8.82 (Netherlands) and 11.85 (United States) with α <0.01 and 7.9 with α = 0.09 (Germany) successively, meaning if Indonesian coffee price increases or decreases by 1%, then the supply will go up or down by 8.82% (Netherlands) and 11.85% (USA) with level of trust > 99% and 7.9% (Germany) at level of trust 99%.
4.3. Analysis of Results with Price Equation
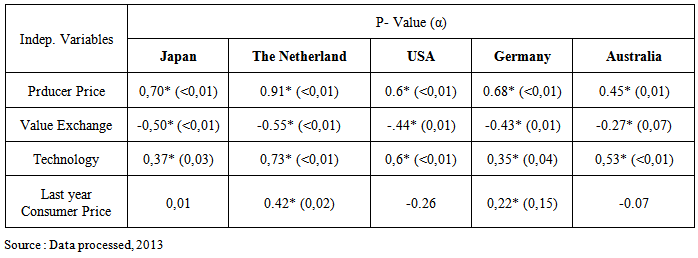
Consumer prices in Japan, the Netherlands, USA, Germany, Australia influenced by producer prices, the exchange rate against the dollar, technology and consumer prices. The detailed results are presented in Table 3. below.Table 3. Price Analysis of Indonesian Coffee in 5 Importing Countries
 |
| |
|
Indonesian coffee consumer price in Japan, Netherlands, USA, Germany and Australia will increase respectively by 0.7%; 0.91%; 0.60%; 0.68% and 0.45% when producer price increases 1% and vice versa on level of trust ≥ 99%; consumer price will increase respectively by 0.5%; 0.55%; 0.44%; 0.43% and 0.27% if the exchange rate of Rupiah to US $ declines by 1% and vice versa at the level of trust ≥ 93%. Consumer price increases respectively by 0.37%; 0.73%; 0.6%; 0.35% and 0.53% if technology change is implemented and vice versa on the level of trust ≥ 93%. Last year’s consumer price increases 1%, and this causes an increase in consumer price by 0.42% (in Netherlands) and vice versa at the level of trust 98% and 0.22% (in Germany) and vice versa at the level of trust 85%. Meanwhile, in Japan, USA and Australia’s last year consumer price does not significantly affect Indonesian coffee consumer price in the current year.
5. Discussion
Armington model analysis in this study is the estimation result of Indonesian coffee importers in five countries (Japan, the Netherlands, United States, Germany and Australia). The results of the analysis in detail are as follows.
5.1. To Analysis with Demand Equation
a. JapanBased on the partial test results, Indonesian coffee demand in Japan affected by the price of Indonesian coffee, Columbia coffee prices, coffee prices of other exporting countries, and demand of Indonesian coffee in Japan last year. While Mexican coffee price and Vietnamese coffee prices had no significant effect (neutral). The influence of Indonesian coffee prices acounted for -0.4581 with alpha 0.1301 meaning that if the price of coffee in Indonesia increased 1%, the demand for Indonesian coffee in Japan decreased 0.46% (inelastic because <1) at 87% confidence level. It was reasonable, in accordance with the law of demand, increase in the price of an item will cause a decline in demand for the respective goods. With the rising price of Indonesian coffee, coffee consumers in Japan will switch to coffee from other countries that are relatively less expensive. The effect of Columbian coffee price (0.7684) with α=0.1084, meaning that if Columbian coffee price increased by 1%, the demand for Indonesian coffee in Japan rose by 0.77% (inelastic because <1) at 89% confidence level. It was shown that Columbian coffee can replace the function Indonesian coffee in Japan or coffee Columbia is a substitute (competitors) of Indonesian coffee. The effect of the price of coffee from other exporting countries (-1.5118) with α=0.0266, meaning that if the price of coffee from other countries increased by 1%, the demand for Indonesian coffee in Japan fell by 1.51% (elastic because >1) at the level of 97%. It means that the coffee from other countries (ROW–Rest of the World) is complementary to Indonesian coffee. This indicates that Indonesian coffee and coffee from other countries are difficult to distinguish or identical.Mexican coffee prices and Vietnamese coffee price that does not give effect, indicating that Japanese consumers prefer domestic coffee or coffee from other countries than Mexican coffee or Vietnamese coffee. b. NetherlandPartial test results indicated that demand for Indonesian coffee in the Netherland influenced by Columbia coffee prices and Mexican coffee prices. While the price of Brazilian coffee price and Vietnamese coffee prices had no significant effect (neutral). The effect Columbia coffee price accounted for (0.5651) with α=0.1960 means that if the price of coffee Columbia increased by 1%, the demand for Indonesian coffee in the Netherlands was reduced to 0.57% at 81% confidence level. It can be concluded that the Columbian coffee is a substitute of Indonesian coffee, means that Columbian coffee is a competitor of Indonesian coffee.The effect of Mexican coffee price accounted for (-0.1317) with α=0.1754, meaning that if the price of Mexican coffee increased by 1%, the demand for Indonesian coffee in the Netherlands fell by 0.13% at 83% confidence level. It means that Mexican coffee is a complement of Indonesian coffee. In other words, Mexican coffee is a partner of Indonesian coffee.On the other hand, Brazilian coffee prices and Vietnamese coffee prices had no significant effect, indicates that consumers prefer domestic coffee or coffee from other importing countries such as Columbia and Indonesia.c. United StatesPartial test results indicated that Indonesian coffee demand in the United States are affected by Brazilian coffee price, Columbian coffee prices, income and demand for Indonesian coffee last year. The effect of Mexican coffee price accounted for (-0.60305) with α=0.0619 means that if Mexican coffee price increased by 1%, the demand for Indonesian coffee in the United States decreased by 0.60% in the 94% confidence level. It means that Mexican coffee is a complementary of Indonesian coffee. Thus, Mexico can partner with Indonesia to meet the demand for coffee in the United States. The effect of Indonesian coffee price accounted for (-0.46944) with α=0.0063 means that if the price of coffee in Indonesia increased by 1%, the demand for Indonesian coffee in the United States decreased by 0,47% at 99% confidence level. This is in accordance with the law of demand, when the price of goods is increased, the demand will fall. Indonesian coffee consumers in the United States will switch to coffee from other countries. The effect of U.S. income accounted for (0.496877) with α=0.0037 means that if income rose by 1%, the demand for Indonesian coffee in the United States increased by 0.50% at confidence level >99%. It indicates that Indonesian coffee in the United States is a normal good. The effect of Indonesian coffee demand last year accounted for (0.370429) with α=0.0554 means that if the United States’ demand for Indonesian coffee last year increased by 1%, the demand for Indonesian coffee this year will increase by 0.37% at 94% confidence level. It is caused by Indonesian coffee consumption in the United States had increased the confidence of Indonesian coffee. The reason for this confidence is due to the good quality of Indonesian coffee, or due to Indonesian coffee meet the taste of consumers in the United States. d. GermanyBased on the partial test results, the variables that significantly affect the demand for Indonesian coffee in Germany is Brazilian coffee prices, Columbian coffee prices, Indonesian coffee prices, and Germany’s income. While Mexican coffee prices and Vietnam coffee prices had no significant effect (neutral). The effect of Brazilian coffee prices accounted for (0.823846) with α=0.1288 means that if the Brazilian coffee prices increased by 1%, the demand for Indonesian coffee in Germany increased by 0.82% at 87% confidence level. It means that Brazilian coffee is a competitor of Indonesian coffee. The effect of Columbian coffee prices accounted for (-1.08039) with α=0.0063, meaning that if Columbian coffee price increased by 1%, the demand for Indonesian coffee in Germany fell by 1.08% at confidence level >99%. It means that Columbian coffee is a complementary to Indonesian coffee. Thus, Columbia could be Indonesia’s partner in meeting the demand for coffee in Germany. The influence of Indonesian coffee prices in Germany accounted for (-0.78150) with α=0.0111, meaning that if Indonesian coffee price increased by 1%, the demand for Indonesian coffee in Germany fell by 0.78% at 99% confidence level. This is in accordance with the law of demand that if the price of goods rise, the demand for goods will fall, and vice versa. When the Indonesian coffee prices rise, consumers will switch to coffee from other countries. The influence of Germany’s income accounted for (0.794564) with α<0.0001 means that if the Germany’s income increased by 1%, the demand for Indonesian coffee in Germany increased by 0.79% at confidence level >99%. It means that Indonesian coffee is normal good in Germany. This increased of confidence of Indonesian coffee is due to the good quality of Indonesian coffee, or as consumer tastes prefer Indonesian coffee than coffee from other country. e. AustraliaBased on the partial test results, demand for Indonesian coffee in Australia is influenced by Columbian coffee prices and Australia’s income. While Brazilian coffee prices, Mexican coffee prices, Vietnamese coffee prices and coffee prices from other exporting countries had no significant effect (neutral). The effect of Columbian coffee prices accounted for (-1.06127) with α=0.0409 means that if Columbian coffee prices increased by 1%, the demand for Indonesian coffee in Australia was reduced to 1.06% at 96% confidence level. It indicates that Columbian coffee is a complementary with Indonesian coffee, thus Columbia can be Indonesia’s partner to meet the demand for coffee in Australia. The effect of Australian income accounted for (1.079162) with α<0.0001 means that if the Australian revenue increased by 1%, the demand for Indonesian coffee in Australia increased by 1.08% at confidence level >99%. It shows that Indonesian coffee is a normal good in Australia. It can be seen that the demand for Indonesian coffee in Australia is only influenced by two variables, namely Columbian coffee prices and Australian income, while the price of coffee from other exporting countries are not significant. It can be explained that Indonesian coffee meet the Australian consumer tastes, especially Australia is a close neighbor of Indonesia that Indonesian coffee can go relatively easy. When compared with the previous four countries, Indonesian coffee has few competitors in Australia. In relation to the characteristics of product, if the degree of difference between the two products is getting larger, then the products will be difficult to be substituted by other goods. Indonesian coffee in Australia can be considered very different from other exporting countries. Therefore, it is difficult for Indonesian coffee to be substituted by coffee from other countries. Based on the analysis of Indonesian coffee demand in some countries above, it can be concluded that Indonesian coffee face different competitors in each country of export destination. In Japan, Indonesian coffee competes with Columbian coffee. However, in Australia and Germany, Indonesian coffee can partner with Columbian coffee. This indicates that the elasticity of substitution for the same product would be different regarding the conditions faced in different countries.Countries with relatively similar income per capita, will tend to trade with each other, ceteris paribus, because consumers in these countries tend to have the same tastes, and products produced by the country can meet the tastes of each other (Linder: 1996, in Blonigen: 1999). In addition, consumers can also make country of origin as a signal of quality. Products from certain countries that have been considered to have a low control of quality or weak attention to the surrounding environment will be difficult to be accepted in a country that has serious attention to both of these things. 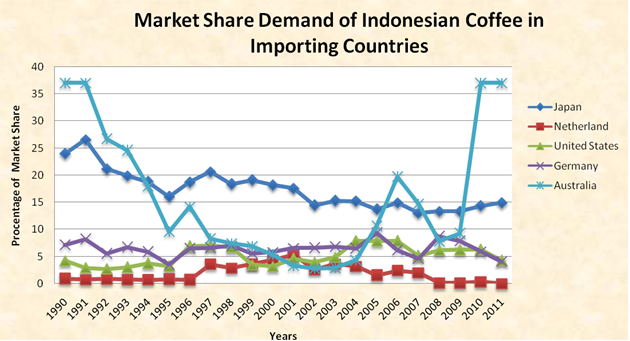 | Figure 3. Market Share Demand of Indonesian Coffee In Importing Countries |
5.2. Analysis with Supply Equation
a. JapanThe result of partial test shows that supply of coffee from Indonesia to Japan is not only influenced by Indonesian coffee price, but also by last year Japanese demand.It also shows the variables that significantly affect coffee supply from Indonesia to Japan are the supply of last year Indonesian coffee (0.9987) with α=<0.0001. Meanwhile, the price of Indonesian coffee has no significant effect (neutral) with α=0.80840.0220.Indonesian coffee price in Japan is 0.0220 with α=0.8084 which means that if the price of coffee in Indonesia increases by 1% then Indonesian coffee supply in Japan increases 0.02% at level of trust 81%, and if the price of coffee in Indonesia decreases 1% then Indonesian coffee supply in Japan decreases 0.02% at level of trust 81%. It is reasonable, in accordance with the law of supply; an increase in price of goods will result in an increase in the supply of goods and sets off a decline in price of goods and supply of goods. The increase or decrease in the number of items offered as a result of price change is not too large. This is indicated by the elasticity of 0.02 (not elastic).The influence of last year Indonesian coffee supply in Japan is 0.9987 with α = <0.0001, which means if last year’s Indonesian coffee supply increases 1%, then Indonesian coffee supply in Japan rises by 1.00% with level of trust > 99%, and if last year’s Indonesian coffee supply decreases 1%, Indonesian coffee supply in Japan falls by 1.00% at level of trust> 99%. It shows that proportional changes in the price of coffee in Indonesia cause proportional changes in supply as well (unitary elastic), which means in Japan Indonesian coffee is preferred.b. NetherlandFurthermore, based on a partial test, Indonesian coffee supply to Netherlands is influenced by Indonesian coffee price itself. It shows that the only variable that significantly affects demand for Indonesian coffee in Netherlands is the price of Indonesian coffee (8.8213) with α = 0.0001. This means that if the price of Indonesian coffee increases 1%, the supply will increase by 8.82% at level of trust> 99%, and if the price of Indonesian coffee decreases 1%, the supply will decrease by 8.82% at the level of trust > 99%. Elasticity of the supply is very elastic, a little change in price will result in a huge change in the amount offered.c. United StatesPartial test result indicates that Indonesian coffee supply to the United States is affected by the price of Indonesian coffee.It also indicates that the variable which significantly affects Indonesian coffee supply in the United States is the price of Indonesian coffee (11.84212) with α <0.000, which means if the price of Indonesian coffee increases 1%, Indonesian coffee supply in the United States increases 11.84% with level of trust> 99%, and conversely if the price of coffee in Indonesia decreases 1%, then Indonesian coffee supply in the United States decreases 11.84% with level of trust >99%. It shows that the supply of Indonesian coffee in the United States is very elastic, just a marginal change in price that will result in a big change in the supply.d. GermanyPartial test result shows that Indonesian coffee supply to Germany is affected by the price of Indonesian coffee.The variables indicate that the factor which significantly affects Indonesia coffee supply in Germany is the price of Indonesian coffee itself (7.902285) with α <0.0001, meaning if the price of Indonesian coffee increases 1%, Indonesian coffee supply in Germany increases 7.9% with level of trust > 99% and conversely, if the price of Indonesian coffee decreases 1%, then Indonesian coffee supply in Germany decreases 7.9% with level of trust > 99%. It shows that the supply of Indonesian coffee in Germany is elastic, a marginal change in price extremely affects the supply of Indonesian coffee.e. AustraliaPartial test result shows that the supply of Indonesian coffee to Australia is influenced by last year Indonesian coffee supply to Australia.It indicates that the variables which significantly affect Indonesian coffee supply in Australia is last year Indonesian coffee supply (0.708588) with α = 0.0009. Meanwhile, Indonesian coffee prices, exchange rate and technology have no significant effect.Last year’s Indonesian coffee supply is 0.708588 with α = 0.0009, which means if last year’s Indonesian coffee supply increases 1%, then Indonesian coffee supply in Australia increases 0.71% with level of trust >99% and vice versa. If last year’s Indonesian coffee supply decreases 1 %, Indonesian coffee supply in Australia decreases 0.71% with level of trust >99%. This suggests that a change in last year supply does not excessively affect this year supply (not elastic because it is <1).Coffee supply from Indonesia to Japan, Netherlands and Germany is likely to decline; fluctuations in Japan as well as in Germany are relatively large. Meanwhile, the fluctuations of coffee supply in Netherlands are relatively small. The trend of Indonesian coffee supply in the United States is likely to increase with relatively great fluctuations, while the trend of coffee supply to Australia tends to increase with relatively small fluctuations, as in the following figure: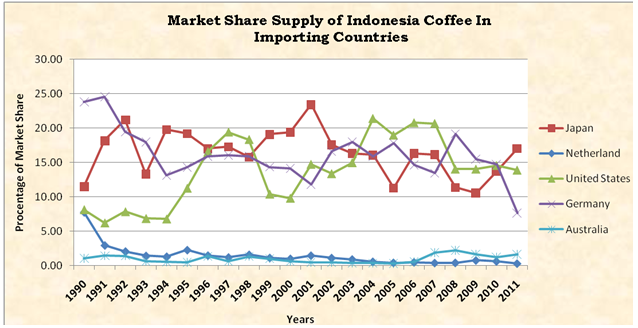 | Figure 4. Market Share Supply of Indonesian Coffee In Importing Countries |
5.3. Analysis with Price Equation
a. JapanPartial test shows that Indonesian coffee price in Japan is influenced by Indonesian coffee price (producer price); Rupiah exchange rate against US dollar and technology.Partial test result also indicates that the variables that significantly affect Indonesian coffee supply in Japan are Indonesian coffee price (producer price) 0.6957 with α=0.01; Rupiah exchange rate against US dollar (-0.4973) with α=0.0050, and technology (0.3698) with α=0.0304, while last year’s price of Indonesian coffee (consumer price) has no significant effect.The effect of Indonesian coffee price (producer price) is 0.6957 with α=0.01, which means if the price of coffee in Indonesia (producer price) increases 1%, consumer price in Japan rises 0.69% at level of trust 99%. And conversely, if the price of coffee in Indonesia (producer price) decreases 1%, consumer price in Japan declines 0.69% at level of trust 99%. It shows that the rise in producer price toward consumer price is not elastic, which means the change does not significantly affect producer price to consumer price in Japan.The effect of Rupiah exchange rate against US dollar is -0.4973 with α=0.0050, which means that if the value of the rupiah against US dollar increases 1%, Japanese consumer prices decreases 0.50% at level of trust >99%. And otherwise, if Rupiah exchange rate against the US dollars decreases1%, Japanese consumer price increases 0.50% at level of trust >99%. It shows that the change in Rupiah exchange rate against consumer price is inelastic, meaning changes in Rupiah exchange rate against US dollar does not significantly affect consumer price in Japan.The influence of technology is 0.3698 with α = 0.004, which means that if technology improves 1% (no improvement), consumer price of Indonesian coffee in Japan rises 0.37% at level of trust >96%. It shows that the improvement of technology toward consumer price is inelastic, which means technological improvement does not significantly affect consumer prices in Japan.b. NetherlandFurthermore, from the partial test, Indonesian coffee price in the Netherlands is influenced by Indonesian coffee price (producer price), Rupiah exchange rate against US dollars, and technology.This suggests that variables which have real impact on the price of Indonesian coffee in Netherlands are Indonesian coffee price (producer price) as much as 0.906074 with α<0.0001, Rupiah exchange rate against US dollars (-0.55354) with α=0.0001, and technology (0.722887) with α=<0.0001, and last year Indonesian coffee consumer price (-0.41960) with α=0.0200.The influence of Indonesian coffee price (producer price) is 0.9060 with α<0.000, which means that if the price of Indonesian coffee increases 1%, consumer price in Netherlands rises 0.91% at level of trust >99%. And conversely, if the price of coffee in Indonesia decreases 1%, consumer price in Netherlands declines 0.91% at level of trust >99%. It shows that the increase in producer price toward consumer price is not elastic but quite influential because its value is nearly 1.The effect of Rupiah exchange rate against US dollars is -0.55354 with α=0.0001, which means that if the value of Rupiah against US dollars increases 1%, consumer price in Netherlands decreases 0.55% at level of trust >99%. And conversely, if Rupiah exchange rate against US dollars decreases 1%, consumer price in Netherlands rises 0.55% at level of trust >99%. It shows that the change in Rupiah exchange rate toward consumer price is inelastic, which means a change in Rupiah exchange rate against the US dollars does not significantly affect consumer prices in the Netherlands.The influence of technology is 0.7228 with α=<0.0001, which means if technology improves 1% (no improvement), the consumer price of Indonesian coffee in Netherlands increases 0.73% at level of trust 99%. It shows that the improvement of technology toward consumer price is inelastic, which means that improvement of technology does not significantly affect consumer prices in Netherlands.The influence of last year consumer price has a significant effect 0.41960 with α=0.0200, meaning if last year consumer price increases 1%, the current year consumer price increases 0.42% at level of trust 98%. And conversely, if last year consumer price decreases 1%, current year consumer price declines 0.42% at level of trust 98%. It shows that the rise in last year consumer price toward current year consumer price is inelastic, which means that last year consumer price has little influence on consumer price in Netherlands in the current year.c. United StatesPartial test result shows that Indonesian coffee price in the United States is affected by the price of Indonesian coffee (producer price); Rupiah exchange rate against the US dollars, and technology. It shows that the variables which have a real impact on the demand for Indonesian coffee in the United States is producer price (0.6669) with α=0.0003, Rupiah exchange rate (-0.4407) with α=0.0120, and technology (0.6928) with α=0.0015, while last year’s Indonesian coffee price has no significant effect. The influence of producer prices (0.6669) with α=0.0003 means that if the price of Indonesian coffee increases 1%, then the supply will rise 0.67% at level of trust >99%. Conversely, if Indonesian coffee price decreases 1%, the supply will go down 0.67% > at level of trust 99%. This is in accordance with the law of supply; the rise in producer price is when goods are sold in large numbers and conversely the cheap producer price is when goods are sold in a few numbers. However, tendency in selling goods is not very much affected by price change. The influence Rupiah against the US dollar (-0.44074) with α=0.0120 means that if the value of Rupiah against dollar inclines 1%,then the supply of Indonesian coffee alls 0.67% at level of trust 99%, and vice versa if Rupiah exchange rate against dollar declines 1%,then the supply of Indonesian coffee will rise 0.44% at level of trust 99%. It shows that the change in Rupiah exchange rate toward consumer price is inelastic, which means that change in the rupiah exchange rate against US dollars does not significantly affect Indonesian coffee supply in the United States.d. GermanyPartial test result shows that Indonesian coffee price (consumer prices) in Germany is affected by the price of Indonesian coffee (producer price), Rupiah exchange rate against the US dollars, technology, and last year price of Indonesian coffee.Partial test also shows that the variables that have real impact on the price of Indonesian coffee in Germany is Indonesian coffee price (producer price) with α = 0.676675 < 0.0005; Rupiah exchange rate against the US dollars (-0.43218) with α=0.0112; technology (0.3513) with α=0.0395; as well as last year Indonesian coffee price in Germany (0.216504) with α =0.1534. Mean while, the price of Indonesian coffee has no significant effect. The influence of Indonesian coffee price (producer price) is 0.676675 with α<0.0005 which means that if the price of Indonesian coffee (producer prices) increases 1%, consumer price in Germany rises 0.68% at level of trust>99%. Conversely, if the price of Indonesian coffee (producer price) decreases 1%, then consumer price in Germany falls 0.68% at level of trust >99%. It is in accordance with the law of supply, the rise in producer price is when goods are sold in large numbers and conversely the cheap producer price is when goods are sold in a few numbers. But the tendency of manufacturers in selling goods is not very much affected by price change.The effect of the rupiah exchange rate against US dollars is -0.43218 with α=0.0112, which means that if the value of Rupiah against US dollars increases by 1%, the consumer price in Germany falls 0.43% at level of trust 95%, and conversely if Rupiah exchange rate against US dollars decreases 1% then consumer price in Germany increases 0.43% at level of trust 95%. It shows that the change in Rupiah exchange rate toward consumer prices is inelastic, which means that a change in rupiah exchange rate against the US dollars does not significantly affect Indonesian coffee supply in Germany.The influence of technology is 0.3513 with α=0.00395, meaning that if technology improves (there are improvements) 1%, the price of Indonesian coffee (consumer price) in Germany increases 0.35% at level of trust>99%. It shows that the improvement of technology toward consumer price is inelastic, which means improvement of technology does not significantly affect consumer price in Germany.The influence of last year consumer price in Germany is 0.2165 with α=0.1534 which means if last year price of Indonesian coffee (consumer price) in Germany increases 1%, the price of Indonesian coffee in the current year (consumer price) increases 0.22% at level of trust 88%, and vice versa. It shows that the rise in last year consumer prices toward the current year consumer price is inelastice. AustraliaThe result of partial test shows that consumer price of Indonesian coffee in Australia is influenced by the price of Indonesian coffee; Rupiah exchange rate against the US dollars and technology.Partial test also shows that the variables which have a real impact on the price of Indonesian coffee in Australia is Indonesian coffee price (producer price) (0.447663) with α=0.0100; Rupiah exchange rate (-0.27285) with α=0.0738; and technology (0.533098) with α=0.0034. Meanwhile, the price of Indonesian coffee (consumer price) has no significant effect. The influence of Indonesian coffee price (producer price) is 0.447663 with α = 0.0100, which means if the price of Indonesian coffee (producer price) increases 1%, consumer price in Australia increases 0.45% at level of trust >99%. And conversely, if the price of Indonesian coffee (producer price) is lowered 1%, the consumer price in Australia falls 0.45% at level of trust >99%. It is in accordance with the law of supply, the rise in producer price is when goods are sold in large numbers and conversely the cheap producer price is when goods are sold in a few numbers. But the tendency of manufacturers in selling goods is not very much affected by price change. The effect of Rupiah exchange rate against US dollars is -0.27285 with α=0.0738, which means if the value of Rupiah exchange against US dollars increases 1%, consumer price in Australia decreases by 0.27% at level of trust 92%. Conversely, if Rupiah exchange rate against the US dollars decreases 1%, consumer price in Australia increase 0.27% at level of trust 92%. It shows that the change in Rupiah exchange rate toward consumer prices is inelastic, which means a change in Rupiah exchange rate against the US dollars does not significantly affect Indonesian coffee supply in Australia.The influence of technology (0.53) with α=0.0034 means that if technology improved (there are improvements) 1%, the consumer prices of Indonesian coffee in Australia increases 0.533% at level of trust 92>99%. It shows that the improvement of technology toward consumer price is inelastic, meaning improvement in technology does not significantly affect consumer price in Australia.Indonesian coffee price trends at five importing countries have a tendency to increase in 1990-in 2011, with different increase at each country. The largest increase in the price of Indonesian coffee from is in the United States, Netherlands, Australia, Germany and Japan respectively. The graph of Indonesian coffee price trends at five importing countries is presented in the following figure: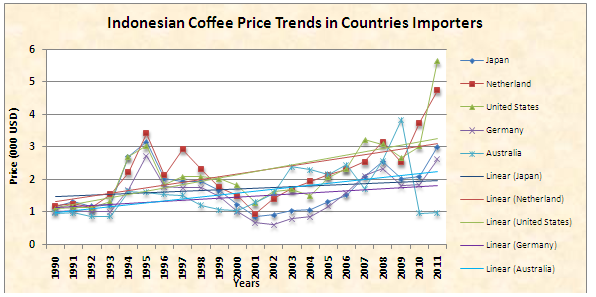 | Figure 5. Indonesian Coffee Price Trends in Countries Importers |
6. Research Implications
The implications of this research include the following:1) Considering from the exporting country, Indonesia should establish cooperation with partner countries and which are neutral in order to compensiate for coffee from competitor countries.2) Considering from the importing country, Indonesia should immediately determine the action by increasing the amount of coffee exports to countries where Indonesian coffee are considered as normal goos.3) Export subsidies can be done to motivate the entrepreneurs (exporters) in order to increase the amount of coffee exports.4) Policies need to be applied to the coffee agribusiness from upstream to downstream.At the upstream, coffee plant cultivation needs to be done more professionally in order to increase production, productivity and improve the quality of coffee. At the downstream, coffee is marketed not only in the form of coffee beans, but also marketed as processed coffee to increase the value added.
7. Conclusions
From the results of research and discussion in this study, it can be concluded that the competitiveness of Indonesia in the international coffee as below:1. Review from demand side: a. In Japan, Brazilian coffee and Columbian coffee are competitors of Indonesian coffee; while Mexican coffee and Vietnamese coffee are neutral.b. In the Netherlands, Columbian coffee is a competitor of Indonesian coffee, while Mexican coffee is a partner of Indonesian coffee. On the other hand, Brazilian coffee and Vietnamese coffee are neutral.c. In the United States, Mexican coffee is a partner of Indonesian coffee, while Brazilian coffee, Columbian coffee and Vietnamese coffee are neutral.d. In Germany, Brazilian coffee is a competitor for Indonesian coffee, while Columbian coffee is a partner of Indonesian. On the other hand, Mexican coffee and Vietnamese coffee are neutral. e. In Australia, Columbian coffee is a partner of Indonesian coffee, while Brazilian coffee, Mexican coffee and Vietnamese coffee are neutral.2. Review from supply side:Indonesian coffee offer in Japan and Australia are affected by supply last year, while in the Netherlands, United States and Germany are influenced by Indonesian coffee prices (producer prices).3. Review from price side:Consumer prices in the five Indonesian coffee importing countries (Japan, Netherlands, United States of America, Germany and Australia) is influenced by producer prices, the exchange rate against the United States dollar and technology, while consumer prices last year had no significant effect except in the German states.
8. Future Research
Many government policies such as tax has not been included in the model. In for the result analysis to cover the problems generally, it is necessary to include tax on future studies.
References
| [1] | Agus S, Ati K, Rudi H, M Rondhi. 2012. Mencermati Perkembangan Perilaku Permintaan Luar Negeri/Ekspor Kopi Indonesia di Negara-negara Pengimpornya: Khususnya Kopi Robusta. Simposium Nasional Ekonomi Kopi 2012. Kerjasama antara Perhepi dg Universitas Jember. 8 Nopember 2012. |
| [2] | Asheghian, P and B. Ebrahimi. 1990. International Business. Harper and Row, Publishers, Inc., New York. |
| [3] | Baroh, I., Hanani, N., Setiawan, B. and Koestiono, D. 2014. Indonesian Coffee Competitiveness in The International Market: Review From The Demand Side – International Journal of Agriculture Innovation and Research. Vol. 3, Issue 2, ISSN (Online) 2319-1473. |
| [4] | Bhattacharyya, Ruma. 2011. Revealed Comparative Advantage and Competitiveness: A Case Study in Horticultural Products. International Conference on Applied Economics – ICOAE 2011. |
| [5] | Blonigen, Bruce. A, Wesley W. Wilson. 1999. Explaining Armington: What Determines Substitutability between Home and Foreign Goods? The Canadian Journal of Economics/ Revue canadienne d’Economique, Vol. 32, No. 1 (Feb., 1999), pp.1-21. |
| [6] | Blonigen, Bruce. A. 1999. In Search of Substitution Between Foreign Production and Exports. NBER Working Paper Series. |
| [7] | Bohman, Mary and Jarvis, Lovell. 1999. The International Coffee Agreement: a tax on coffee producers and consumers. Working Paper No. 99-004 1999. Giannini Foundation of Agricultural Economics University of California, Davis.http://arelibrary.ucdavis.edu/workingpapers/files/99-004.pdf. |
| [8] | Branson, W.H. and J.M. Litvack. 1981. Macroeconomics of Production. John Willey & Sons Inc., Washington D.C. |
| [9] | Cave, B. 1980. International Banking Act of 1978. Journal of Federation of Bankers Association of Japan, Sept. 1980. |
| [10] | Daryanto, A. 2009. Dinamika Daya Saing Industri Peternakan. IPB Press. Bogor. |
| [11] | DePass, D. 2010. Starbucks versus Ethiopia Corporate Strategy and Ethical Sourcing in the Coffee Industry.Case Studies in EthicsThe Kenan Institute for Ethics at Duke University.dukeethics.org. |
| [12] | Hasyim, A.I. 1994. Ekonomi Internasional. Universitas Lampung. Bandar. Lampung. |
| [13] | Labys, W.C. 1975. Dynamic Commodity Models: Spesification, Estimation and Simulation. D.C. Heat and Company, Lexington. |
| [14] | Krugman, P.R., and M. Obstfeld. 1991. Ekonomi Internasional: Teori dan Kebijakan. Terjemahan Faisal H. Basri. PT. Raja Grafindo Persada, Jakarta. |
| [15] | Kindleberger dan Lindert, 1982.International Economics. Edition number 7. Irwin Series in Economics. McGraw-Hill Higher Education. |
| [16] | Kustiari, Reni. 2012. Analisis Daya Saing Kopi Indonesia di Pasar Dunia. Bogor; Pusat Sosial Ekonomi dan Kebijakan Pertanian. |
| [17] | Lubis (2002). Dampak Liberalisasi Perdagangan Terhadap Keragaan Industri Kopi Indonesia dan Perdagangan Kopi Dunia. Bogor. |
| [18] | Nuhfil Hanani, Rosihan Asmara dan Fahriyah, 2012. Persaingan Ekspor Kopi Indonesia di Padasr Internasional.. Simposium Nasional Ekonomi Kopi 2012. Kerjasama antara Perhepi dg Universitas Jember. 8 Nopember 2012. |
| [19] | Salvatore, D. 1997. Ekonomi Internasional. Haris Munandar. [penerjemah]. Erlangga, Jakarta. |
| [20] | Saragih, B. 2000. Agribisnis Berbasis Peternakan: Kumpulan Pemikiran. USESE Foundation dan Pusat Studi Pembangunan Institut Pertanian Bogor, Bogor. |
| [21] | Sudaryanto, T dan P. Simatupang. 1993. Arah Pengembangan Agribisnis: Suatu Catatan Kerangka Analisisdalam Prosiding Perspektif Pengembangan Agribisnis di Indonesia. Pusat Penelitian Sosial Ekonomi Pertanian. Bogor. |
| [22] | Suprihatini, R. 2000. Faktor-faktor yang Mempengaruhi Rendahnya Harga Teh Indonesia di Jakarta Tea Auction. Tinjauan Komoditas Perkebunan. Kelapa Sawit, Karet, Gula, Kopi, Kakao, dan Teh Vo.1. No.1. September – November 2000. Asosiasi Penelitian Perkebunan Indonesia (APPI) dan Direktorat Jenderal Perkebunan. |
| [23] | Sustainable Coffee Program, 2014. Indonesia: A business case for sustainable coffee production. Techno Serve. |
| [24] | Vesdapunt, K. 1984. Thailand Rice Policy Model: A Simulation Analysis. PhD Dissertation. University of The Philippines, Los Banos. |
| [25] | Webb, Michael S. and Hall, Viv B, 2009. Application of A Dynamic Panel Data Estimator To Cross-Coaunemand: A Tale of Two Eras. Journal of Economic Development. Volume 34, Number 1, June 2009.http://www.jed.or.kr/full-text/34-1/1.pdf. |
 Abstract
 Reference
 Full-Text PDF
 Full-text HTML