T. Odongo1, J. W. Muwanga2
1Department of Finance, Makerere University Business School, Kampala, Uganda
2College of Business and Management Sciences, Makerere University (Main Campus), Kampala, Uganda
Correspondence to: T. Odongo, Department of Finance, Makerere University Business School, Kampala, Uganda.
| Email: |  |
Copyright © 2014 Scientific & Academic Publishing. All Rights Reserved.
Abstract
This study uses structural VAR approach to investigate price pass through effect within Uganda’s cotton industry in the period following trade liberalization. The results in this study are obtained from estimates of variance decomposition and accumulated impulse responses of domestic price level to shocks from world cotton price. The study discovered that there exists insignificant pass through effect of world cotton price shocks to farm gate price in the period following trade liberalization. The study recommends for favorable structure to be put in place to encourage functioning of futures market so that whenever prices change in the world market it would be reflected in the local market.
Keywords:
Price Pass-Through Effect Following Trade Liberalization
Cite this paper: T. Odongo, J. W. Muwanga, Price Pass-Through Effect within Uganda’s Cotton Industry Following Trade Liberalization, American Journal of Economics, Vol. 4 No. 4, 2014, pp. 159-170. doi: 10.5923/j.economics.20140404.01.
1. Introduction
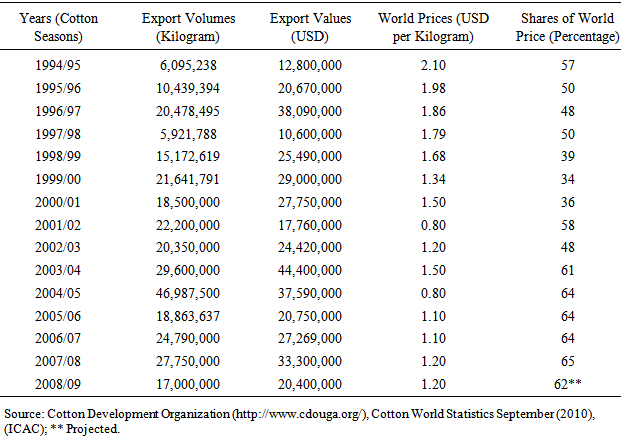
The debate on the role of price system to export performance of agricultural commodities has been central in contemporary research since 1958 when Nerlove developed a study on the supply response of farm products to price changes in American market. To date, several studies have indicated that export of agricultural commodities from developing countries are in response of price incentive introduced to these countries following economics and structural reforms1 of 1990s (Ssemogere and Kasekende, 1994), (Kihangire and Apaa, 2007) and (Ashfaq, Sheikh and Akmal, 2010). During the 1990s, most developing countries sought to raise export by liberalization of international trade and payments (Greenaway, Wyn and Wright, 2002). Trade liberalization was introduced to developing countries as part of the Structural Adjustment Program under International Monetary Fund and World Bank (Balassa, 1983). It was intended to induce efficiency in production by increasing sensitivity of export to price changes in the world market (Santos-Paulino and Thirlwall, 2004). In the period following trade liberalization, domestic exports from developing countries were expected to be stimulated by high and rising international prices (Ssemogere and Kasekende, 1994). In essence, increase in relative prices of export commodities from developing countries during this period would signal a positive shift in domestic supply of such commodities to the world market (Santos-Paulino and Thirlwall, 2002). Uganda liberalized export of her major cash crops during the 1990s. Cotton was one of such cash crops. It was liberalized in 1994 following enactment of cotton development statute to oversee activities within the cotton industry. The new environment brought about a number of changes in the cotton industry. Such changes include; dismantling of lint marketing board that had previously monopolized lint export from the country, abolition of union monopoly over cotton export, elimination of licensing of cotton products and other regulatory bodies within the cotton industry, creation of cotton development organization to oversee cotton seed production in the country, increased participation of private sector in the cotton industry and determination of farm gate prices by demand conditions in the world market.Cotton is one of the several agricultural export crops which are vital to Uganda’s economic growth. It is produced in almost all parts of the country and employs a considerable number of households. Uganda’s cotton is of high premium and it is extremely valued by international consumers (Bakunda, 2005). Cotton is Uganda’s fourth largest agricultural foreign exchange earner after coffee, tea and tobacco. It has potential to increase its contribution to the economy through greater foreign exchange earnings, value addition, rural and urban employment creation (Collinson, Kleih and Burnett, 2002). This therefore implies that intervention in the cotton sector is vital for poverty eradication. In the period following liberalization of Uganda’s cotton industry, the volumes of lint export from Uganda increased significantly, from 6,095,238 kilograms in 1994/95 to 17,000,000 kilograms in 2008/09. The values of lint export from the country during this period increased from United States Dollar (USD) 12,800,000 in 1994/95 to United States Dollars (USD) 20,400,000 in 2008/09. The shares of world market price received by Uganda’s cotton farmers increased from 57 percent in 1994/95 to 62 percent in 2008/09 (see table 1). Nevertheless, despite such significant performance, average growth rate of lint export from the country during this period surprisingly declined, by 4.18 percent per annum (see figure 1). The case of the decline in average growth rate of lint export from Uganda despite improved performance in the shares of world market price received by the local cotton farmers is a motivation for this study to investigate empirically price pass through effect within Uganda’s cotton industry in the period following trade liberalization.Table 1. Volumes of Uganda’s Lint Export following Trade Liberalization
 |
| |
|
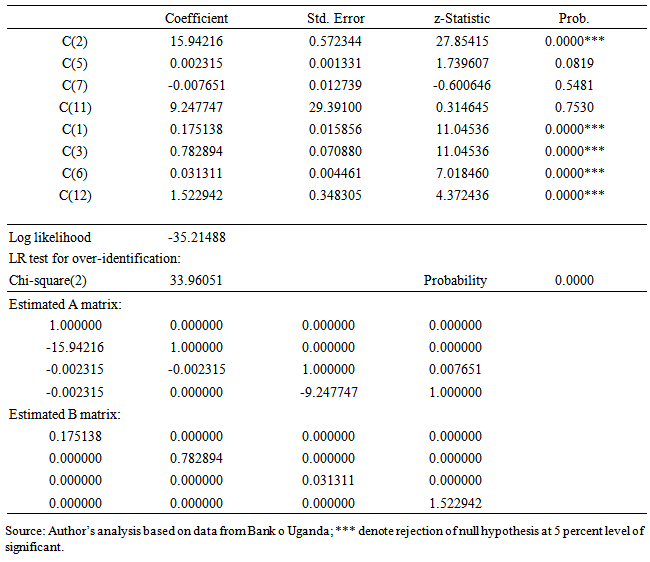
Table 2. Estimates of Structural VAR Coefficients of Matrices A and B
 |
| |
|
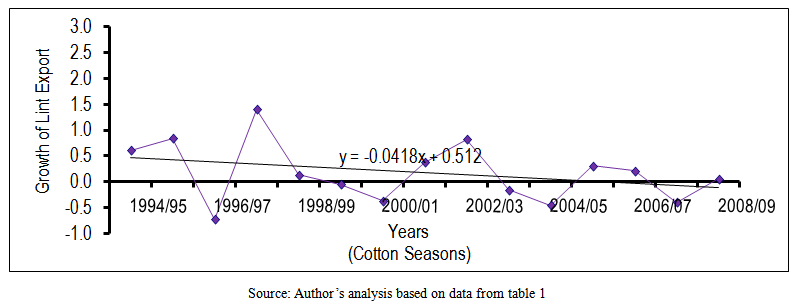 | Figure 1. Average Growth Rate of Uganda’s Lint Export following Trade Liberalization |
2. Empirical Background
The importance of price system to export performance of agricultural commodities from developing countries has been a subject of debate in various economic literatures. Some of these literatures indicate that the supply of traditional and nontraditional cash crops from developing countries has been in response of price incentives introduced to these countries following economics and structural reforms of 1990s. According to Kihangire and Apaa (2007), cotton farmers in Uganda are responsive to price incentives introduced to the country following liberalization of the cotton industry during the 1990s.Other scholars on the other hand, argue that increase in international prices of agricultural commodities exported from developing countries do not determine export capabilities of these countries. According to Mold and Prizzon (2008), the volumes of export commodities from non oil exporting countries of Africa increased significantly during the 1990s, despite being confronted with sharp declining prices. Regardless of the above observations, Ashfaq, Sheikh and Akmal (2010) presents mix results while investigating determinants of export performance of agricultural commodities from Pakistan. While increase in international prices of wheat and maize were found ineffective in promoting export of these commodities, it has been far more effective among rice producing farmers. Some scholars believe that changes in relative prices of agricultural commodities exported from Sub-Saharan African countries do not contribute significant effect on export of these commodities. In particular, changes in real exchange rate were found ineffective in stimulating export of agricultural commodities from Uganda during the 1990s (Ssemogerere and Kasekende, 1994). This performance implies that exchange rate policies pursued by some developing countries during this period do not enlist significant gains among export producers. Despite the dismal performance in export sector due to exchange rate policies mentioned above, some scholars believe that increase in share of world market price received by the local export producers is an important incentive that can drive positive movements in export sector (Baffes, 2002). This is because a rising share of world market price received by the local export producers can drive positive movements in export producing capabilities of developing countries. Accordingly, trade liberalization policy adopted by developing countries during the 1990s may not stimulate a positive shift in domestic supply of agricultural commodities to the world market without having had effect on the share of world market price received by the local export producers. In view of the above observation, one can argue that the liberalization of Uganda’s cotton industry during the 1990s may not stimulate a positive shift in domestic lint supply to the world market without having had effect on the share of world market price received by the local cotton farmers. This contention therefore calls for a critical study to investigate the price pass through effect within Uganda’s cotton industry in the period following trade liberalization.
3. Data and the Model
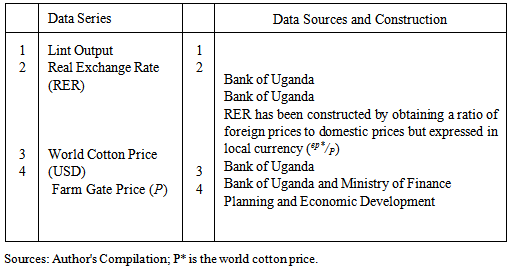
The data type for this study is secondary. These include quarterly data series dating from July 1993 to June 2009. The data series in this study include; world cotton price, real exchange rate, farm gate price and lint output. The data series indicated above were collected from Bank of Uganda (BOU) and Ministry of Finance, Planning and Economic Development (MFPED). The data series in this study and their sources are indicated below.Table 3. Data Series and their Sources
 |
| |
|
3.1. Descriptions of the Data Series
Descriptions of the data series used in this study have been carried out to provide insight on their characteristics. This is particularly important to this study because it provides quick understanding of the contributions of each an every data series to the overall results in the study.
3.1.1. Real Exchange Rate
This is a broad summary measure of price of one country relative to price of another country expressed in common currency. Data on real exchange rate indicated in this study measures the effect of relative price changes on lint export in the period following trade liberalization. Data on real exchange rate in the study has been computed by obtaining ratios of foreign to domestic prices expressed in common currency.
3.1.2. Lint Output
This indicates production capacity of the cotton industry in the period following trade liberalization. It also represents internal shocks to the cotton industry during this period. Increase in the volumes of lint output indicates improvement in production capacity of the cotton industry. While a fall in the volumes of lint output indicates decline in production capacity of the cotton industry. It has been assumed in this study that performance of lint output in the period following trade liberalization also affects farm gate price. Data on lint output has been obtained from a quarterly series of lint output.
3.1.3. Farm Gate Price
This captures domestic price level of raw cotton produced in the country in the period following trade liberalization. It has been assumed in this study that performance of farm gate price in the period following trade liberalization affects production capacity of the cotton industry and consequently the volumes of lint export from the country. Data on farm gate price in this study has been obtained from a quarterly series of farm gate price.
3.1.4. World Cotton Price
This represents external shocks to the cotton industry. It has been assumed in this study that shocks from world cotton price in the period following trade liberalization exogenously determine farm gate price but through the exchange rate. Data on world cotton price has been obtained from a quarterly series of world cotton price.
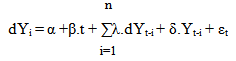
3.2. Model Specification
This study uses structural VAR procedure to investigate price pass through effect within Uganda’s cotton industry in the period following trade liberalization. The statistical methodology used in specifying the structural VAR model in this study considers a general form of auto regression process with ρ unknown but finite in each of the series. This exposes time series characteristics of the data estimated. Following Kumah and Matovu (2005), the general form of time series characteristic of a structural VAR model can be expressed as follows; | (1) |
Where; μ, ρ, δ and ξ1, ξ2.....and ξρ-- ℓ are coefficients. Residual (εt) is independent and identically distributed (iid) with zero mean and variance equal to σ2. A unit root test has been carried out on each of the variables using simple Dickey – Fuller test and Phillips Perron test. The study proceeds to test for cointegration to determine whether there exists any long run relationship within the variables in the model specified.Following Kumah and Matovu (2005), supposed that the data generating process for Xt has been carried out and expressed as a deduction from the VAR system as follows;  | (2) |
G(L) is an (nxn) matrix with lag polynomial of finite order L. Where L is lag operator such that; | (3) |
But Xt = log (World Cotton Price), Real Exchange Rate, log (Farm Gate Price) and log (Output). Ut is a matrix of economically meaningful shocks assumed to be serially uncorrelated with diagonal contemporaneous covariance matrix Ω. Since Go is considered invertible, the data generating process for Xt can be re-written as a deduction from the VAR system as follows.  | (4) |
Where; Co = I (The structural innovation is assumed orthogonal, that is its covariance matrix is an identity matrix) and this is further indicated by equation (5).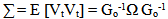 | (5) |
Following Kumah and Matovu (2005), exogeneity of world cotton price shocks, especially for a small country case has been captured by data generating process of a commodity price index modeled as an AR (k) process. Where k represents lag length assumed in estimation of the VAR system. The process of identification of the VAR system involves uncovering G (L) and Ω from the estimates of C (L) and ∑. This exposes economic structure of the VAR system.The analysis of price pass through effect within Uganda’s cotton industry in the period following trade liberalization follows a standard open economy macroeconomics model which consists of variables of supply (world cotton price), demand (output), exchange rate (real exchange rate) and domestic price level (farm gate price). The set up of the model is based on ordering of variables and restrictions are imposed on the structure of shocks. It is assumed in the structural VAR specification in this study that innovation in world cotton price in the period following trade liberalization exogenously determine farm gate price but through the exchange rate. Secondly, the study assumes that movements in farm gate price in the period following trade liberalization also include effect of output. Following Ito and Sato (2007), the structural shocks decomposition of variance/covariance matrix of reduced form residuals has been generated. The relationship between reduced form residuals (Vt) and the structural disturbance terms (Ut) has been uncovered using specification of the following form: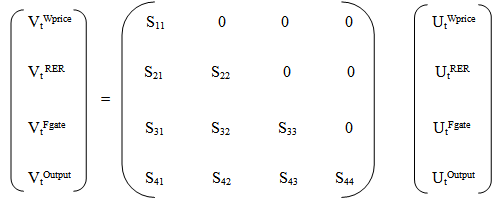 | (6) |
Ordering of variables in the above specification determines the structure of shocks. The first variable (world cotton price) has influential effect on all other variables below it, but it is not affected by any of these variables. The second variable (RER) receives impact from the first variable. It does not have any impact on the first variable but it influences all other variables below it. The third variable (farm gate price) receives impact from the first and the second variables but it does not have any impact on these variables. It has influential impact on the last variable. The last variable (output) receives impact from the first, the second and the third variables but it also has influential effect on the third variable. In the structural VAR model specified in this study, the price pass through effect at horizontal lag (ℓ) has been obtained through variance decomposition analysis and accumulated impulse responses with respect to an innovation of one standard deviation in world cotton price.
3.2.1. Restrictions on the Structural VAR Coefficients
The decomposition of variance/covariance matrix of reduced form residuals has been carried out on lower triangular matrix n(n-1)/2. Restrictions are imposed on this matrix to identify structural shocks in the case where shocks do not have any contemporaneous effect on endogenous variables (Siok and Zhanna, 2008). In a contemporaneous version of a four variable model, there are six (42-4)/2 restrictions required for exact identification of the effect of structural shocks on endogenous variables. Restrictions on structural VAR coefficients in this study are imposed on the structural error vector (Ui) on the basis of economic theory. To obtain economically meaningful results from the VAR system, the price pass through effect within Uganda’s cotton industry in the period following trade liberalization has been estimated using specification that links reduced form random errors (VtPworld; VtRER; VtPfarm and VtOutput ) with the structural errors (Ut,Pworld; UtRER; UtPfarm and UtOutput). Restrictions are imposed on the structural coefficients β21; β31; β32; β41; β42 and β43 which ensure that the results from the structural coefficients depict contemporaneous relationship between internal adjustments and unexpected exogenous shocks from world cotton price. Restrictions on the structural coefficients indicated in this study are imposed on initial period only because all variables in this study are permitted to freely interact with each others in all periods following the one in which innovation took place. This implies that coefficients β21; β31; β32; β41; β42 and β43 presented in matrix (7) below are all equal to zero.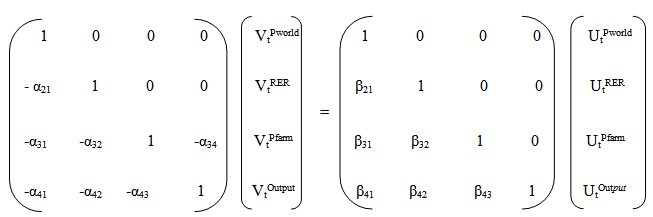 | (7) |
Following Kumah and Matovu (2005), coefficients - α21; - α31; - α32; - α34; - α41; - α42 and - α43 on the left hand side of matrix (7) depict the workings of internal adjustment due to external shocks, while the diagonal coefficients on the right hand side of matrix (7) capture the workings of external shocks due to structural innovation (Ut’s), represented by shocks from world cotton price (UtPworld), real exchange rate (UtRER), farm gate price (UtPfarm) and output (UtOutput). Matrix (7) therefore depicts contemporaneous relationship between internal adjustments and unexpected exogenous shocks from world cotton price in the period following trade liberalization. The variance decomposition analysis and accumulated impulse response functions in this study are all estimated in line with the above restrictions. The advantage of applying the structural VAR specification in this study is that it solves endogeneity problem that can occur under a single equation approach. Secondly this technique applies restrictions on the structural coefficients that identify structural shocks from the VAR system.
3.3. Data Estimation Techniques
This study uses e’views soft ware to analyze the data. Various analyses have been carried out in this study. These analyses include; stationarity test, cointegration test, variance decomposition analysis and accumulated impulse responses. The details of these analyses are indicated below.
3.3.1. Stationarity Test
The stationarity of each individual data series in this study has been estimated using Augmented Dickey Fuller (ADF) test and Phillips Perron test. A unit root null hypothesis has been tested against a stationary alternative. The stationarity test in the study uses regressions of time series data analyzed against a constant. These regressions can be expressed as follows; 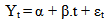 | (8) |
 | (9) |
The stationarity of residuals (εt) in this study have been tested. Lag lengths (p) of the ADF (dYt-i) and the Phillips Perron equations have been selected using Schwarz Information Criterion (SIC) and Bartlett Kernel respectively.
3.3.2. Cointegration Test
Johnsen (1988) procedure has been adopted by this study to test for cointegrating relationship within endogenous variables based on Maximum Likelihood (LM) test and unrestricted Vector Auto Regression (VAR) test. Cointegration rank r (number of cointegrating vectors) has been tested using trace statistics and Maximum Eigen Statistics (MES). The trace statistics test null hypothesis that there are at most r cointegrating vectors against alternative of r or more cointegrating vectors, while the Maximum Eigen Statistics test null hypothesis of r cointegrating vectors against alternative of r+1 cointegrating vectors.
3.3.3. Variance Decomposition Analysis
The variance decomposition analysis indicates percentage of forecast error variance due to shocks from other endogenous variables over the whole sample period. It is a structural VAR estimation technique that indicates the amount of information each variable contributes to other variables in an auto regression manner. It also determines the amount of forecast error variance that can be explained by exogenous shocks. The results from this analysis can be presented either in tabular or graphical forms. This study has chosen the tabular form to present the results from the analysis.
3.3.4. Accumulated Impulse Responses
Estimating endogenous variables as restricted by the number of cointegrating vectors provide estimates of the component necessary for obtaining accumulated impulse responses (Schmidt, Rejda and Lee 1999). The accumulated impulse responses of endogenous variables capture dynamic responses of endogenous variables due to one standard deviation in structural innovation. Restrictions are imposed on the structural coefficients which allow for a transformation process that uncovers shocks from the VAR system. Significance of the responses can be determined by the magnitude of coefficients relative to their standard errors (Schmidt, Rejda and Lee 1999). The results from this analysis can be presented either in tabular or graphical forms. This study has chosen the tabular form to present the results from the analysis.
4. Presentation and Discussions of the Result
The results from the analyses carried out in this study are obtained from the estimates of variance decomposition and accumulated impulse response functions of endogenous variables. The estimates of variance decomposition and accumulated impulse responses indicated in this study provide a framework for obtaining the results for the study. Details of the results from the analyses carried out in this study are presented below.
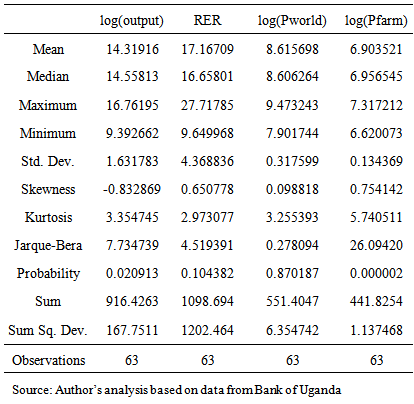
4.1. Descriptive Statistics
The descriptive statistics have been indicated in this study to provide explanation on the characteristics of the data estimated. The results for descriptive statistics in this study are presented in table 4. The summary statistics in table 4 indicate that normality test has been rejected in 2 out of 4 variables at 5 percent level of significance. The non normality in this table appears to be caused by the excess of kurtosis. Following the normality test the study proceeds to test for stationarity of endogenous variables using unit root test. Table 4. Descriptive Statistics Results
 |
| |
|
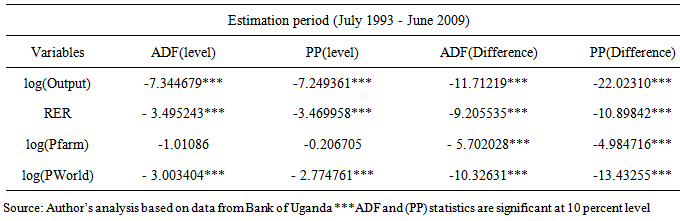
4.2. Stationarity of Endogenous Variables
The estimation of stationarity of residuals in this study has been carried out using Augmented Dickey-Fuller (ADF) test and Phillips Perron test. The summary statistics in table 5 present the Augmented Dickey-Fuller and the Phillips Perron statistics for the variables estimated. The results in this table indicate that all variables in the study are stationary at level, except for log (Pfarm) which is stationary at first difference. Table 5. Stationarity Test Results
 |
| |
|
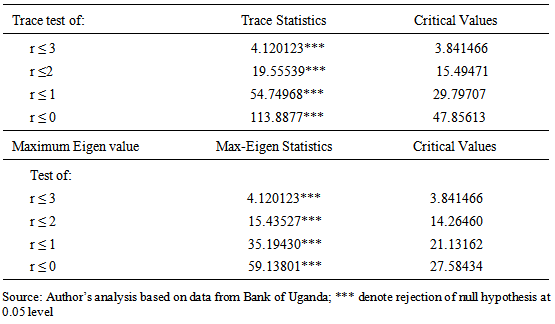
4.3. Cointegration Test on the Relationship within Endogenous Variables
The cointegration test has been carried out in this study to determine if there exists any long run relationship within variables in the model specified. The results for the cointegration test carried out in the study are presented in table 6 below. Table 6. Cointegration Test Results
 |
| |
|
The results from Unrestricted Trace Statistics (UTS) indicate four cointegrating vectors at 0.05 percent level of significance; while the results from Maximum Eigen Statistics (MES) also indicate four cointagrating vectors at 0.05 percent level of significance. Nevertheless; despite having cointegrating relationship within endogenous variables presented in this study, the structural VAR model has been selected for the study because it best explains feedback effect among set of variables.
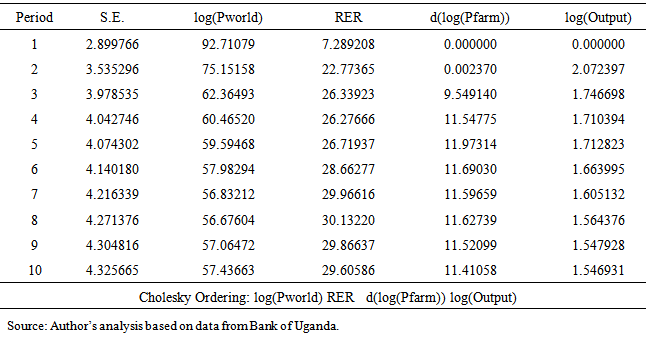
4.4. Estimates of Variance Decomposition
The variance decomposition analysis has been carried out in this study to indicate the relative importance of each endogenous variable to shocks from world cotton price. The variance decomposition of farm gate price has been carried out in this study to indicate the relative importance of farm gate price to shocks from world cotton price. The estimated results are presented in table 7 below. Table 7. Variance Decomposition of Farm Gate Price
 |
| |
|
According to estimated results presented in table 7, 47 percent of total variations in farm gate price in the period following trade liberalization are explained by itself over the whole sample period, while 35 percent of total variations in farm gate price during this period are explained by shocks from exchange rate and 17 percent of total variations in farm gate price are explained by shocks from world cotton price. Following the estimated results presented in table 7, quite a huge percentage of total variations in farm gate price in the period following trade liberalization are explained by itself throughout the whole sample period, while only 17 percent of total variations in farm gate price during this period are explained by shocks from world cotton price. The results in this table therefore indicate that there is insignificant pass through effect of world cotton price shocks to farm gate price in the period following trade liberalization. Secondly, the estimated results presented in this table indicate that the response of output to total variations in farm gate price in the period following trade liberalization is insignificant throughout the whole sample period. This performance is possible because cotton market in Uganda is not linked to futures market to the extent that whenever prices change in the world market, it would not be reflected in the local market.There is also likelihood for total variations in output in the period following trade liberalization to affect performance of farm gate price; such that a negative variation in output during this period promotes increase in farm gate price which consequently discourages lint export. A positive variation in output on the other hand, promotes decline in farm gate price which consequently encourages lint export. The variance decomposition of output with respect to other endogenous variables has been estimated in line with the above options and the estimated results are presented in table 8. Table 8. Variance Decomposition of Output
 |
| |
|
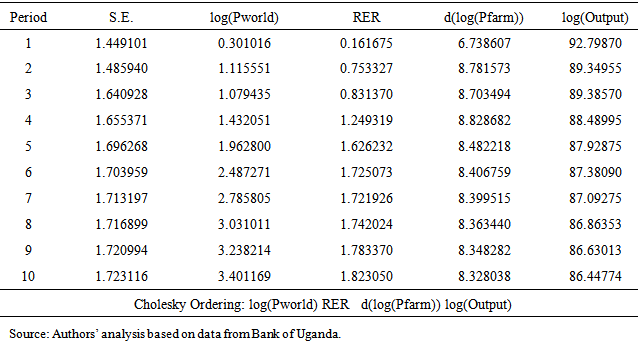
According to estimated results presented in table 8, 86 percent of total variations in output in the period following trade liberalization are explained by itself through out the whole sample period; while about 14 percent of total variations in output during this period are explained by shocks from other endogenous variables in the model. The estimated results presented in tables 7 and 8 clearly indicate that performance in farm gate price in the period following trade liberalization has never been determined by world cotton price and neither has it been determined by output but it has rather been determined by other operating factors in the economy. Such factors may include fall in domestic lint demand and consequently export resulting from world demand shocks.There is likelihood for external shocks from world cotton price in the period following trade liberalization to affect performance of real exchange rate; such that a positive shock in world cotton price during this period promotes appreciation in real exchange rate which consequently discourages lint export. A negative shock in world cotton price on the other hand, promotes depreciation in real exchange rate which consequently encourages lint export. The variance decomposition of real exchange rate has been estimated in line with the above options and the estimated results are presented in table 9. Table 9. Variance Decomposition of Real Exchange Rate
 |
| |
|
According to estimated results presented in table 9, 57 percent of total variations in real exchange rate in the period following trade liberalization are explained by shocks from world cotton price; while about 30 percent of total variations in real exchange rate during this period are explained by itself over the whole sample period and about 13 percent of total variations in real exchange rate are explained by shocks from farm gate price and output. Following the estimated results presented in tables 7 and 9, whereas over 57 percent of total variations in real exchange rate in the period following trade liberalization are explained by shocks from world cotton price, such shocks are never conveyed to farm gate price. The results in these tables therefore suggest that there exist insignificant pass through effect of world cotton price shocks to farm gate price in the period following trade liberalization.
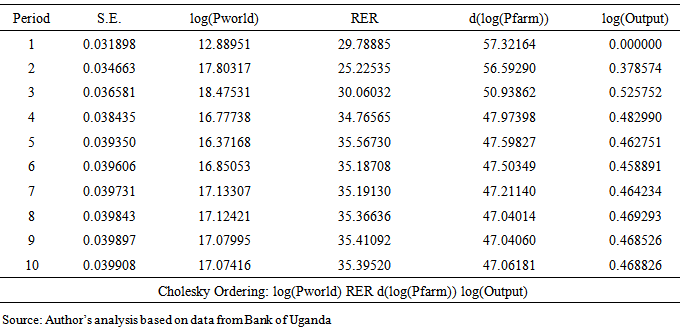
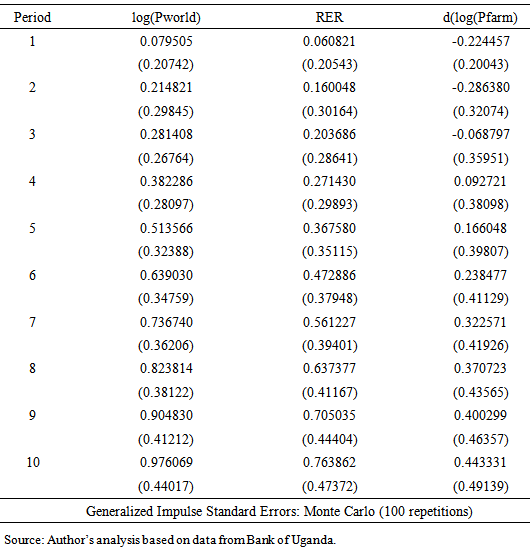
4.5. Estimates of Accumulated Impulse Responses
Table 10 below presents the results from the estimates of accumulated impulse response function of farm gate price to shocks from other endogenous variables. The responses are from contemporaneous shocks and on-word through the whole sample period. The magnitudes of shocks are in the first row, while their standard errors are in parenthesis in the second row. Table 10. Accumulated Impulse Response of Farm Gate Price
 |
| |
|
Although some significant responses are observed in farm gate price due to shocks from world cotton price and real exchange rate, such responses are never conveyed throughout the whole sample period. The estimated responses do not exceed the two standard error criteria of significance in the 7th to the 10th period for world cotton price and in the 6th to the 10th period for real exchange rate; thus indicating insignificant price pass through effect within the cotton industry during this period. An assumption has been made in this study that internal shocks on output in the period following trade liberalization affect performance of farm gate price; such that a positive shock on output encourages decline in farm gate price which consequently promotes lint export. A negative shock on output on the other hand, encourages increase in farm gate price which consequently discourages lint export. The accumulated impulse response function of output with respect to other endogenous variables has been estimated in line with the above options and the estimated results are presented in table 11. Table 11. Accumulated Impulse Response of Output
 |
| |
|
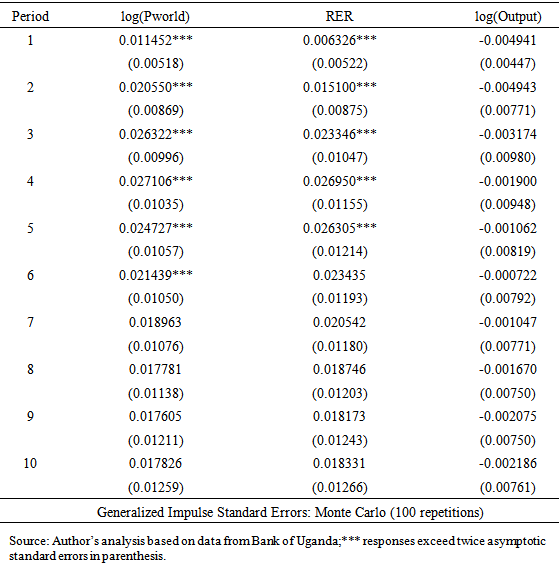
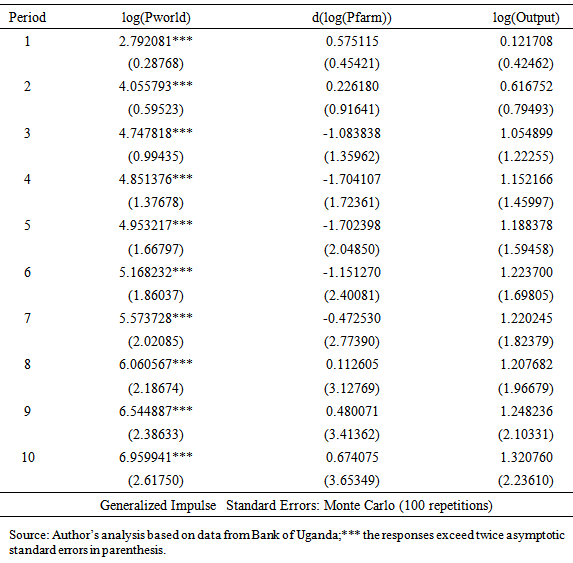
According to estimated results presented in table 11, there exist insignificant responses from output due to shocks from other endogenous variables. The estimated responses do not exceed the two standard error criteria of significance throughout the whole sample period. The estimated responses in this table therefore indicate that the response of output to total variations in farm gate price in the period following trade liberalization is insignificant. In view of the estimated results presented in tables 10 and 11, performance in farm gate price in the period following trade liberalization has never been determined by output and neither has it been determined by world cotton price, it has rather been determined by other operating factors in the economy. Such factors may include fall in domestic lint demand and consequently export resulting from world demand shocks.It is also possible for external shocks from world cotton price in the period following trade liberalization to affect performance of real exchange rate; such that a positive shock from world cotton price during this period stimulates appreciation in real exchange rate which consequently discourages lint export. A negative shock from world cotton price on the other hand, stimulates depreciation in real exchange rate which consequently encourages lint export. The accumulated impulse response function of real exchange rate to shocks from other endogenous variables has been estimated in line with the above options and the estimated results are presented in table 12.Table 12. Accumulated Impulse Response of Real Exchange Rate
 |
| |
|
According to estimated results presented in table 12, there exist significant responses from real exchange rate due to shocks from world cotton price. The estimated responses exceed the two standard error criteria of significance throughout the whole sample period. Shocks from farm gate price and output during this period however, inspired insignificant responses from real exchange rate throughout the whole sample period. Following the estimated results presented in tables 10 and 12, whereas the responses from real exchange rate in the period following trade liberalization are determined by shocks from world cotton price; such shocks however, are never conveyed to farm gate price.
5. Concluding Remarks
The results from the estimates of variance decomposition and accumulated impulse responses in this study are consistent with each others. The above results indicate that there exist insignificant pass through effect of world cotton price shocks to farm gate price in the period following trade liberalization. Although some significant responses are observed in real exchange rate due to shocks from world cotton price; such responses are never conveyed to farm gate price. Secondly, the results in this study further indicate that performance in farm gate price in the period following trade liberalization has never been determined by output and neither has it been determined by world cotton price, it has rather been determined by other operating factors in the economy. Such factors may include fall in domestic lint demand and consequently export resulting from world demand shocks.
6. Policy Implication
Favorable structures should be put in place to encourage functioning of futures market so that whenever prices change in the world market it would be reflected in the local market. Owing to its competitive nature, futures market has become important economic tool to determine prices based on today’s amount of supply and demand and tomorrow’s estimated supply and demand (Oxford futures, 2011). This therefore implies that futures market helps to secure selling prices in the case where there is an adverse condition in the world market.
Note
1. The economics and structural reforms of 1990s refer to Trade Liberalization Policy introduced to Developing Countries during the 1990s.
References
| [1] | Ashfaq M., Sheikh A.D. and Akmal N., (2010). Impact of Trade Liberalization on Agriculture in Pakistan. Journal of Agriculture 2010 48(10). |
| [2] | Baffes J., (2002).Tanzania’s cotton sector’s constraint and challenges in a Global Environment Published by World Bank ABNB000654VCY. |
| [3] | Bakunda G., (2005). Impact of Trade liberalization on the Uganda’s Economy. Kampala Uganda. DENIVA-Development Network of Indigenous Development Association. |
| [4] | Balassa B., (1983). Trade Policy in Mexico, World Development Report, 11 (9); 795-811. |
| [5] | Blake A., McKay A. and Morrissey O., (2001). The impact on Uganda of Agricultural Trade Liberalization. A journal of Agricultural Economics Vol. 53 issue 2 of 2002. |
| [6] | CDO, (1995). The Cotton Development Organization (CDO), Quarterly Report Volume 1of 1994/95), available at httwww.cdouga.org. |
| [7] | Collinson C.D., Kleih U., Burnett D.G., (2002). Transaction Cost Analysis, Final Report prepared for Plan for Modernization of Agriculture. Published by the Natural Resource Institute. |
| [8] | Greenaway D., Wyn M. and Wright P., (2002). Trade Liberalization and Growth in Developing Countries. Journal of Development Economics Volume 67(2002) pages 229 to 244. |
| [9] | Ito T. and Sato K., (2007). Exchange rate Changes pass through and domestic inflation: A comparison between East Asia and Latin American Countries Research Institute of Economy, Trade and Industry Discussion Paper Series 07-E-040 http://www.rieti.go.jp/en. |
| [10] | Johansen S., (1988). Statistical Analysis of Cointegration Vectors, Journal of Economic Dynamics and control, Vol. 1, No. 2-3,pp 231-254. |
| [11] | Kihangire D. and Apaa O., (2007). Agricultural and supply response in Uganda: An examination of aggregate, Traditional and Non Traditional Export Crops. Bank of Uganda Working Paper /07/08. |
| [12] | Kumah F. Y. and Matovu J. M., (2005). Commodity Price Shocks and the Odds on the Fiscal performance: A Structural VAR Approach. IMF Working Paper 05/171. |
| [13] | Mold A. and Pizzon A., (2008). Explaining Africa’s Recent Export Performance and Limited Gains from the Commodity Boom. |
| [14] | Oxford Futures, (2011). Available athttp://www.oxfordfuture.com. |
| [15] | Santos-Paulino A. and Thirlwall A.P., (2004). Trade Liberalization and Economics Performance in Developing Countries, Economic Journal, 114, February, F.50-F.72 © Royal Economic society2004. Published by Blackwell Publishing, 9600 Garsington Road, Oxford OX42DQ UK and 350 Main Street Malden MA02148. |
| [16] | Schmidt J. R., Rejda G. E. and Kyung W. L., (1999). International Economic Journal, Vol. 13 No. 3(1999). |
| [17] | Siok K. S. and Zhanna K., (2008). Pass through of Exchange Rate into Domestic Prices: the case of Four East Asian Countries. MPRA papers 11/30-University of Munich Germany. |
| [18] | Ssemogerere G.N. and Kasekende L.A., (1994). Constraint to Development and Diversification of nontraditional exports in Uganda, 1981–1990. African Economic Research Consortium. pp 47-48. |
| [19] | Thirlwall A. P., (2004). Trade, the Balance of Payments and Exchange Rate Policy in Developing Countries, 26th May. Edward Elgar Pub. ISBN 10 1843768488/1-84376-848-8. Available at: www.e-elgar.co.uk /book entry main. lasso? id=2957. |
 Abstract
 Reference
 Full-Text PDF
 Full-text HTML