-
Paper Information
- Paper Submission
-
Journal Information
- About This Journal
- Editorial Board
- Current Issue
- Archive
- Author Guidelines
- Contact Us
American Journal of Economics
p-ISSN: 2166-4951 e-ISSN: 2166-496X
2014; 4(3): 150-158
doi:10.5923/j.economics.20140403.03
Concentration in Southeast Asia Banking
 Abstract
 Reference
 Full-Text PDF
 Full-text HTML
Shazida Jan Mohd Khan
School of Economics, Finance and Banking, College of Business, Universiti Utara Malaysia, Sintok, Malaysia
Correspondence to: Shazida Jan Mohd Khan, School of Economics, Finance and Banking, College of Business, Universiti Utara Malaysia, Sintok, Malaysia.
| Email: |  |
Copyright © 2014 Scientific & Academic Publishing. All Rights Reserved.
This paper will contribute to the structure and performance literature that involved research on the performance of Southeast Asia (SEA) banks after experiencing the financial crisis in mid-1997. In line with recent development in market structure research and literature, it expanded the analysis of concentration by investigating the structure performance consequence during the post Asian financial crisis period, 1999 to 2005 focusing on six countries that most effected by Asian financial crisis, Indonesia, Korea, Malaysia, Philippines and Thailand. This study looks into the concentration ratio by employing two most common measures; thek-bank concentration ratios and Herfindahl-Hirschman Index (HHI), extended the analysis to test the Efficient Structure (ES) hypothesis. Our findings reject the traditional Structure Conduct Performance (SCP) paradigm in Southeast Asia banking.
Keywords: 1997 Financial Crisis, Bank Concentration, Efficiency Structure Hypothesis
Cite this paper: Shazida Jan Mohd Khan, Concentration in Southeast Asia Banking, American Journal of Economics, Vol. 4 No. 3, 2014, pp. 150-158. doi: 10.5923/j.economics.20140403.03.
Article Outline
1. Introduction
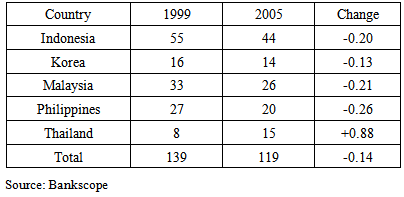
- The banking industries in the South East Asian region exhibit similarities in market openness, regulatory stance, extent of government intervention, lending policies and the influence of macroeconomic policy. Some of this shared similarity became vulnerabilities that caused a systemic crisis in 1997 which decidedly undermined the solvency of this region banking systems [1, 2]. Since the crisis, the banking sector in Asian has undergone dramatic and vast changes over the past 13 years since experiencing the financial crisis in mid-July 1997. Significant changes can be seen in the banking industry through banking operational transformation, the number of banks operating and branches, technology development, their embankment in institutional structure of banking industry and the quality of human resources [2]. These changes are important in assuring the achievement of efficiency needed and to foster improvement in the degree of productivity as to fulfil the necessity for the development of the sector. The Asian financial reforms were to improve the performance of banking sector through enhancing competitiveness and efficiency. Structural changes were aimed to better competition, anticipating productivity and efficiency improvement in banks. Through the financial transformation, the number of banks from 139 banks in 1997 has reduced by 14 per cent to 119 banks in 2005 (see Table 1). This broad decline in the number of banks operated in the selected SEA country is due to bank consolidation and reflects the impact of mergers and closures of smaller and failing banks. For example, the immediate task of crisis resolution in Korea and Malaysia led to reforms the banking sector where consolidation plays a central role. Following these steps is Thailand and the Philippines but at a slower phase where the combination program between the government and the IMF has left the resolution to market forces. In the Indonesia 68 banks were closed, 33 were nationalised, 27 banks were re-capitalized, 4 state-owned banks were merged into one new state-owned bank and several private banks were also merged [3]. However, the reduction in the number of banks does not directly translate into an increase or decrease in concentration [4].
|
1.1. Structure-Conduct-Performance (SCP)
- Previous literature has concentrated in two most competing approaches in analysing the performance of the banking market, structural and non-structural approaches. Structural approaches are based on the traditional industrial organisation (IO) theory which focuses on the structure-conduct-performance (SCP) paradigm and on the Efficient Structure (ES) paradigm. The traditional industrial organisation (IO) approach proposes structural tests to assess banking competition based on the Structural-Conduct- Performance (SCP) model suggested by [5, 6]. Since then, there are two main researches strand that been used in literature of market power: the ‘structural approach’ and the ‘efficiency approach’. The prominent tool in structural approach to access the behaviour of the banking market structure is the structure-conduct-performance (SCP) paradigm. The SCP paradigm advocates that market concentration foster collusion among large firms which create larger profits. According to SCP hypothesis, there is a direct link between market concentration and the degree of competition where a higher market concentration allows banks to exploit their market power by earning higher profits. In many previous studies, a statistically significant positive relationship has been found between market share and bank profitability, while a positive relationship between market concentration and bank performance has not been established. The SCP paradigm argues that concentration is said to have lowered the competition by fostering collusive behaviour among large banks in the market [7]. The argument also contend that bigger concentration market will lead to higher loan rates and decreased deposits rate because of lessened in competition which leads to greater profitability (meaning lower performance in terms of social welfare). Analysis of SCP relationship in banking is often used as a way to evaluate the main policy issue of which type of banking structure best serves the public in terms of both cost and the availability of banking services. In general two main objectives have been sought; firstly, the attainment of an efficient banking system which in some way, secondly, minimises the likelihood of bank failure [8]. The empirical analysis of the SCP hypothesis is tested by regressing banks’ performance on a measure of concentration (such as a k-bank concentration ratio or a Herfindahl-Hirschman Index, HHI) and by further controlling for some other explanatory variables. The theoretical underpinning of this model is commonly known as the collusion hypothesis which goes back to works of [5] [6] which applied to manufacturing sectors. The same model then introduced into the banking industry following [9] and has been used widely for empirical tests on the impact of market concentration on profitability.
1.2. Efficient Structure (ES) Hypothesis
- A challenge to the SCP hypothesis interpretation is the efficient structure (ES) hypothesis [10] and it’s explained the relationship between bank performances and concentration in terms of efficiency. The efficient structure (ES) hypothesis emerges from the criticism of the SCP [11, 12]. The efficient structure (ES) hypothesis argues that some firms earned higher profits because they are efficient. The ES suggested that some banks may be more efficient than others, earning higher profits and may lead to higher market share which thereby make the market more concentrated, this would show that concentrations leads to higher profits, while in fact both are caused by higher efficiency [13-15]. Thus, under ES hypothesis, the degree of concentration is not considered a reflection of collusive behaviour of banks, but rather a consequence of the superior efficiency of banks firms [16]. The ES hypothesis is usually discussed in two forms, the X-efficiency and the scale-efficiency hypothesis. In the X-efficiency hypothesis more efficient bank has lower costs, higher profits and larger market share, because they are able to minimise costs to produce any given outputs. In the scale-efficiency hypothesis, some banks achieve better scale of operation and thus lower costs, higher profits due to the fact that more scale efficient firms produce closer to the minimum average-cost profit.Berger [17] asserts the need to include measures of estimated productive efficiency in the market power models of bank performance and distinguished between X-efficiency and scale-efficiency hypothesis. Berger [17] tested competing hypothesis (SCP, relative market power hypothesis (RMP), X-efficiencies (ESX) andscale-efficiencies (ESS)) in the US banking and found the only positive and significant related to profit are the market share and X-efficiency. Several other studies found to be similar to Berger [17] such as Goddard et al. [18], who point out the concern of these models to explain variations in bank performances which also favouring SCP, ESX and ESS hypothesis involving 15 European countries over the period of 1989 to 1996. If market share is the main factor that represents efficiency then market share and profitability may be correlated but there will be no causal relationship between concentration and profitability, since both been driven by efficiency through market share.
2. Literature Review
- Although there are many past literatures can be found on the performances and market structure, there was very limited number of studies that have look into the market structure of the developing countries especially after the financial crisis in 1997. Most literature are focusing on banking industry in developed country (such as [19-21]) and left the study on developing countries either by country specific and cross country study at scarce. Among few found on developing countries are [22]. This paper investigates the effects of competition on bank risk-taking behaviour in four South East Asian countries (Indonesia, Malaysia, Philippines and Vietnam). The main finding is that competition does not increase bank risk-taking behaviour and the results appear robust to different model specifications, estimation approaches and variable construction. Interestingly their finding also state that concentration is inversely related to bank risk whereas regulatory restrictions positively influence bank risk-taking. [23], who analysed the relationship between market structure and bank performance in the GCC banking industry over the periods of 1993-2002. [16] studies the market structure concentration and performance on six of Arab countries that involved in Gulf Cooperation Council (GCC). [24] utilized prices as measures of performance in Malaysia conventional banks while [25, 26] focused on the profitability of Islamic banks in Malaysia. [27] analyzed the determinants of commercials bank profitability in Malaysia followed by [28] who tested the validity of the SCP framework in the Malaysian banking market and ES hypothesis using robust estimation approach. [29] focusing on the relationship between market structure and performance in China’s banking system from 1985 to 2002. Using panel data estimation techniques, both the market-power and efficient-structure hypotheses are tested. [30] identify the major determinants of profitability in the Korean banking sector for the period of 1992–2002 by testing the market structure hypothesis against the efficient structure hypothesis. The results indicate that bank efficiency has a significant effect on bank profitability and support the efficient structure hypothesis on banks in Korea. Among cross country study found studies by [4, 7, 31] on Latin America. This paper contributes to the structure and performance literature on the performance of SEA banks after experiencing the financial crisis in mid-1997. The analysis will concentrate on six SEA countries: Indonesia, Korea, Malaysia, Philippines and Thailand, within the recovery period of 1999 to 2005. The main objective is to test structure-conduct-performance (SCP) hypothesis and efficient structure (ES) hypothesis.
3. Methodology
- This study looks into the concentration ratio by employing two most common measures; the k-bank concentration ratios and Herfindahl-Hirschman Index (HHI). Simplicity and limited data requirement make the k-concentration ration one of the most frequently used measures of concentration in the empirical literature. Summing only over the market share of the k largest banks in the market, it takes the form:
 | (1) |
 | (2) |
 , where n is the number of banks in the banking industry. The maximum of concentration of unity occurs in the case of monopoly. Minimum concentration of
  occurs in the case where bank has equal share of
  . In the empirical analysis, the following equation is estimated in order to empirically test the market power:
 | (3) |
3.1. Market Structure-Performance and Efficiency
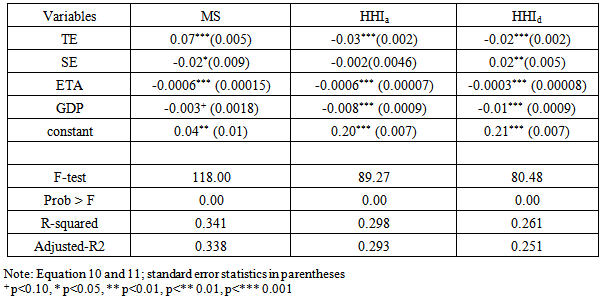
- We estimated the Equation 3 again using both fixed effect (FE) and random effects (RE). The results obtained from fixed and random effect are quite similar (see Table 6). Efficient structure (ES) hypothesis states that cost advantage enjoyed by efficient firms leads them to have a higher profit than inefficient firms. Efficient firms pass cost advantages to their customers through adjusting prices which lead to have a higher market share [32]. Therefore, it is expected to have following signs for estimated coefficient of equation (2) if ES holds: TE>0, SE>0, CON=0 and MS=0.Hence, the following functional form is estimated:
 | (4) |
 | (5) |
3.2. Data and Descriptive Analysis
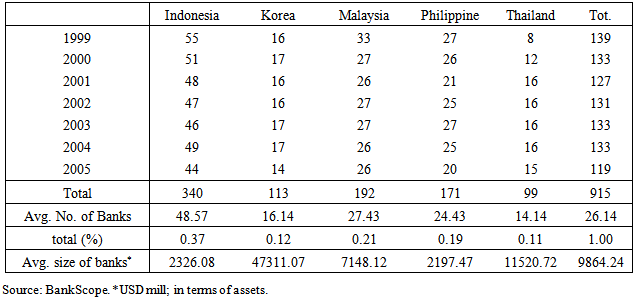
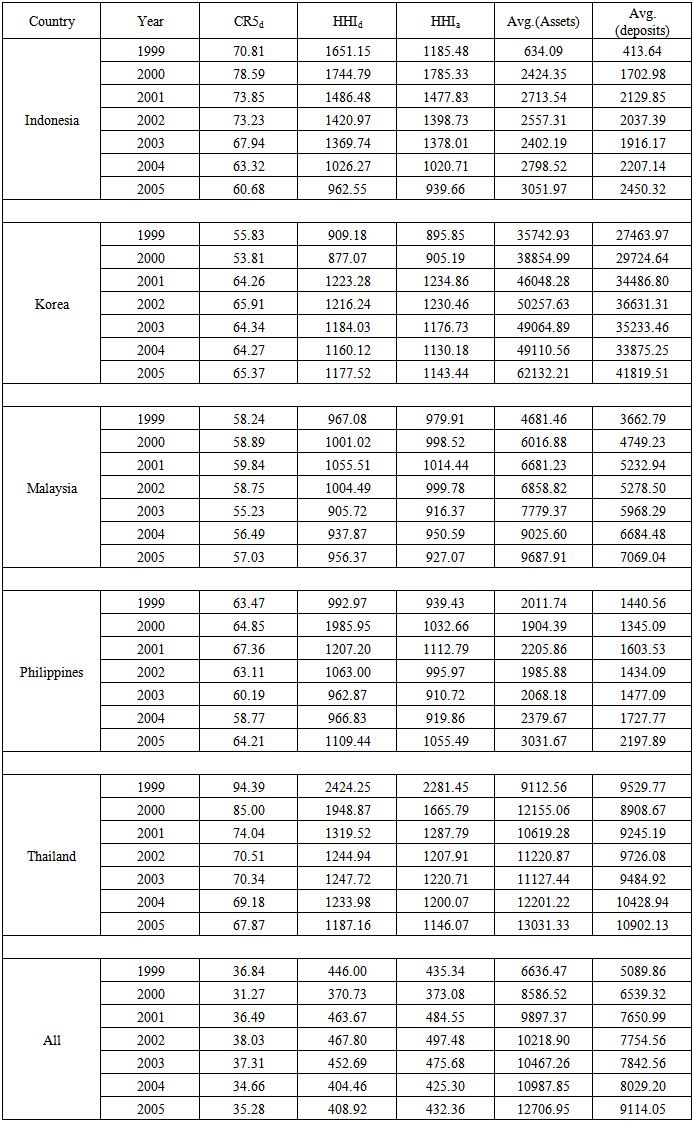
- The data from 1999 until 2005 is taken from BankScope database maintained by FitchIBCA Bureau Van Dijk. The observations consist of 915 commercial banks in Indonesia, Korea, Malaysia, the Philippines and Thailand. Table 2 reports the observations used in the study. The statistics shows that Indonesia remains as a country that owned the biggest number of commercial banks followed by Malaysia, Philippines, Korea, and Thailand. The structure of each banking industry has changed due to the implementation of new regulation and government interventions in order to maintain and protected the banking industry after the financial crisis in 1997. Korea holds the largest share of assets which presenting the average size of banks operating in the country, followed by Thailand and Malaysia.
|
|
4. Analysis and Results
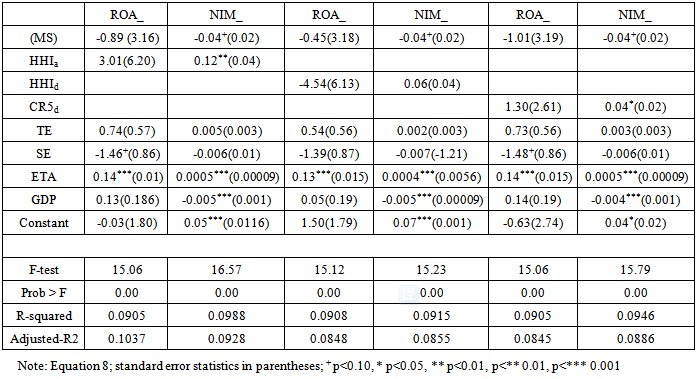
- The dynamic developments in banking sector were expected to have had a major impact on market concentration especially with changes of the structure in this region prior to the 1997 financial crisis. However the results (see Table 6) seem not to agree and suggest that the restructuring with the period of study did not show much change to the overall framework for most of the effected country.In Korea, the active role in the consolidation process has reduced the number of bank to 16 in 1999 compared to 27 banks before the crisis. Consolidation has given substantial impact on the employments cut and accompanied by major downsizing in banking industries. This resulted HHId to increase to 1177 in 2005 (909 in 1999) and HHIa to 1143 in 2005 from 895 in 1999. The increase in concentration is reflected in the increase of the share of total deposits and total assets held by five (5) largest banks in each market. Malaysia and Thailand shows almost similar trend of changes even though both country have differences in their recovery program. Thailand accepted the recovery package by IMF while Malaysia agreed with their capital control policy. Even though both country has increase throughout the period of study, their concentration ratio still very low. Philippines seem to be able to maintain their market and this may due to their consistent and continuous IMF support program. Indonesia banking systems still embeds a lot of risks and is not very competitive. These finding suggests that the banking industry still has enough room for more mergers and consolidation without necessarily inhibiting effective competition.The overall results give the indication that the selected countries concentration ratio falls on aggregate in the period of study, 1999-2005. The HHId and HHIa stands at 408 and 432 compared to 446 and 435 in 1999. The results shows that the mergers and acquisitions may have reduce the number of banks but did not increase the overall concentration. Most of the selected countries experiencing increasing concentration level at their first few years of the restructuring (1999-2002) and starting to fall in most of their second phase of the restructuring process (2002-2005), with exceptions to Korea and the Philippines. The results reflect the consolidation program that has only recently begun and yet to be completed. The banking industry has mostly been driven by stronger banks being forced to absorb weaker ones to ensure continuity in stability, facing the possibility for shareholders deciding to exit the market, and by mergers of the parent companies of foreign banks present in the region [4].Overall, the effects of recent changes in the structure of banking systems on market structure are unclear. Following the argument by non-structural approach, there are other than market structure and concentration may affect competition behaviour such as entry/exit and the general contestability of the market [31]. In the empirical analysis (Table 5, equation 2), the results from OLS estimations reveal a weak evidence of a negative relationship between market share (MS) and profitability (ROA and NIM). Both reports a negative relationship and only significant under NIM as dependent variables. These results explain the condition where firms/banks with higher market share gained higher profit with lowering interest margin [34] argued that firms with efficient cost structures can increase their market share (MS) by charging a lower prices, which explain the expected negative relationship between MS and interest margin (NIM). The negative and significant MS describe the lack of bank governance and cost reduction policies as the market grown in terms of capitalisation through mergers and acquisitions. The results where ROA and NIM were positively correlated with market concentration and negatively correlated with market share interprets that this finding is in favour of the SCP.
|
|
|
|
5. Conclusions
- This paper carried out the study of market structure, performance and efficiency in Asian region after the financial crisis, 1999 to 2005. The banking sector in Southeast Asia (SEA) has experienced substantial changes during the past decade, especially after the 1997 financial crisis. One of the most relevant changes was the transformation in the banking industry where each country implemented the merger and acquisition program which has reduced the numbers of banks operated in the region. Our results seem to reject to the traditional SCP paradigm in SEA banking prior to the 1997 financial crisis. The result is consistent with [7, 16, 32]. Furthermore, the analyses do not find evidence that concentration and market share are associated with NIM, while TE found do not related with both ROA and NIM.