Md. Shafiul Alam, Golam Mohiuddin, Md. Iftekhar Arif
Institute of Education, Research & Training (IERT), University of Chittagong, Chittagong, 4331, Bangladesh
Correspondence to: Md. Shafiul Alam, Institute of Education, Research & Training (IERT), University of Chittagong, Chittagong, 4331, Bangladesh.
| Email: |  |
Copyright © 2014 Scientific & Academic Publishing. All Rights Reserved.
Abstract
The Crude Quantity Theory of Money is a very important and relevant theory of the classical economists which explains the relationship between money supply and price level. The proponents of this theory have divided an economy into two sectors (i.e. real and monetary) by applying this theory. The prime message of this theory is that money supply will change price level proportionately especially in the short run. They explain it by assuming constancy of real output (Q) and Velocity of circulation (V). In this paper the researchers have tried to explain the position of Q and V in the short and long run in the economy of Bangladesh. The authors have also tried to explain why Q and V change in the economy of Bangladesh. For this reason, they have used time series data of macro variables related to the Crude Quantity Theory of Money. They suggest framing a new version of Quantity Theory of Money to explain the relationship between money supply and price level properly.
Keywords:
Real GDP, Nominal GDP, Money Supply, Velocity of Money, Inflation
Cite this paper: Md. Shafiul Alam, Golam Mohiuddin, Md. Iftekhar Arif, Crude Quantity Theory of Money: A Case of Bangladesh Economy, American Journal of Economics, Vol. 4 No. 3, 2014, pp. 137-143. doi: 10.5923/j.economics.20140403.01.
1. Background
The classical Economist of the 18th century, such as David Hume and Adam Smith, proposed a theory to explain the relationship between money Supply and price level (Ruffin, 1938). This theory was taken up by the great American economist, Irving Fisher of Yale University (1867–1947) and by the great English economist Alfred Marshall (1842-1924) and has come to be called the Crude Quantity Theory of Money or simply the Quantity Theory of Money (Ruffin,1938). The Quantity Theory is antecedent to important modern Macroeconomic theories. It is especially useful because it provides a powerful though simplified view of how the macro economy or an economy works (Ruffin, 1938). The basic message of the Crude Quantity Theory of Money is that the price level is strictly proportional to the money supply (Ruffin, 1938). In other words, the Crude Quantity Theory taught that an x percent increase in money supply will lead to an x percent increase in the price level (Mankiw N.G, 1012). The quantity theorists believed the size of the real GDP is fixed in the short run by the size and productivity of the resources of the country (Mankiw N.G, 1012). The real output of the economy is fixed because resources, particularly the most important resource, labor, will tend to be fully employed Ruffin, 1938). Over time, as the labor force expands and technology improves real output will rise. But in the short run, real output is for all practical purpose fixed by the resource base and technology of the economy (Ruffin, 1938). To understand this theory, it is essential to know the velocity of circulation. The velocity of money means how many times a unit of money would move to purchase final goods and services in one year’s time. It can be compared through an example. Let us think the value of Nominal Gross Domestic Product (NGDP) of Bangladesh in the year 2009-2010 is 6943.24 billion taka and the money supply (M2) is 3630.31billion taka in the same year. So, the velocity of money (V) is: V = NGDP / M2 = 1.91 times. So, we can say that the velocity of circulation is the ratio of nominal GDP to the money supply. Considering it, we can write the equation of the velocity of money circulation in the following manner:  | (1) |
Here, V = Velocity of money circulation,GDP = Nominal Gross Domestic Product and M = Money supply (M2). If we multiply both sides of the equation (1) by M, the equation becomes | (2) |
Here, P = price level and Q = GDP. This equation is known as the equation of exchange. But this equation does not entirely proof that money supply and the price level will rise at the same rate. To hold the proportional relationship between money supply and price level, there must be an assumption that Q and V will be constant. If Q and V remain constant then the relationship between money supply and price level will be proportional, that is if M increase x percent then p will increase x percent. These assumptions turn the equation of exchange into a theory. A glance at the equation of exchange shows that if both Q and V are fixed then P will be proportional to M. The equation of exchange, rewritten to solve P, is | (3) |
If V and Q are constant then an x percent increase in M will cause an x percent increase in P. The Quantity Theory concludes that P is strictly proportional to M, or in other words that inflation is strictly a monetary phenomenon. From the empirical evidence it is found that in the American economy from 1915 to 1980 the real GDP rose to 8 times its size, while the money supply (M1) increased to nearly 33 times its size (Ruffin, 1938). This information tells that the growth in the supply of money far outstripped the growth of the real GNP. Another picture is also found from the following table. From table-1 it is found that the 5 Latin American Countries and the USA during the period 1963 to 1976 show a remarkable relationship between the rate of growth in the money supply and the rate of inflation. From this table we can say that countries that experienced the most rapid growth rate of money supply also had the highest rate of inflation (Ruffin:1938). Table 1. Money and Inflation, United States and Latin American Countries, 1963-1976
 |
| |
|
But from our observation we can say that the assumption of constancy of Q and V are not absolutely and normally proper. Because in course of time and in the short run Q will be increased though M also increases; at the same time, V more or less will remain stable but the value of V gradually falls if money supply increases. To find out the value of P,Q, M and V and to explain the relationship between money supply and price level the researchers take a sample from the Asian countries, Bangladesh. It is situated in the South Asian region. The country is small in size but large in the sense of its population size. The country achieved independence in 1971 by defeating the occupied Pakistani Army. The socio-economic infrastructures were destroyed completely during the liberation war. Post independence efforts to recover economy failed due to local and international conspiracy. Mr. Henry Kissinger then compared Bangladesh to a bottomless basket at that time. But the cruel comment of the Minister is now a myth only. Because the development process of the country is going on in full swing. Presently some socio-economic indexes are much better than those in other South Asian or Asian countries.
2. Objectives of the Study
The Prime objective of this study is to explain the crude quantity theory of money with the variables of the Bangladesh economy. In this regard the relevant objectives are as: 1) to find out the value of M2; 2) to find out the value of Q; 3) to find out the value of V;4) to find out the value of P and finally; and5) to explain the relationship between money supply and the price level with reference to crude quantity theory of money and Bangladesh economy.
3. Methodology of the Study
This study is based basically on two methods. Firstly, the existing available reports and documents have been critically analyzed. Secondly, the researchers have collected and used secondary data. For secondary data the researchers depended on the Bangladesh Economic Review 2010, 2012 which is published by the Economic Adviser’s Wing, Finance Division, Ministry of Finance, Bangladesh Government (www.mof.gov.bd) and Monthly Economic Trends, Excel file from 1972 to recent time, time series data since 1972, Statistics Department, Bangladesh Bank (www. bangladesh-bank.org). The issues dealt with in this study are no doubt of current and vital interest. So, the study will surely help all those who are concerned with the issues discussed in this paper.
4. Findings and Results
4.1. The Position of the Money Supply (M2) of Bangladesh Economy
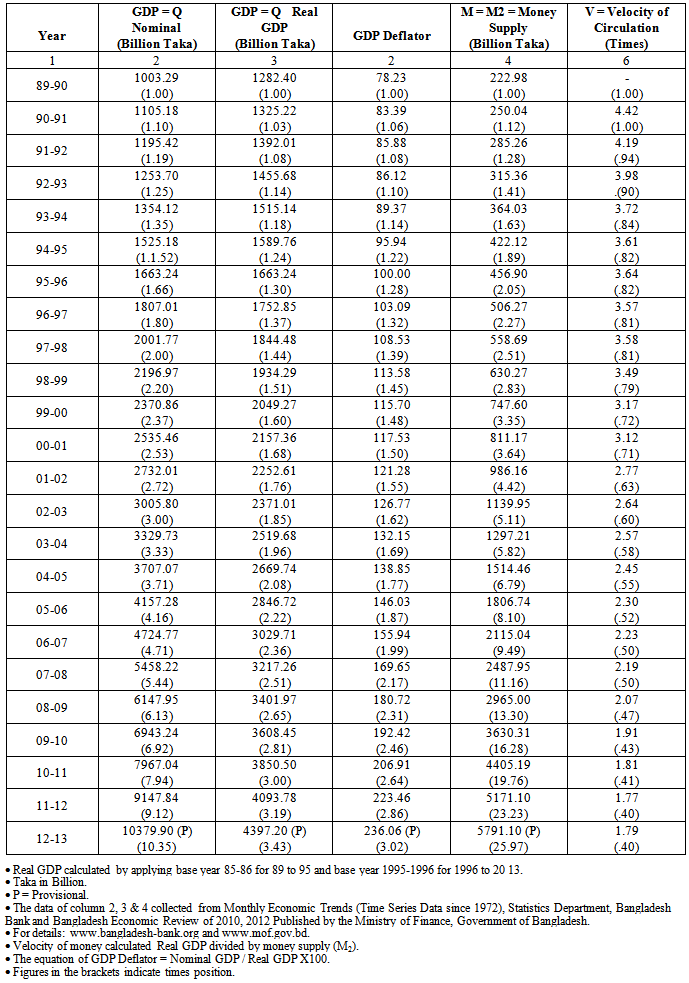
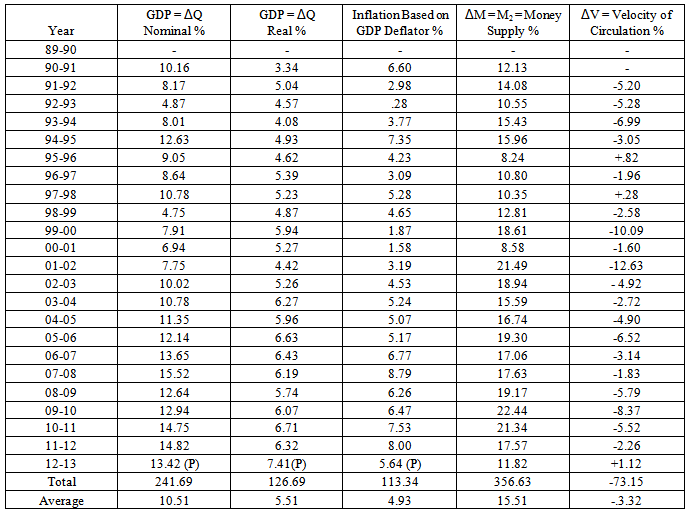
Tables 2 & 3 show the total position and growth rate of money supply (M) over the period of 1989-2013. In the above stated period money supply rose from 222.98 billion taka to 5791.10 billion taka. From table -1 it is clear that the money supply has been sharply increasing from year to year in the Bangladesh economy. From the figures in the parentheses of the same table, it is found that the money supply M2 increased 25.97 times from the 1989-90 fiscal year to 2012-13 fiscal years. If we show the position of money supply by percentage, we will see that the money supply increased 356.63 percent during the said period. The average growth rate of money supply is 15.15 percent only (Table 3). One can easily understand it further by observing the figures 1 & 2.Table 2. Year Wise Distribution of Nominal GDP, Real GDP, GDP Deflator, Money Supply and Velocity of Circulation of 1989-2013, in Bangladesh According to Totality and Times
 |
| |
|
Table 3. Year Wise Distribution of Nominal GDP, Real GDP, GDP Deflator, Money Supply and Velocity of Circulation of 1989-2013, in Bangladesh According to Percentage
 |
| |
|
 | Figure 1. Total Growth of the Bangladesh Money Supply, Price Level, Real GDP, Nominal GDP, 1989-2013, According to Times |
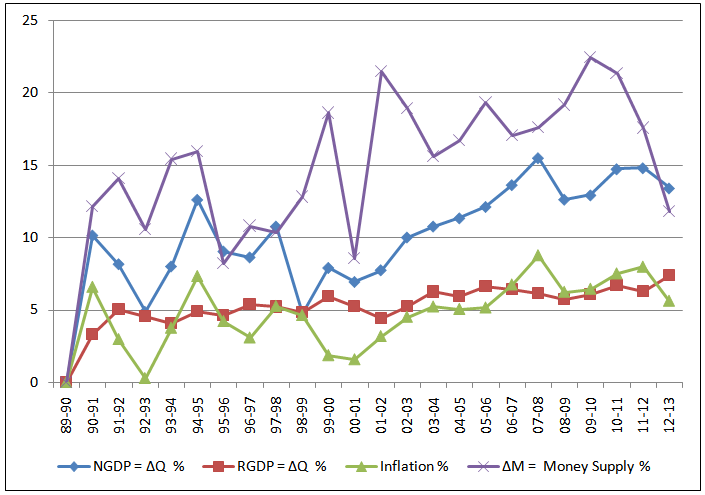 | Figure 2. Total Growth of the Bangladesh Money Supply, Price Level, Real GDP, Nominal GDP, 1989-2013, According to percent |
4.2. The Situation of GPD Deflator and Inflation (P) of Bangladesh Economy
Table -2 shows the real picture of the GDP deflator and inflation rate of the Bangladesh economy over the stated period. In 1989 the value of the GDP deflator counted as base year 1995-96 was 78.23 but this value is now (2012-13) 236.06. It indicates 3.01 times of increase of GDP deflator in the stated period. From table -3, it is found that the country bears a moderate inflation over the period of 1989-2013. The cumulative inflation rate of this country is 113.34 % over the stated period. The average inflation rate of this country is 4.93% though inflation fluctuated from year to year. By observing the data of the table one can say that the inflation rate in Bangladesh is more stable than that of other countries.
4.3. The Condition of the Nominal GDP (Q) of Bangladesh Economy
From table-2, it is found that the nominal GDP is increasing year to year in Bangladesh. In the year 1989-90, the nominal GDP was 1003.29 billion taka but in the year 2012-2013 it is 10379.90 billion taka. The nominal GDP of Bangladesh rose 10.35 times over the period of 1989-2013. From table -3 it is also found that the cumulative growth rate of the nominal GDP is 241.69% and average growth rate is 10.51% over the stated period.
4.4. The Extent of Real GDP (Q) of Bangladesh Economy
The changing picture of real GDP is different from that of nominal GDP but the real GDP changes at a very moderate rate. In the year 1989-90, the value of the real GDP was 1282.40 billion taka and it stood at 4397.20 billion taka in the year 2012-2013. The total growth of the real GDP is 3.43 times from the initial year of this study. The total growth rate of real GDP in terms of percentage is 126.69% and average growth rate of real GDP has been only 5.51% from the year 1989 to 2013.
4.5. The Extent of Velocity of Money (V) of Bangladesh Economy
Velocity of money means the speed of the money circulation. This variable is very important to explain the crude quantity theory of money. Now we will try to narrate the position of the velocity of money in Bangladesh economy. In 1989-90, the value of velocity of money was 4.42 times but in 2012-13 its value was only 1.79 times. It means this value gradually decreased. The velocity of money falls .40 times during the period 1989-2013. The cumulative falling rate of velocity of money is -73.15 % and the average falling rate is -3.32%. The minus sign of V does not mean the value of V is really negative, but it shows the decrease in the value from the initial value. The total findings of the Bangladesh Economy’s macro variables, especially Money Supply, Price Level, Nominal GDP, Real GDP and Velocity of Circulation are shown in Tables 1 and 2, in the figures 1 and 2 and Charts 1, 2 and 3.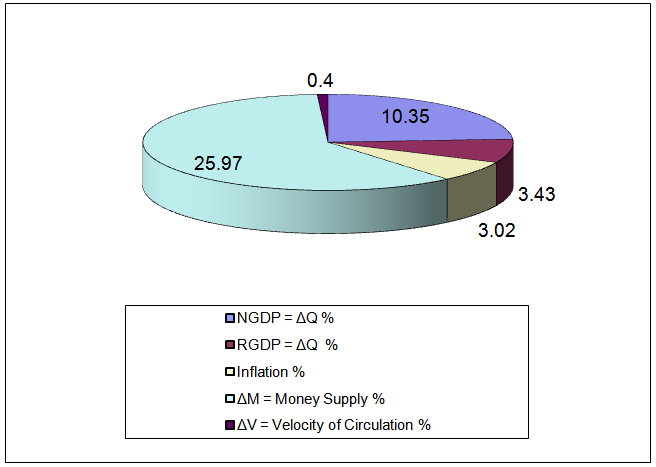 | Chart 1. Total Growth of the Bangladesh Money Supply, Price Level, Real GDP, Nominal GDP, 1989-2013, According to Times |
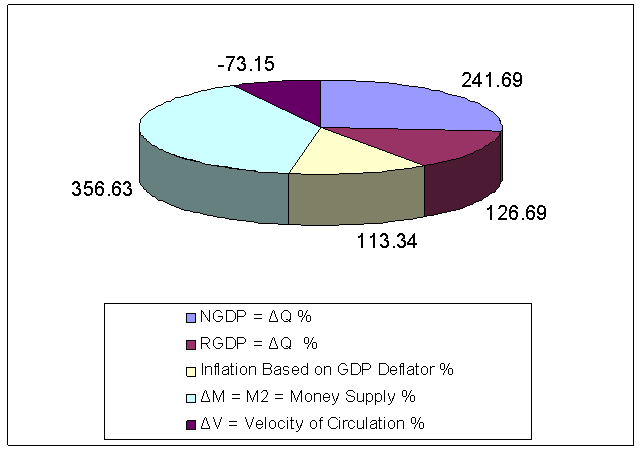 | Chart 2. Total Growth of the Bangladesh Money Supply, Price Level, Real GDP, Nominal GDP, 1989-2013, According to percent |
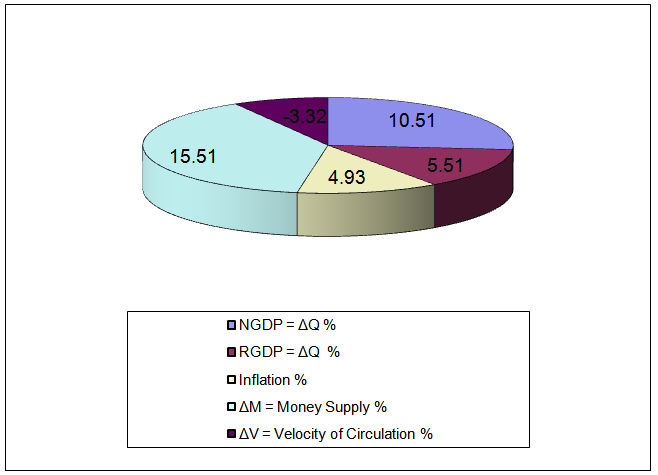 | Chart 3. Average Growth of the Bangladesh Money Supply, Price Level, Real GDP, Nominal GDP, 1989-2013, According to Times |
5. Conclusions
From the above scenario and findings of the Bangladesh economy we find that the Average money supply increases at a 15.51% but the average real and nominal GDP increase at 5.51% and 10.51% respectively. On the other hand, the inflation rate of this country moves 6% to 8% and average inflation rate is 4.93% during the period 1989-2013. It is also found that the velocity of money circulation decreases gradually over the time but the falling rate is too small. From the findings of the data, it is clearly proved that the economy of Bangladesh does not follow the rules of the Crude Quantity theory of Money especially in the short run. The assumptions of the constancy of Q and V of the Crude Quantity Theory of Money are not valid in the economy of Bangladesh. Now the question is why the assumptions of constancy are not working in Bangladesh economy in the short run and also in the long run. The answers are: 1) Velocity of the circulation in the economy of Bangladesh gradually falls due to increasing money supply.2) Nominal GDP increases due to increase of the money supply.3) Real GDP increases due to increase of investment, use of modern technology in production, increase of the labor productivity and government policies. As a result, the price level does not move proportionately with the money supply. Considering these the concerned people specially Monetarists who are advocates of the theory of Quantity of Money should think about the constancy assumptions and try to establish a new version of quantity theory of money by which they can be able to explain the relationship between money supply and price level properly.
References
| [1] | Roy J. Ruffin and other, (1938). Principles of Macroeconomics, Scott. Foresman and Company, California, pp122-124. |
| [2] | Mankiw N.G., (1012). Principles of Macroeconomics, Cengage Learning Private limited, India, pp 653-655. |
| [3] | GOB. (2012). Bangladesh Economic Review, Ministry of Finance, Dhaka, Bangladesh. pp 291-300. |
| [4] | GOB. (2010). Bangladesh Economic Review, Ministry of Finance, Dhaka, Bangladesh. pp 239-250. |
| [5] | BB. (2012). Monthly Economic Trends, Time Series Data, Statistics Department, Bangladesh Bank, Dhaka, Bangladesh. |


 Abstract
 Reference
 Full-Text PDF
 Full-text HTML

