-
Paper Information
- Next Paper
- Previous Paper
- Paper Submission
-
Journal Information
- About This Journal
- Editorial Board
- Current Issue
- Archive
- Author Guidelines
- Contact Us
American Journal of Economics
p-ISSN: 2166-4951 e-ISSN: 2166-496X
2014; 4(1): 62-71
doi:10.5923/j.economics.20140401.06
Measuring Performances of Football Clubs Using Financial Ratios: The Gray Relational Analysis Approach
Fatih Ecer, Adem Boyukaslan
Faculty of Economics and Administrative Sciences, Afyon Kocatepe University, Afyonkarahisar, 03030, Turkey
Correspondence to: Adem Boyukaslan, Faculty of Economics and Administrative Sciences, Afyon Kocatepe University, Afyonkarahisar, 03030, Turkey.
| Email: |  |
Copyright © 2012 Scientific & Academic Publishing. All Rights Reserved.
The main purpose of this study is the measurement of financial performance of the football clubs in Turkey. Additionally, one other purpose is to identify the importance level of financial indicators measuring the financial performances. Hence, financial performance of the four largest football clubs in Turkey is measured by Gray Relational Analysis method in this study. We selected eleven financial ratios that take place within the context of liquidity, liability and profitability indicators. Results showed that Fenerbahce has the best financial performance. Moreover, the most important financial indicators are liability indicators. The present study is believed to contribute in evaluating the football clubs from an economical perspective.
Keywords: Gray relational analysis, Football clubs, Financial performance, Financial ratios, Turkey
Cite this paper: Fatih Ecer, Adem Boyukaslan, Measuring Performances of Football Clubs Using Financial Ratios: The Gray Relational Analysis Approach, American Journal of Economics, Vol. 4 No. 1, 2014, pp. 62-71. doi: 10.5923/j.economics.20140401.06.
Article Outline
1. Introduction
- Although football is a game and also a leisure and entertainment tool, it has become not only an entertainment tool but also a phenomenon that is under the influence of various interest groups and trails large masses. When it is analyzed in its historical development, it can be seen that football constructed its own sector and is a continuously enlarging economy. Consequently, one of the things that must be done in such a situation is to evaluate the performances of football clubs, which are unbreakable parts of this economy, by examining their financial structures.In today’s competitive environment, measuring the financial performances of the firms is not only very important for managers, credit lenders and investors, but also for competitor firms taking place in the sector. As a result, performance evaluation of the firms is generally done within the context of financial analyses. Furthermore, the use of financial ratios in the process of financial performance evaluation is very common. More clearly, financial ratios produced from the data in firms’ income statements and balance sheets are being used in studies for financial performance evaluation for many years. This is because, financial ratios present the information that is necessary for decision making as a summary to the researcher. In addition, financial ratios present the strong and weak sides of the firms in terms of liquidity, development, and profitability[17, 37, 47]. Performance measurement of football clubs, which can also be thought as extraordinary businesses, interests all actors in and out of the game. Over the past three decades, it can be stated that football industry is in a trend that is more rising and developing when compared with other sectors. Nowadays, the circulation volume is around 225 billion $ inside the football industry and moreover the fact that it provides job opportunities for nearly one billion people show football sector’s and economy’s importance[20]. Football, therefore, is now a sector expressed by numbers and monetary power and cups won are left behind the money earned. For instance, when the placement of the largest leagues in Europe is made, the first places consist of England (4.17 billion $), Germany (3.038 billion $), and Spain (1.531 billion $). Turkey, however, takes the 6th place in this placement with 431 million $ worth brand value. Again, Turkey takes the 6th place with its 922 million $ worth value, in terms of market value of the league[31]. Furthermore, the first three football clubs as to financial power all over the world are Barcelona (621.8 million $), Real Madrid (599 million $), and Bayern Munich (435.45 million $). Nonetheless, only Galatasaray and Fenerbahce among the clubs in Turkey take place in the first 30. With the aim of gathering longer termed and less costly funds, football clubs are opened to capital markets. In Turkey only four teams, Besiktas that was settled in 1903, Galatasaray that was settled in 1905, Fenerbahce that was settled in 1907, and Trabzonspor that was settled in 1967, have completed incorporation phases and started to trade in stock market in Borsa Istanbul (or Istanbul Stock Exchange) (ISE). Despite the fact that Trabzonspor is the first football club that incorporated in 1994, it entered ISE in 2005 and became the last club that did stock market quotation among these clubs called “Big Four”. Incorporation and entrance to ISE periods of other clubs are as follows: Besiktas incorporated in 1995 and entered ISE in 2002, Galatasaray incorporated in 1997 and entered ISE in 2002, and finally Fenerbahce incorporated in 1998 and entered ISE in 2004. Finally, as seen in Figure 1, since the day it was founded to our time, Galatasaray won 19 Turkish league championships, 14 Turkish cups, 13 super cup; Besiktas won 13 Turkish league championships, 9 Turkish cups, 8 super cups; Trabzonspor won 6 Turkish league championships, 8 Turkish cups, 8 super cups; and finally Fenerbahce won 18 Turkish league championships, 6 Turkish cups and 8 super cups.
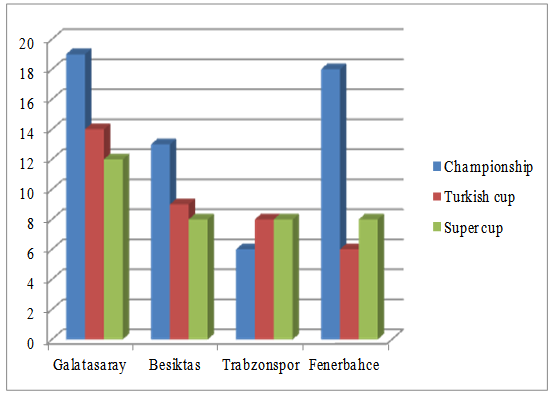 | Figure 1. Sporting successes of the four biggest football clubs in Turkey |
2. Literature Review
- Previous studies on football economy becoming a very large industry parallel to the development of financial system can be dealt as two periods. The first period covers 1970 and 80s, and it is seen that many studies focused on determining the participation demand to football games. The other period is starting from 1990s until now and it is pointed that in the studies done in this period topics such as determination and payment of the transfer payment of transferred footballers, race discrimination, structure and results of national leagues and UEFA Championship League, performances of football coaches and managers, payments of footballers, influence of changes in management and effect of sportive successes of teams that incorporated on stock prices are examined[1, 3, 4, 5, 7, 8, 9, 10, 16, 18, 19, 21, 22, 25, 32, 33, 34, 35, 36, 38, 40, 41, 42]. However, a few studies are met about evaluating financial performances of football clubs by using ratios.In one of the studies in which ratios are used, Korukoglu and Korukoglu[26] analyzed and interpreted Galatasaray, Besiktas and Fenerbahce clubs’ financial statements and indicators that belong to year 2005’s first three quarters using canonical discriminant analysis. Their findings indicated that football clubs differentiated from each other. In another study, Yildiz[48] examined the financial statements of Manchester United and Fenerbahce by doing comparisons. Information was taken from the balance sheet and statement of income that took place in 2004/2005 season annual report and he was interpreted with the help of financial indicators. He used liquidity, liability and profitability indicators and showed that Manchester United has a more sound financial structure compared to Fenerbahce and so, its sportive successes were parallel to financial strength formed. Recently, regarding the financial performances of football clubs, Dimitropoulos[15] examined Greek first league between the years 1993-2006. Within the context of the study, annual financial statements and financial ratios belonging to football clubs were used in explaining the reasons of the financial crises experienced in Greek football league. Consequently, because of Greek football clubs’ use of foreign resource was high, Greek football clubs experienced liquidity and profitability problems and they also struggled a continuously increasing financial difficulty. In addition, it has been claimed that these financial difficulties may be linked to political deficiencies and bad financial management experienced in the past two decades. Finally, he presented various solution recommendations for Greek football clubs to sustain their competitive statuses and improve their financial statuses.
3. Financial Indicators and Ratios Used in the Study
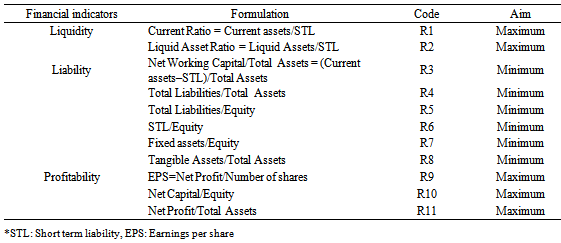
- Financial statements are the most reliable sources that give current and periodical information about the financial situation of businesses. These statements help business partners and stakeholders do financial analyses of the related period or current period. Financial analysis is fulfilled with basic purposes, such as making business decisions in a healthy way, defining financial policies, obtaining required sources, and measuring financial adequacy. Thanks to this, business owners ensure their capitals, business managers can realize decision making, planning and auditing activities, stakeholders have the opportunity to evaluate activity results and results like profitability[2]. Whereas these analyses can be used in financial planning, they can also be used in the measurement of realizing activities. Additionally, the most commonly used method to make financial analysis is the ratio analysis. Ratio analysis is the expression and mathematical interpretation of the relationship between two items aimed to be examined in the financial statements. It also helps businesses to reach results about returning their obligations, profitability, liquidity status, financial structure, and effective use of assets[11]. Financial ratios seen in Table 1 and used in the study show similarities with ratios that were used in a limited number of studies in literature, intended to determine the performance of football clubs. More generally, liquidity and profitability indicators to be high and liability indicators to be low is a situation that businesses and investors desire. Hence, two of the liquidity indicators, six of the liability indicators, and three profitability indicators were used for financial evaluations in this study.Liquidity indicators are used in the analysis of the current status of the business, and in determining whether its facilities and working capital are enough to pay the liabilities that must be paid. Two of the liquidity indicators used in this study are the current ratio and the liquid asset ratio. Current Ratio shows the strength of the business to pay its short term liabilities with its current assets, in other words, shows the ability of the business to pay its due liabilities. Liquid Asset Ratio states how much of the short term liabilities the business can pay with its cash and cash like assets. Liability indicators are taken into account while interpreting the relationship between business’ equity capital and liabilities. We consider six of liability indicators in this study. Net Working Capital/Total Assets ratio shows how much share current assets purified from short term liabilities have in total assets. Generally, net working capital is wanted to be high in the businesses. However, an excessively high ratio might point inadequate liability usage or idle current assets. Total Liabilities/Total Assets ratio expresses what portion of the business assets are covered with liabilities. The financial risk of the business increases in the case of this ratio is high. Total Liabilities/Equity ratio shows the relationship between business’ liabilities and equity capital. If liability is higher than equity capital, then risk increases. Nevertheless, if equity capital is higher than liability, then cost of borrowing increases as financial risk decreases. Short Term Liability/Equity Capital ratio is the ratio of the liabilities of the business that are due one year or less, in its equity capital. Fixed Assets/Equity ratio shows how much of the fixed assets are financed with equity capital. Finally, Tangible Assets/Total Assets ratio is the indicator of how much of the total assets consist of tangible assets. Profitability indicators are used in interpreting the profitability level, which is the final purpose of the business. The Earnings per Share ratio, as can be understood from its name, is the profit ratio that shareholders have at the end of a period. As expected, this ratio is wanted to be high. Net Capital/Equity ratio is the ratio that shows equity capital profitability of the business. Finally, it would not be wrong to state that Net Profit/Total Assets ratio is the profitability of the assets.
|
4. Grey Relational Analysis (GRA)
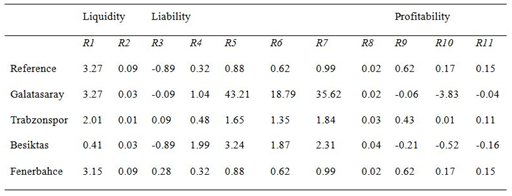
- GRA is a method that can be used in decision making in situations where there are many criteria by ordering them as to relation grade. It is especially preferred in ordering the alternatives in situations in which the sample is small and sample distribution is not known. Gray system theory was first introduced by Deng[14]. The “Gray” term here states either a lack of information or not being known at all. Two elements in a specific system or the similarities or differences between two sub-systems are called as “Gray relation”. The method benefiting from measuring the developments in the changes of similarities and differences between the elements is called GRA. This method enables determining the level of the relation between each factor that is came across in a gray system and the compared factor (reference) series. Each factor is defined as a serial (column or row). Accordingly, effect degree between factors is called gray relation grade. One of the purposes of usage of GRA is to separate important variables in groups between themselves by recognizing unimportant ones among various variables. In this way, variables in one group become variable related to each other, and thereby can be separated from other groups. When the data set is large and has a normal distribution, methods such as factor analysis, cluster analysis and discriminant analysis can be used in statistics. Nevertheless, when the sampling is little and whether the distribution is normal or not is not known the reliability of these analyses done decreases. Step 1: Construct the decision matrix
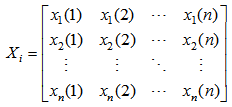 | (1) |
 with j entities, and xi is the compared series of
  , where
  Step 3: Normalize the data set. Data can be treated by one of the three types; i.e., larger-is-better, smaller-is-better, and nominal-is-best.For larger-is-better transformation,
  can be transformed to
  . The formula is defined as:
 | (2) |
 is the maximum value of entity j and
  is the minimum value of entity j. For smaller-is-better, the formula to transform
  to
to  is;
is; | (3) |
 and
and  , then the formula is;
 | (4) |
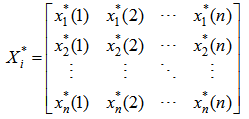 | (5) |
 , the absolute value of difference between
  and
and  at the j-th point. The formula is;
 | (6) |
 using the following equation:
 | (7) |
 ,
,  , and
, and  Step 6: Compute the degree of grey coefficient
  . If the weights (Wi) of criteria are equally important, the degree of grey coefficient
  is computed as:
 | (8) |
 is computed as:
 | (9) |
 value, then it is the most important alternative. Therefore, the priorities of alternatives can be ranked in accordance with
  values.
5. Empirical Findings
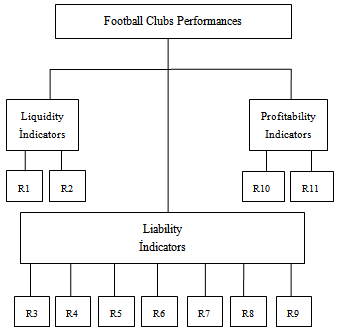
- Hierarchical structure intended to financial performance evaluation of football clubs is pictured in Figure 2.
 | Figure 2. Hierarchical structure of football clubs measuring system |
|
|
|
|
|
|
6. Discussion
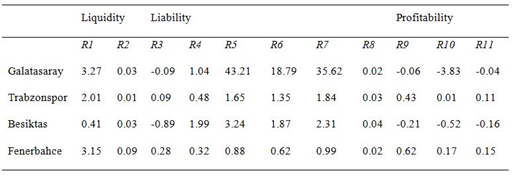
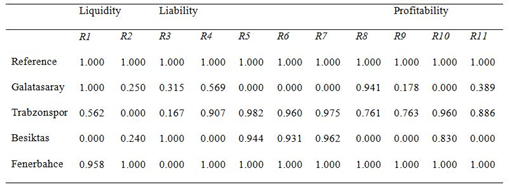
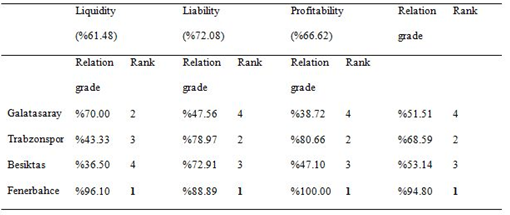
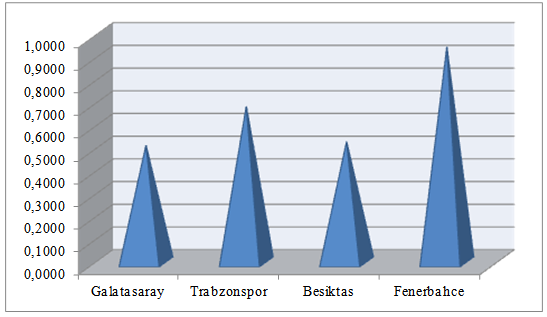
- According to the findings in Table 7, the most important financial indicator measuring financial performances of football clubs is liability indicator. In addition, profitability and liquidity follow it with 66.62% and 61.48%, respectively.If the findings are handled in more detail, when an assessment is done in terms of ratios within the context of liquidity it can be said that Fenerbahce is very close to total effectiveness with 96.10% and thus it is very efficient in its liquid assets. In other words, Fenerbahce has the power to pay its short term debts on time. Galatasaray, which holds the second place, has 70% efficiency. In other words, a little bit regulation of liquidity will affect Galatasaray’s financial performance in an increasing trend. Finally, Trabzonspor and Besiktas are in a position that might be called bad in terms of liquidity. Hence, it can be stated that both clubs’ earnings and current assets are inadequate in covering the increasing debt load. In sum, it is seen that Fenerbahce is in very good status in terms of liquid resources, whereas Trabzonspor and Besiktas are in a pickle. When the orderings gathered within the framework of liability indicators are examined, it has been found that Fenerbahce is the club that has the best situation with %88.89. Trabzonspor, Besiktas, and Galatasaray follow Fenerbahce, respectively. Besiktas is third in liability indicator alignment. Having around 215 million $ debts of which 135 million $ is short termed and 80 million $ is long term, Besiktas cannot take a place in 2012-2013 European Cups since it cannot meet its obligations in 65th and 66th items of UEFA Club License and Financial Fair Play regulation; and this holds a characteristic approving this determination. However, Galatasaray has the appearance as the club that has the most debtor structure. The reason for this is thought to be the increase of Galatasaray’s activity size in 2008-2012 period and choosing its adoption of development with a debt model.According to the last indicator used in the analyses, which is profitability indicators, Fenerbahce seems to have reached full efficiency by 100%. Efficiency of Trabzonspor, which takes the second place, can also be interpreted as good. Despite this, Besiktas and Galatasaray are in a bad condition in profitability indicators. In addition, Galatasaray’s management did a large amount of profit distribution via Sportif Inc. Hence, incomes of this club have been directed to the company and expenses are left in the club. Consequently, the debt load of the club, which is already in the slough of debt, has increased even more.
 | Figure 3. Financial performances of football clubs |
7. Results
- When evaluated in its historical development, it can be seen that football created its own sector and it has become a rapidly growing economy. It is quite natural to assess football clubs as extraordinary firms not only with their sporting successes but also with their financial performances. Nowadays, assessment of financial performances of clubs is quite important for managers, investors, credit lending institutions, competitors, and other stakeholders. This is because, financial performance success of the clubs become an important role on sporting success ordering. However, even though one of the basic elements of the sporting success is financial structure, attention is attracted to the fact that financial performance assessments regarding the clubs by using financial ratios is not being done frequently. For this purpose, this study prepared to measure the financial performances of the four largest football clubs in Turkey between 2008-2012 period by using financial ratios will make a premise contribution to the literature. In other words, this study is believed to contribute in evaluating the clubs from an economical perspective.In literature, very different mathematical methods have been used in measuring the performances. The method preferred in this study is Gray Relational Analysis whose popularity is increasing in the recent years. Thanks to this method it can be reached desired solutions with few data and assessments are made by benefitting from the relation grades of the football clubs. The findings of this study show that the most important financial indicator is liability indicators, it is followed by profitability and liquidity indicators in the measuring of the financial performances of football clubs. The results also indicate that Fenerbahce has the most successful performance among the four unique clubs of Turkey. Moreover, in the basis of Fenerbahce’s this success, the fact that its liquidity and profitability are high, and liability ratios are low played an important role. In the light of these findings, Fenerbahce can be supposed as managed well financially. The club that has the second best performance is Trabzonspor. Trabzonspor is again the second best club after Fenerbahce regarding to liability and profitability indicators. Besiktas, which is in a very bad condition in liquidity, takes the third place since it is in a better condition than Galatasaray as to liability and profitability indicators. However, when the main reason for Galatasaray to take the last place is thought, Besiktas’s third place can be misleading. That is to say, if it is assumed that Galatasaray does not have a right reason, in reality Besiktas can take the last place. Finally, Galatasaray took the last place since it was not efficient with respect to its liability and profitability indicators, though its liquidity is partially in good condition. However, as expressed before, this result may be accepted as normal, as Galatasaray adopts a growth model by borrowing.One limitation is given by not including all super league clubs in Turkey to the study. The reason for this is the fact that other clubs are not listed on the ISE thereby, their necessary data could not be reached. In future studies, performance measurements can be made, by including all clubs that will be listed on ISE into the analyses. Again, new studies can be done by using methods that are within MCDM methods, such as TOPSIS, AHP, ANP, VIKOR and PROMETHEE.
 Abstract
 Reference
 Full-Text PDF
 Full-text HTML