-
Paper Information
- Next Paper
- Paper Submission
-
Journal Information
- About This Journal
- Editorial Board
- Current Issue
- Archive
- Author Guidelines
- Contact Us
American Journal of Economics
p-ISSN: 2166-4951 e-ISSN: 2166-496X
2014; 4(1): 1-17
doi:10.5923/j.economics.20140401.01
An Empirical Analysis of the Relationship between CO2  Emission and Economic Growth in West Africa
Olarinde Muftau1, Martins Iyoboyi2, Abdulsalam S. Ademola2
1Department of Economics, Usmanu Dan Fodiyo University, Sokoto, Nigeria
2Department of Economics & Development Studies, Federal University, Dutsin-ma, Katsina, Nigeria
Correspondence to: Martins Iyoboyi, Department of Economics & Development Studies, Federal University, Dutsin-ma, Katsina, Nigeria.
| Email: |  |
Copyright © 2012 Scientific & Academic Publishing. All Rights Reserved.
The paper empirically examined the relationship between CO2 emissionand economic growth, using a Fixed Effects panel regression Model executed within a vector error correction framework for West African countries over the period 1970-2011. The results of cointegration indicate that there is a long-run equilibrium relationship between CO2 emission, Gross domestic product and other relevant covariates. The empirical results indicate that in the long run, there is an N-shape relationship between income and CO2 emission and that the EKC hypothesis is not supported for West Africa. It was found that the amount of CO2 emission and consequently the level of environmental pollution or quality in these countries are reflective of the rates of economic growth, the nature of macroeconomic policy, rapid population increases, domestic credit to private sector and trade openness. Both the short-run non-causality results show that economic growth, population growth rate, domestic credit to the private sector and trade openness Granger-cause carbon dioxide emission and are statistically significant, and these are supported by the estimated regression results which indicate a statistically significant positive relationship between CO2 emission and economic growth. It is recommended that while economic growth should be a focus, it is important that policies which enhance the quality of the environment be enacted and implemented among the countries in the region.
Keywords: CO2 Emission, Economic Growth, Environmental Pollution, Fixed Effects Model, Vector Error Correction Model, West Africa
Cite this paper: Olarinde Muftau, Martins Iyoboyi, Abdulsalam S. Ademola, An Empirical Analysis of the Relationship between CO2  Emission and Economic Growth in West Africa, American Journal of Economics, Vol. 4 No. 1, 2014, pp. 1-17. doi: 10.5923/j.economics.20140401.01.
Article Outline
1. Introduction
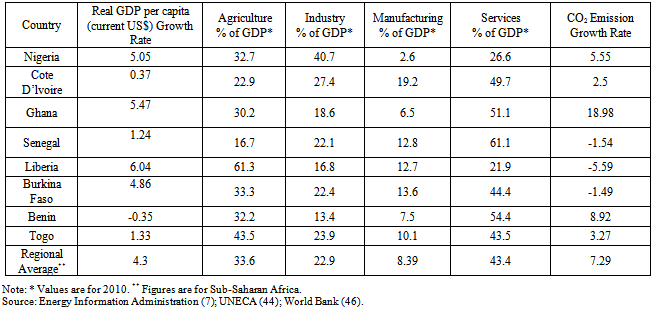
- The major focus of most economies of the world is the achievement of growth and development. This calls for economic transformation through increasing share of industrial and manufacturing activities in the Gross Domestic Product (GDP) of a country and this is evidently so among developing countries, especially in Africa, where high unemployment, inflation and acute poverty are prevalent. Rapid industrialization, industrial trade and population growth are some of the major factors responsible for higher consumption of environmental resources with negative effect on the quality of the environment. In recent years, higher emission of ozone-depleting substances has resulted in the increase in the rate of environmental pollution (air and water), and global warming.In specific terms, increasing rate of carbon dioxide (CO2) emission due to higher energy consumption accounts for about 72% of the total emitted greenhouse gases responsible for global warming[21]. Consequently, an attempt to achieve higher growth rate and development is usually at the expense of the environment. This has led scholars to establish the Environmental Kuznets Curve (hereafter EKC) first discussed by Krueger and Grossman[12]. The EKC assumes an inverted U-shape, indicating a positive relationship between environmental pollution and the level of economic growth (GDP per-capita) up to certain stage, after which it tends to have a negative relationship. In other words, at the initial level of development, higher economic growth is associated with higher levels of environmental degradation or pollution up to a certain income threshold, after which the level of environmental quality improves. This is based on the view that most developing countries face the risk of depleting renewable resources such as water and forests as well as the challenges of funding investments in environmental protection and creating functional institutions that permit economic growth and support appropriate regulations[8]. Without exception, all West African countries are still being categorized as developing economies. Consequently, the imperatives of designing appropriate policies that can transform their economies are generally recognized, an attempt that carries with it emissions of greenhouse gasses originating from increasing economic activities. One of the effects of economic transformation in the region is the declining share of agricultural contribution to total gross domestic product (GDP) in favour of manufacturing / industrial sector. In 2010, agriculture accounted for a lower value as a percentage of GDP compared to other sectors in some of the countries in the region, with Senegal having a value of 16.7, and Cote D'ivoire 22.9. The manufacturing sector had the highest proportion of GDP with Cote D'ivoire having the largest value of 46.6 followed by Nigeria and Burkina Faso with 43.3 and 36.0 respectively. The structure of output and GDP per-capita and the rate of CO2 emission in some West African countries between 2009 and 2010 are presented in Table 1.From Table 1, it can be observed that though the services sector accounted for higher proportions of GDP compared to other sectors during the period under study, the sector does not appear to contribute significantly to the reduction in the rate of carbon emission. In 2009, the real per capita GDP growth rate of the West African region stood at 2.0% and increased to 4.3 in 2010[38]. A cursory look at the economic performance of individual countries shows an improvement in their level of development over the past few years, with a corresponding increase in the rate of CO2 emission. From 2009 to 2011, the annual growth rates of GDP for Nigeria, Ghana and Togo increased from 6.96%, 3.995% and 3.50% to 7.36%, 15.01% and 4.179% respectively. In the same vein, their rates of emission increased from 0.4321%, 0.3248% and 0.2016% to 0.4938% 0.3735% and 0.2133% respectively[7, 47]. On the average, the total CO2 emission of West African countries experienced a marginal increase from 0.766% in 2008 to 0.774% in 2011. An examination of the Environmental Sustainability Index (ESI) ranking among the New Partnership for Africa Development (NEPAD) member countries shows that the best that could be achieved by any West African country was 5th position by Mali, closely followed by Ghana. With respect to the global ranking in the Environmental Sustainability Index, the best country in the region ranked 41st position[49]. The poor ranking of West African countries on the ESI table is an indication of poor environmental quality. This has had negative multiplier effects in the region in the effort to achieve sustainable development. The is because West Africa’s major economic sectors are vulnerable to current climate variability, the rate and pattern of which are critical to eradicating poverty, both of which have exposed the level at which countries and people are already vulnerable to shock[19]. For example in 2012, the flood disaster experienced in Nigeria cost the country about N2.6trillion, apart from the loss of human lives[30].In order to get some insight into the evolution of emissions of carbon dioxide in the path to development by the countries in the region, we considered three countries, which have achieved some level of economic progress over the last thirty-three years, namely Cote D’ivoire, Ghana and Nigeria. Figure 1 shows the trends in emission per capita, GDP per capita and carbon intensity in these countries.From Figure 1(b), the 2011 GDP per capita for Cote D’ivoire was -54.23% of 1980 GDP while emission per capita in 2011was -33.51% of that of 1980, implying that the increase in GDP over a thirty-one year period corresponds to the increase in carbon emission per capita. Also from Figure 1(c), the carbon intensity in Ghana over the same period exhibits an inverted U-shape but reaches a turning point in the year 1983 and 1995 after which it continues to fall. On the whole, the carbon intensity rate in the country fell significantly from 1.3 metric tons in 1980 to 0.44 metric tons in 2011. This is because GDP per capita in Ghana was growing much faster than the CO2 emission per capita during the period. In 2011, GDP per capita in Ghana was 766.05% of the 1980 value, while the 2011 emission per capita increased by 66.78% over that of 1980. This may be due to the composition of its total GDP in 2010 which has a value of 51.1% from the services sector, one of the highest among the countries in Table 1.
|
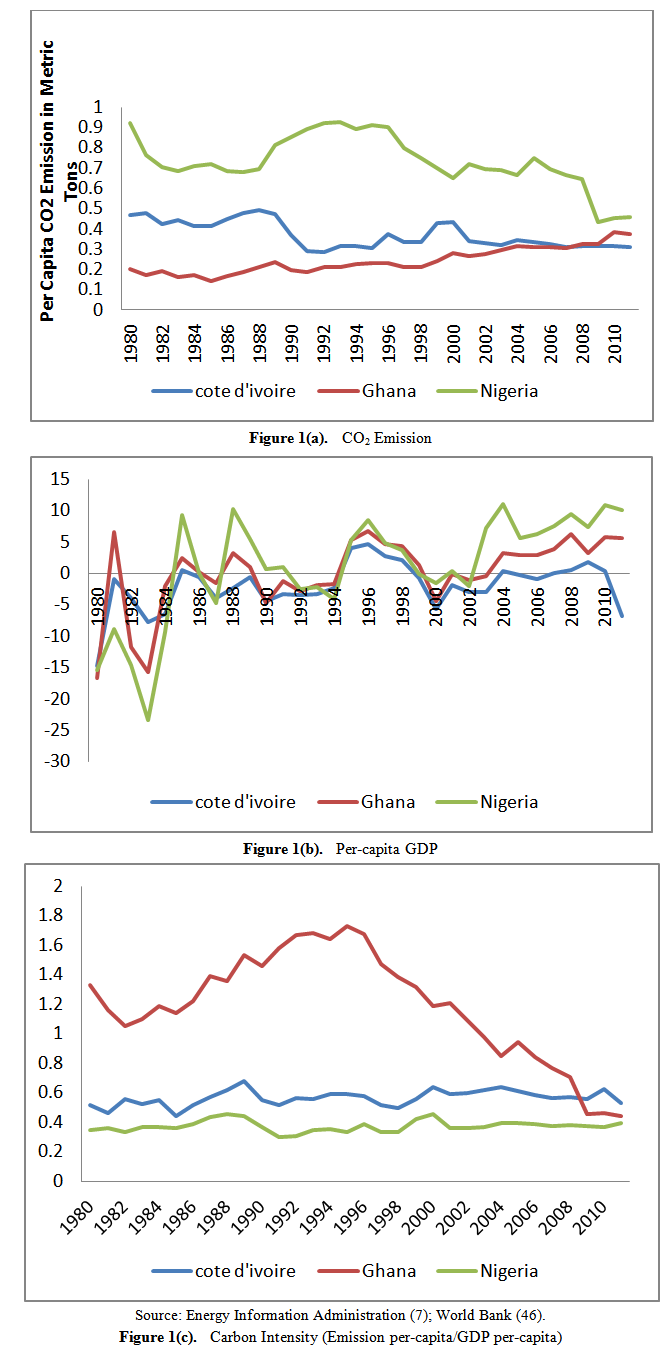 | Figure 1. Trend in CO2 Emission, GDP Per Capita and Carbon Intensity in Cote D’Ivoire, Ghana and Nigeria (1980–2011) |
2. Theoretical Framework and Empirical Literature Review
2.1. Theoretical Framework
- Environment, which consists of all natural resources, plays two important functions in ensuring sustainable existence and development. These are source and sink functions and once these are over-taxed, the environment is likely to be polluted[18). The source function deals with its ability to provide raw materials and services for the survival of the human race, while the sink function encompasses its ability to absorb and render harmless waste product of all human economic activities of production and consumption. This recognition has shifted the interest of most economists and environmentalists away from natural resource availability to the environment as a medium of assimilating wastes[29]. Consequently, achievement of sustainable development is now defined not only in terms of economic growth but also as a way out of poverty, social deprivation and environmental degradation, particularly for the developing world[48]. The change in scope of the concept of sustainability has led to the emergence of economic theories and empirical investigations on the link between economic growth and environmental pollution with diverse opinions and outcomes. Traditional economic theory posits a trade-off between economic progress and environmental quality. More recently, it has been suggested that increased wealth is a prerequisite for environmental improvements[13].In the 1970s, the debate on the relation between growth and the environment ended up in a report (Report of the Club of Rome) termed “The Limits to Growth”. The common wisdom was that economic growth meant greater environmental impacts and the main way to environmental gains was to reduce population and consumption[18]. Neoclassical economists passionately argue that the limits-to-growth is not a problem due largely to resource constraints. They maintain that substitution and innovation could reduce environmental impacts as depicted in the Solow’s (1974) endogenous growth model, and further extended by other standard growth theories[40].The renewed concern about ozone layer depletion, global warming and biodiversity loss led to the development of the Environmental Kuznets Curve (EKC) hypothesis in the 1990s. Kuznets[24] hypothesized that economic inequality increases over time and that after a threshold becomes more equal as per capita income increases. Linking this curve to the environment, Grossman and Krueger[13] posit that in the early stages of economic development, environmental degradation will increase until a certain level of income is reached (known as the turning point), after which environmental improvement will occur. This relationship between per capita income and pollution is assumed to have an inverted U-shape (39; 46). It is interesting to note that some have argued that economic growth involves an increase in emissions of carbon dioxide and that any attempt to curtail emissions will restrict it[42].Different reasons have been advanced as to why the EKC will be an inverted U-shape. First is the assumption that the demand elasticity for environmental quality is greater than zero and sometimes greater than unity, and so can be categorized as a normal good. Hence, as income increases, the demand for environmental quality also increases more than the proportional change in income (3; 47). On the part of government, the reasoning is that the higher the level of income, the better is the ability to ensure environmental protection through institutional environmental capacity (5; 29). Second, the relationship between growth in income and pollution as explained by Grossman and Krueger[17] is based on the view that rising income brings population growth rates down, leading to decreases in population pressure on the environment. For example, it is argued that investing in education for women and providing retirement insurance schemes are the best ways to reduce population growth, the possibility of which is dependent on the resource base of the economy. Finally, in another study, Grossman and Krueger[13], while relating how economic growth could lead to improved environmental quality, posit that economic growth could affect the environment through three different channels. These are the scale effect, composition effect, and the technique effect. The scale effect deals with increase in pollution as the size of the economy increases, implying that an increase in the scale of economic activities (not as result of transformation in the structure of an economy) will lead to an increase in pollution and environmental degradation. The composition effect refers to economic transformation in an economy that encourages the use of more resources and heavy manufacturing industries that result in increased pollution. The technique effect captures improvement in the method of production and adaptation of less pollution - emissive technology and, hence a reduction in pollution.The above reasoning is based on the belief that starting from low-income levels, structural changes in an economy will most likely increase pollution level in the beginning as the share of agriculture goes down and that of industry goes up. As economic development progresses and income grows, the share of industry will go down as the share of services goes up. Thus, sectoral changes may favour less-polluting sectors[17]. This explanation has generated some criticisms among scholars. Among the arguments advanced are that people’s revealed preferences indicate that pollution - intensive material goods are still highly valued even at higher levels of development[29]. There is also the postulation of the “pollution haven hypothesis”[28]. Thus, declining rate of pollution may not necessarily be an outcome of sectoral changes.Apart from the traditional inverted-U shape relationship depicted by the EKC, an N-shape relationship has also been established (14; 22; 43). The proponents conclude that pollution increases when a country is in the early stages of development, and decreases once the threshold GDP is reached, and then begins to rise as national income continues to increase. In a total departure from this line of thought, Neumayer[29] argues that as a country achieves economic growth, the pollution rate may continue unabated because people’s revealed preferences indicate that pollution - intensive goods are still highly valued even at higher levels of development. The possible truism of the pollution haven hypothesis[28] may be a plausible reason behind the reduction in pollution levels in a developed economy.
2.2. Empirical Literature
2.2.1. Environmental Indicators and Economic Growth
- Empirical literature on the relationship between growth in income and pollution are limited, especially in relation to West African countries. Of importance is the fact that their results are mixed. This is not surprising considering the different theoretical explanations advanced by scholars and investigators. Some studies find a linear relationship between economic growth and environmental pollution (e.g. 11; 19; 39). Others have showed an inverted U-shape relationship in line with the EKC hypothesis (e.g. 13; 15, 26; 34). Still others have established an N-shape relationship between growth in income and pollution (e.g. 4; 14; 21) which suggests that any improvement achieved in environmental quality through economic growth is only temporary. Yet several other empirical studies have shown that wealth is an important factor in explaining environmental policy results, but is not alone determinative [49].Grossman and Krueger[11] undertook the first EKC study as part of an investigation of the potential environmental impacts of NAFTA. The study estimates EKC for ten different indicators (mostly ambient pollutions) using the Global Entrepreneurship data set. In their analysis, three different functional forms were used and the study reveals that lack of both clean water and urban sanitation decline uniformly with growth in income overtime. The deforestation regressions show no correlation between income and deforestation while river quality tends to worsen with increasing income. Carbon emissions per capita increase continuously as income increases and only local air pollutant concentration is in consonance with the EKC hypothesis.Panyatou[34], Grossman and Krueger[13], and Galeotti et al[9], employing different methods and environmental indicators ranging from CO2, sulphur oxide (SO2) and deforestation obtain an inverted-U shape relationship between CO2 emissions and income per capita. However, in the studies, the turning point at which the delinking occurs i.e. when growth in income will lead to improved environmental quality is inconclusive. Shafik and Bandyopadhyay[39] used three different functional forms (log-linear, log quadratic and logarithmic cubic polynomial forms) to estimate the EKCs for different pollutants. Their result supports the existence of EKC in that SO2 emission and Suspended Particulate Matter (SPM) increases first and declines later with the growth in incomes.Joseph[19] on a study on climate change and sustainable development in Sub-Saharan Africa, using panel cointegration method, shows that there is strong positive relationship and sensitivity of climate change to growth. It was therefore recommended that countries should consider integrating climate variability issues in their national planning and development processes. In contrast to the result, Usenobomg et al[45] examine economic growth and environmental degradation in Nigeria. Their result indicates an N-shape relationship between economic growth and environmental degradation. They maintain that courageous policy measures of environmental preservation be adopted irrespective of the country’s level of income.From the foregoing, it can be inferred that the level of economic growth is largely a determinant of an economy’s environmental quality. This is in line with Beckerman[3] who posits that in the long run, the surest way to improve the environment is to become rich due to the strong correlation between pollution, incomes, and the extent to which environmental protection measures are adopted. Some scholars even assert that environmental policy that has declining effect on economic growth may actually reduce environmental quality[36].In line with Esty and Porter[8], it is generally agreed that the analysis of the relationship between environmental pollution and economic growth necessarily involve its mechanism. Hence, some authors have linked environmental quality to other factors such as trade openness (1; 25), structural change in production (36; 45), institutions (6; 24; 35) and population size (4; 10).Machado[25] examines the impact of trade openness on the quality of environment in Brazil, employing the input-output approach. The result reveals a positive link between foreign trade and CO2 emission, implying that trade openness contributes positively to environmental deterioration in the country. Antweiler et al[1] find that international trade has a positive effect on environmental pollution. In a related study, Suri and Chapman[41] disaggregate trade into share of exports and imports in GDP and conclude that higher share of exports in GDP is positively linked to pollution while the share of import generates lower emissions.Examining the impact of policy on emission rate, Panayotou[35] incorporates policy variables into his model and finds that improvement in policy institution results in decline in pollution. He argues that reducing the rate of environmental pollution requires an improved institutional policy framework. Lopez and Mitra[24] on an investigation of the impact of the quality of institution (proxied by corruption) on environment, shows that corruption tends to lower environmental quality. Deacon[6] investigates the relationship between the level of environmental quality and the political system, pointing out that the relationships between income and environment vary across political systems and that the level of environmental quality is worse in non-democratic settings.It is important to point out that some authors insist that structural transformation in an economy cannot be omitted when studying EKC hypothesis. Panayotou et al[33] investigate the role of structural change in the relationship between emissions and growth. Their result indicates that emission rate increases as the level of industrialization increases and decreases in the post-industrial stage. They conclude that the inverted U-shape relationship between growth in income and emission is the inevitable result of structural change as an economy gravitates towards development.The result of the study by Chao et al[4] on the long-term relationship between population growth and vegetation cover in China, and using NDVI data set and panel cointegration regression method tends to support a long-term inverted N-shape relationship between the variables especially in the region where there are frequent human activities and where the influence of climate change on vegetation cover is relatively small. In addition, the panel error correction model shows that there is a bi-directional causality between population growth and vegetation cover in the long run. Geetilaxmi and Giri[9] explore the relationship between economic development, measured in terms of State Domestic Product (SDP) per capita and different air quality parameters for industrial and residential locations, and used cross-section and time series data for 15 major states in India. The fixed effects result indicates an inverted U-shape EKC which is not statistically significant for both industrial and residential locations, while some developmental factors such as population density, urbanization and policy variables are significant with expected signs in most of the cases. Based on the results, they conclude that emissions of different air quality parameters are not due mainly to economic growth but also to other socio-economic factors.
2.2.2. Relationship between CO2 Emissions and Economic Growth
- A number of empirical investigations linking CO2 emissions and economic growth (mostly proxied by per capita income) have been undertaken. Orubu et al[31] investigate the relationship between per capita income and environmental degradation in selected African counties, using longitudinal data covering a period of 27 years commencing from 1975, with the specific objective of estimating environmental Kuznets curves for five indicators of environmental quality. The results of the empirical investigation confirm the existence of environmental Kuznets curves for suspended particulate matter, carbon dioxide as well as a significant relationship between environmental depletion and other factors like population, education attainment and policy regime. Though the turning point is lower compared to earlier studies on EKC, they recommend that environmental issues be included in the entire development planning process in order to ensure environmental sustainability in the continent.The result of the study conducted by Seetanah and Sannassee[38] on the relationship between GDP and carbon dioxide emissions for Mauritius for the period 1975-2009 does not support the existence of a reasonable turning point and therefore no EKC “U” shape was obtained, contradicting the earlier study carried out by Orubu et al[32]. Thus, as hypothesized, the cost of degradation associated with GDP grows over time with the implication that economic and human activities have increasingly negative environmental impacts on the country in comparison to its economic prosperity. Based on the results, the authors conclude that scientists and policy makers should be more careful in terms of providing impetus for clean or environment-friendly energy production using appropriate technology and the adaptation of policies which deliberately seek to reduce carbon dioxide emission rather than placing emphasis on the growth in the GDP only.Arouri et al[2] examine the link between economic growth and CO2 emission (through energy consumption) for 12 Middle East and North African (MENA) countries for the period 1981-2005. Using different estimation methods including panel cointegration, their results indicate that real GDP exhibits a quadratic relationship with CO2 emissions for the region as a whole. The result seems to support the existence of EKC hypothesis in many countries studied. However they note that the lower turning points in some cases are very low and very high in other cases, providing poor evidence in support of the EKC hypothesis. They therefore conclude that that not all MENA countries need to sacrifice economic growth in order to decrease their emission levels, as they may achieve CO2 emissions reduction via energy conservation without experiencing negative long-run effects on economic growth.Pindiriri and Chidoko[37], while investigating the relationship between financial development assistance and carbon dioxide emissions in Sub-Saharan Africa (SSA), estimate the random effects panel data model in two functional forms (the linear and the quadratic) to link carbon dioxide emissions to such variables as sustainable development assistance, per capita income, energy use and manufacturing share of GDP. Their results provide evidence in support of the existing empirical studies that increases in current per capita incomes increase carbon dioxide emissions in SSA. The quadratic functional form estimate shows a negatively signed squared income coefficient, which implies an inverted “U” shaped curve for the relationship between CO2 emissions and per capita income. They conclude that the results not withstanding, do not provide evidence to support the quadratic functional form in income variable.Examining the long-run and dynamic temporal relationships between economic growth, energy consumption, population density, trade openness, and carbon dioxide (CO2) emissions in Brazil, China, Egypt, Japan, Mexico, Nigeria, South Korea, and South Africa based on the environment Kuznets curve (EKC) hypothesis using ARDL approach, Owoye et al[32] confirm the existence of the inverted U-shaped EKC hypothesis in the case of Japan and South Korea, while in the other six countries, the long-run relationship between economic growth and CO2 emissions follows an N-shaped trajectory. They therefore conclude that it would be improper for policy makers to adopt the EKC postulate as a basis for policies favouring economic growth unconditionally, while their recommendations include the need for a wide range of policy initiatives that would induce increased demand for better sustainable environment quality that is in tandem with measures to spur economic growth.Mohsen and Hossein[26] examine the relationships between energy consumption, GDP growth and emission, using Panel Smooth Transition Regression (PSTR) model for BRIC countries (Brazil, Russia, India and China) over the period 1960-2006. Their results suggest that excessively high economic growth is a curse for environmental quality, and they advocated for energy conservation policies in order to reduce unnecessary wastage of energy for energy - dependent BRIC countries. Confirming the possibility of the existence of an N-shape relationship, Karnjana[21], examines the relationship between CO2 emission and gross domestic product, using panel data with fixed effects specification among 63 countries for the selected years 1990, 1995 and 2000. His result reveals that inverted U-shape relationship appears only in the short run; once the threshold is reached in the long run, the relationship between per capita GDP and CO2 emission becomes positive, thereby contradicting the EKC hypothesis. He concludes that clean environment cannot be achieved only by promoting economic growth. Hence, policy makers should integrate environmental protection into economic development policies. In a related study, Hamilton and Turton[15] employ decomposition analysis to examine the factors contributing to changes in emissions in the OECD countries between 1982 and 1997. The results indicate that changes in emissions are a result of changes in contributory variables such as energy intensity, structural change and economic output. Their study further reveals that growth in emissions is largely driven by economic growth, but in the long run the growth in emissions is offset by a decline in energy intensity due to improved technology achievable through growth in income.In another study, Joseph[20] tests the Environmental Kuznets Curve (EKC) hypothesis using panel data methodology on the relationship between carbon emission and GDP in Ghana, Nigeria, and Sierra Leone over the period 1970-2006. The result reveals that pooled ordinary least square (OLS) is in consonance with EKC, while the fixed effects results were at variance with the applicability of EKC in West Africa. He therefore considers the enactment of different policy options as a necessary condition to ensure efficiency in energy use and reduction in carbon emissions. Usenobong et al[45] investigate the relationship between economic growth and environmental degradation in Nigeria using the autoregressive distributed lag model. Their findings indicate that manufacturing sector has a positive relationship with CO2 emissions while the service sector impacts CO2 emission negatively in both the long run and short run. The result of the indicators for the trade openness further confirms the earlier result by Machado[25). Based on their findings, they recommend that Nigeria should look beyond the EKC notion that economic growth is the only way out of environmental degradation.
3. Materials and Method
3.1. Source of Data and Description of Variables
- The data set encompasses a balanced panel of 11 West African countries (Cote D’ivoire, Ghana, Senegal, Burkina Faso, Mali, Sierra Leone, Gambia, Nigeria, Benin Republic, Niger and Togo) over the period 1970-2011. The period and countries considered were informed by the availability of data. The total observations are 462 which were obtained from the World Development Indicators (WDI)[46] database. Economic growth was captured by GDP per capita; Money Supply (M2) was employed as a proxy for macroeconomic policy; while population was employed to capture the impact of population size on CO2 emission and consequently on the environment. We also assessed the possibility of including some new covariates that literature has never controlled for and which can be relevant in the context of a developing region like West Africa. This is particularly the case with domestic credit to private sector which has been included. No previous paper, to the best of our knowledge has controlled for this. There is no complete data set for variables such as energy intensity/consumption and agriculture’s share of value added to GDP. Including them would have compelled us to truncate the whole data set and eliminate important countries in West Africa such as Nigeria, Niger and Senegal. Other covariates such as foreign direct investment were also excluded due to the non-availability of data for many countries such as Burkina Faso, Gambia, Mali, Niger and Sierra Leone. The non-inclusion of these covariates does not impair the results and the conclusions reached in the paper, while the variables employed were sufficient to demonstrate the objective of the study, that of establishing the empirical relationship between CO2 emission and economic growth in West Africa.Gross domestic product (GDP) per capita, Money Supply (M2) and population (POP) were transformed into logarithms. Data on domestic credit to private sector (DC) is as (% of GDP) while openness is the sum of imports and exports as a proportion of GDP. All the computations were carried out using EViews Version 7.1 econometric package.We initially used the fixed and random effects approach to estimate the pooled regression model and employed the Hausman test to select the most appropriate model. Using the fixed effects model, we estimated a linear relationship between CO2 (the dependent variable) and the explanatory variables. The fixed effects model is an OLS regression which includes a dummy variable for individual countries, while eliminating country effects and controlling for the omitted variables on the estimated coefficient. Due to possible serial correlation in the residuals, the model was constructed to account for lagged values of the variables, with the choice of lags dictated by the Schwarz information criterion. Based on the objective of the study, emphasis is on the single regression equation of all the countries in the region.
3.2. Model Specification
- Following the extant literature, a model is specified which relates CO2 outcome to key macroeconomic determinants. The empirical pooled regression model of the determinants of West Africa’s carbon emission outcome is presented as follows:
 | (1) |
3.3. Model Estimation Procedure
- The stability properties of the variables employed in the study were first examined with a view to determining their stochastic properties, to facilitate the determination of the appropriate econometric framework. Four pool unit root tests were conducted in the present study, i.e. ADF- Fisher, PP-Fisher, Im, Pesaran & Shin, and Levin, Lin & Chu.The test for unit root for a variable A is carried out using the following specification:
 | (2) |
 ,
,  ,
,  and λ1, .. λp are parameters to be estimated, and εt is the Gaussian white noise disturbance term. The test of cointegration using the Johansen Fisher panel cointegration test framework follows the unit root tests, after which the cointegration is examined. The existence of cointegration among a set of time series variables implies the existence of an adjustment mechanism. This adjustment was executed through a vector error correction model (VECM). The unrestricted error correction model which follows the order of the specification of equation 1 is presented in equation 3:
 | (3) |
 : i = 1,…7 are the short-run dynamic coefficients, while the parameters
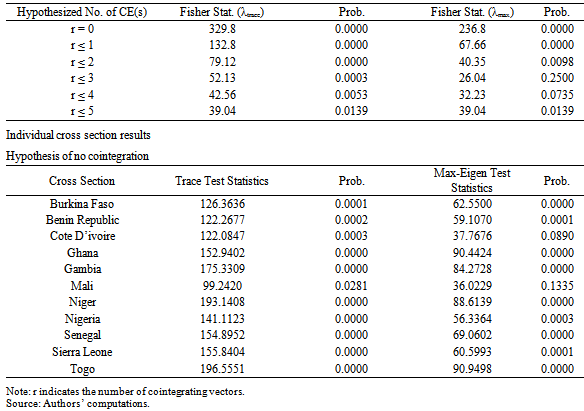
  : i = 1, …6 are the long-run multipliers. In equation 3, the left hand side is expressed in first differences of the dependent variable, while on the right-hand side, an optimum lagged differences of the six variables and the one-period lagged error term of the cointegrating equation is included. Employing the VECM framework, there are two sources of causation, i.e. from the ECM term and through the lagged dynamic terms. Consequently, we carried out three causality tests i.e. the short-run Granger non-causality test, the long-run causality (the weak exogeneity test) and the overall (the strong exogeneity test). To test for long-run non-causality, the null hypothesis that the coefficient of ECMt-1 is zero is tested in equation 3 against the alternative hypothesis ECMt-1 ≠ 0, in order to determine whether the regressors Granger cause CO2. Testing for short-run Granger non-causality involves setting the coefficients of all order-lagged differences of the variables on the right-hand side equal to zero. In equation[3), a test for short-run non-causality from GDP to CO2 is carried out by investigating whether the coefficients of the lagged differences of the GDP are all equal to zero. The overall causality is conducted by jointly setting all the coefficients of the right-hand side variables including the coefficient of the error correction term equal to zero. All tests of causality were conducted through the Wald test. The model was estimated using a maximum of 2 lags. The lag selection was based on the Schwarz Bayesian Criterion (SBC). Following General to Specific (GETS) procedure, the parsimonious pooled regression results are presented.
 4. Results and Discussions
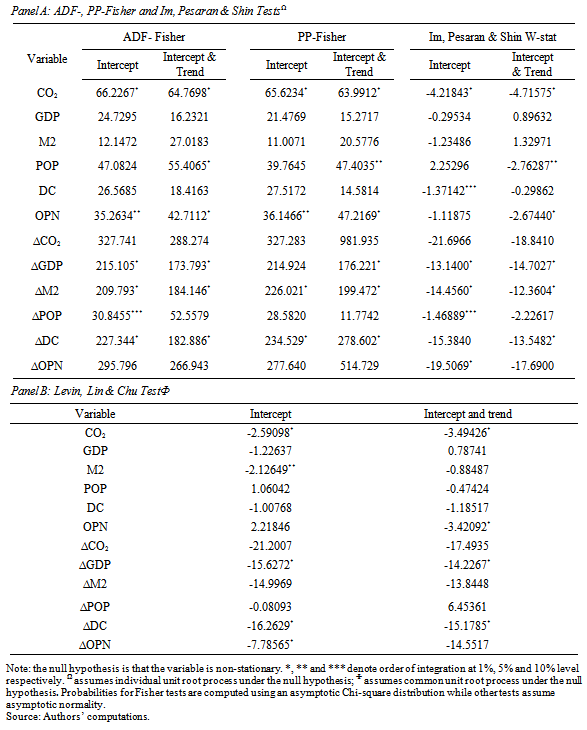
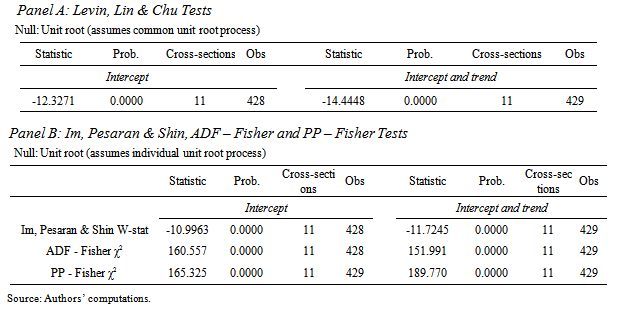
- The results of panel unit root tests are presented in Table 2.Results in Panel A of Table 2 suggest that CO2, POP and OPN tend to be stationary in level while GDP, M2 and DC are stationery in first difference in the ADF, PP and Im, Pesaran and Shin tests respectively. The results of the Levin, Lin & Chu Test in Panel B suggest that CO2 and M2 tend to be stationary in levels; GDP, DC and OPN are stationary in first difference, while OPN does not appear to be stationary either in levels or first difference. When results in both panels are combined, they tend to suggest that the variables employed are integrated of different orders. If the test of cointegration confirms a long-run equilibrium relationship among the variables, the use of the variables in their levels is appropriate in estimation.
|
|
4.1. Long-run Estimates
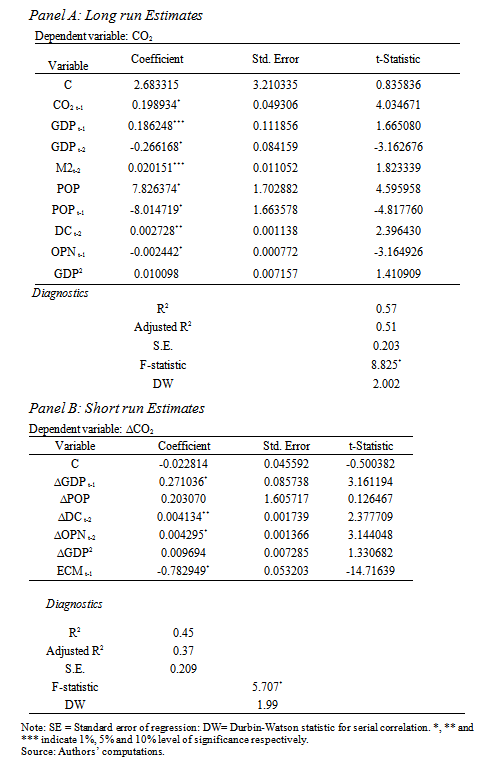
- In Pane A of Table 4, the estimated long run results are presented. One lagged period CO2 emission is positively related to current levels and is statistically significant at the 1% level. Consequently, past levels of emissions are detrimental to the environment. Economic Growth: The relationship between CO2 emission and GDP is positive, suggesting that higher levels of economic activities lead to higher incidence of CO2 emission and consequently to environmental pollution and degradation. A priori, real GDP (which measures the average level of wealth and economic activities) is positively related to CO2 emission at the initial levels of development, as it is the case for West African economies which are all categorised as developing countries. Consequently, the drive for development is expected to lead to increases in the emission of dangerous toxic gases associated with production and other economic activities. The coefficient of one-lagged value gross domestic product is highly statistically significant at the 10% level, implying that CO2 emission in West Africa is especially explained by the drive towards growth and development, the implication of which is that environmental degradation in the region progressively increases with increases in economic growth. Thus, it can be inferred from the results that higher level of growth significantly affects CO2 emissions in the region.
|
4.2. Short-run Estimates
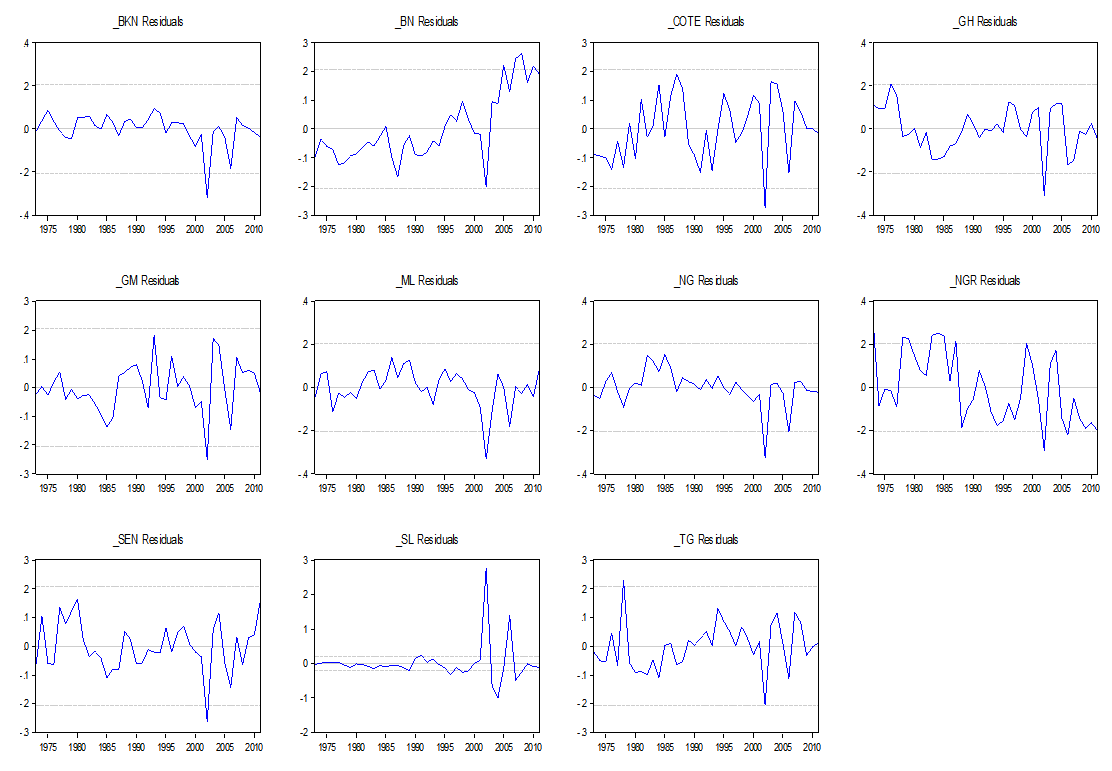
- Economic Growth: For the error correction representation, the coefficient of gross domestic product is statistically significant at the 1% level, while satisfying a priori expectation. It is therefore evident that economic growth is a positively related and significant determinant of CO2 emissions in both the long and short run in West Africa. Population Size: The coefficient of population size is positively related to CO2 emission and is not statistically significant, indicating that population size and its growth are not a statistically significant factor explaining the levels of CO2 emission in West Africa in the short run.Domestic Credit to the Private Sector: The coefficient of DC is positively related to CO2 emission and statistically significant at the 5% level. This suggests that production activities carried on in the private sector within the region influence the levels of CO2 emission and consequently impact the environment negatively.Openness: The short run coefficient of OPN indicates that CO2 emission and openness are positively related, suggesting that in the short term, higher degrees of trade openness in the region is associated with higher CO2 emission. This result is plausible, given that in the short and medium terms, developing countries need to depend on domestic production for subsistence due largely to low income levels, with greater pressure on the environment in the midst of rising population and relatively high poverty levels.Turning Point: The coefficient of the square of GDP per capita is positive and not statistically significant. Results from the long-run estimates indicate a non-statistically significant intercept term, a positive coefficient of GDP and a GDP2 coefficient that is approximately zero, though not statistically significant. The results tend to indicate a U-shape relationship between income and environmental degradation, but when they are subjected to a priori expectations (statistically significant coefficients), support for the U-shape relationship tends to be very weak. It is therefore reasonable to conclude that in the short run economic growth would tend to induce higher CO2 emission. Following the suggestion by Narayan and Narayan (27) on the examination of the EKC hypothesis based on the short- and long-run income elasticities, our results indicate that there is no evidence that CO2 emission has fallen with a rise in income over the period of study. From the empirical results, the long-run income elasticity is higher than the short-run income elasticity, a possible indication of the invalidity of the EKC hypothesis for West Africa.The estimated lagged error correction term (ECM) is negative and highly statistically significant, a result that lends credence to the cointegration among the variables under investigation. The feedback coefficient of -0.78 suggests that about 78% disequilibrium is corrected in the current year. Consequently, when CO2 is above or below its equilibrium level, it adjusts by approximately 78% within the first year to ensure full convergence to its equilibrium level. The Durbin-Watson statistic of 1.99 is a reasonable indicator of the absence of serial correlation in the residuals. The test of unit root on the pooled residuals and the plot of the residuals for each country indicate the acceptance of the null hypothesis of no autocorrelation (see Appendices A and B). The F-statistic (5.707) and its associated probability value indicates that all the variables in the model are jointly significant in explaining the level of CO2 emission in the short-run.
4.3. Causality Test Results
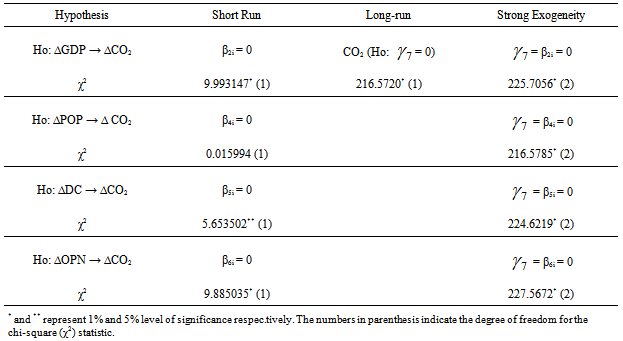
- The Vector Error Correction Model (VECM) non - causality test results are presented in Table 5. The results of the short-run non-causality in Table 5 show that with the exemption of POP (representing population size), GDP (representing economic growth), domestic credit to the private sector (DC) and OPN (representing trade openness) Granger cause CO2 (carbon dioxide emission) and that they are statistically significant at the 1%, 5% and 1% levels respectively. For the long-run non-causality, the null hypothesis that CO2 emission does not Granger-cause other variables in the system is rejected and is statistically significant at the 1% level. The overall causality in the system (the strong exogeneity) indicates that the null hypothesis that economic growth does not Granger cause carbon dioxide emission is rejected at 1% level of significance. In addition, the results indicate that population, domestic credit to the private sector and openness Granger-cause CO2 emission and that they are statistically significant at the at 1% level.
5. Conclusions
- This paper aimed at empirically examining the relationship between CO2 emission and economic growth in West Africa over the period 1970–2011. The study utilized the Fixed Effects Panel regression Model within a vector error correction framework. The empirical results indicate that there is a long-run equilibrium relationship between CO2 emission, economic growth, macroeconomic policy, population size, domestic credit to private sector and trade openness. The estimated results of both the long- and short-term indicate that economic growth, population size, domestic credit to private sector and openness are statistically significant variables explaining the variation in CO2 emission. Macroeconomic policy (proxied by M2) although significant in the long run is not statistically significant in the short run, while population size is significant only in the short run as determinants of CO2 emission in the region.The short-run non-causality results show that economic growth, domestic credit to the private sector and trade openness Granger-cause carbon dioxide emission and are statistically significant. This is amply supported by the overall causality in the system, the result of which provides evidence that the null hypothesis that other variables in the system do not Granger-cause CO2 emission Granger-causes is rejected at the 1% level. The strong exogeneity tests indicate that economic growth, population, domestic credit to the private sector and openness Granger-cause CO2 emission at the at 1% significance level. A major finding is that the EKC hypothesis is not supported for West Africa. Instead, an N-shape relationship was established, implying that pollution would tend to increase when a country is in the early stages of development, and decreases once the threshold GDP is reached, and then begins to rise as national income continues to increase.Overall, the implication of the study is that the imperatives of economic growth, the nature of macroeconomic policy, rapid population increases, in addition to the amount of financial resources to the private sector and degree of trade openness are responsible for increased CO2 emission and consequently on the degree of environmental hazards in the region, and that these must be considered in the formulation and enactment of policies relating to the environment. From the foregoing, it is not in doubt that West Africa needs growth and development in order to solve the myriad of problems ranging from poverty to unemployment ravaging the region. It is equally noteworthy that while growth and development should be given priority, the environment needs to be protected against avoidable degradation. Although growth in CO2 emissions is largely driven by economic growth, improvement in the technology can be helpful in the long run to offset emissions occasioned by a decline in energy intensity in an environment of higher income. It must be maintained that the promotion of economic growth is not the only avenue for achieving cleaner and sustainable environment. Consequently, development policies which integrate environmental protection issues would be helpful in the region. The empirical results indicate that changes in CO2 emissions are a result of changes in contributory variables such as economic growth, population size, in addition to domestic credit to the private sector and trade openness. In the light of this, it is recommended that while the pursuit of economic growth is sustained, it is important that policies which enhance the quality of the environment, taken into account all contributory factors be enacted and implemented among the countries in the region.
|
APPENDIX A
- Pool Residual Unit Root Test Summary
 Abstract
 Reference
 Full-Text PDF
 Full-text HTML