-
Paper Information
- Next Paper
- Previous Paper
- Paper Submission
-
Journal Information
- About This Journal
- Editorial Board
- Current Issue
- Archive
- Author Guidelines
- Contact Us
American Journal of Economics
p-ISSN: 2166-4951 e-ISSN: 2166-496X
2013; 3(6): 371-376
doi:10.5923/j.economics.20130306.19
Determine the Cost of Over Consumption for Energy based on Location and Income: A Case in Malaysia
 Abstract
 Reference
 Full-Text PDF
 Full-text HTML
Kwang Jing Yii1, Caroline Geetha1, Amran Ahmed2, Vivin Vincent Chandran1
1School of Business and Economics, Universiti Malaysia Sabah
2Deparetment of Deputy Vice Chancellor, Universiti Sultan Zainal Abidin
Correspondence to: Kwang Jing Yii, School of Business and Economics, Universiti Malaysia Sabah.
| Email: |  |
Copyright © 2012 Scientific & Academic Publishing. All Rights Reserved.
Energy subsidy is an important assistance to improve households’ wellbeing. It can be seen that the most significant amounts of subsidy go to energy subsidy. However, misallocation of energy subsidy may lead to over consumption and cause national deficit and eventually lead the country to bankruptcy. Therefore, the aim of this study was to determine who is the deserve subsidy recipient and which type of energy should subsidy be given. The study used cross sectional data collected from 385 respondents in each Sabah and Sarawak respectively using open-ended questionnaire. The study looked into the proportion of energy expenditure over monthly income, energy consumption pattern and calculating the cost of over consumption based on location and income groups. The findings showed that energy expenditure was the third largest usage over monthly income. The energy consumption pattern referred to multiple fuel model where households preferred to use combination of energy. The highest cost of over consumption in Sabah accounted to electricity meanwhile households in Sarawak led the most wastage in diesel consumption.
Keywords: Energy subsidy, Monthly expenditure, Consumption pattern, Cost of over consumption, Malaysia
Cite this paper: Kwang Jing Yii, Caroline Geetha, Amran Ahmed, Vivin Vincent Chandran, Determine the Cost of Over Consumption for Energy based on Location and Income: A Case in Malaysia, American Journal of Economics, Vol. 3 No. 6, 2013, pp. 371-376. doi: 10.5923/j.economics.20130306.19.
Article Outline
1. Introduction
- For the most of last century, Malaysian government had a great deal of leeway in administrating an effective and efficient subsidy allocation mechanism. But the deficits had consistently exceeded the figure forecast since 1999. Malaysia’s subsidy bill was severe when it comprised 15 percent of the entire national budget in 2009 which amounted to RM12,900 worth of subsidy per household ([1]). In 2013, the government has allocated almost RM47 billion for various type of subsidies, incentives and assistances including subsidies for petroleum products, food, health, agriculture and fisheries, utilities, toll, welfare and education. Among the total amount of subsidies given, the largest allocation was distributed to fuel and energy which comprise of RM24.8 billion or 53 percent ([2]). Malaysia government has been employing universal subsidies scheme to distribute energy subsidy where all segment of society like high income group, businessman and foreigner can enjoy it. This caused the unsustainable and consistent energy subsidy figures to keep increasing and finally may lead to bankruptcy for the nation. The symptom can be viewed when the national debt of Malaysia stood at 53.4 percent of GDP (RM455.7 billion) in 2001 and it remained as high as 54.8 percent (RM503.2 billion) in 2012 ([3]). However, energy subsidy cannot be totally removed as long as there is a government and it fulfils its role in collecting tax from its citizen. Therefore, the government should decide what type of energy should be given subsidy and who should receive it. Besides, based on energy ladder model, households may switch their energy consumption from traditional to modern energies as the countries develop and incomes increase ([4]). On the other hand, multiple fuel model revealed that households in developing countries do not switch from traditional to modern fuels but favour in using combination of fuels depending on the characteristics of the household itself ([5]). The behaviour to use certain energy can be influenced by the subsidy distributed. Therefore, measures should be taken to evaluate the energy consumption pattern with and without subsidy distribution. This study concentrates on the state of Sabah and Sarawak in Malaysia instead of Peninsular Malaysia. This is due to large of disparities in terms of geographical location, socio-economic factors, economic activities, affordability, demographic structure and infrastructure. For instance, the separated physical entity between Peninsula Malaysia with Sabah has made the Malaysian government unable to constitute a single entity in the infrastructure planning ([6]). Besides, Peninsular Malaysia is more densely populated than Sabah and Sarawak ([6]). Meanwhile electricity grid in Sabah was found to be much smaller than Peninsular Malaysia ([7]). According to Department of Statistics Malaysia, Sabah topped the list with 19.7 percent poverty rate among all the states in Malaysia in 2009 meanwhile Sarawak ranked at the third position with 5.3 percent. Nevertheless, the poverty line income for Sabah and Sarawak were RM1,048 and RM912 respectively which were higher compared to RM763 in Peninsular Malaysia[8]. Therefore, study was carried out in Sabah and Sarawak to determine whether the objective of energy subsidy distribution to the eligible household was achieved. Meanwhile the cost of over consumption was also being identified to enable the redistribution of national resources which encourages economic diversification and infrastructure development.
1.1. Research Objectives
- The specific objectives of this study are stated as follow:-a. To estimate the monthly expenditure for various types of consumption over the income earned per household in Sabah and Sarawak based on location and income group.b. To determine the consumption pattern for each type of energy consumed in Sabah and Sarawak based on location and income group.c. To estimate the cost of over consumption for each type of energy consumed in Sabah and Sarawak based on location and income group.
2. Literature Review
2.1. Energy Demand Theories
- Energy Ladder Model explains the movement of energy consumption from traditional sources to more sophisticated sources along an imaginative ladder with the improvement in the economic status of households especially in terms of income ([11],[12],[13]). Besides, households in developing countries are discovered not to switch to modern fuels but favour in using combination of fuels. This fuel usage method is known as multiple fuel model ([5]). According to[14], households shift to multiple fuels with increasing income in a bidirectional process. The separate and existing factors simultaneously push households away from solid fuels and pull them back towards solid fuels again. The “push” factors include cleanliness, more convenience and status meanwhile the “pull” factors refer to food flavour, insufficient of modern devices and demand for new skills.
2.2. Previous Studies on the Effect of Subsidy on Energy Consumption
- Descriptive analysis was carried out by[15] to determine the level of the affordability of electricity cost for poor urban households in Zimbabwe. The data collected were monthly energy consumption with and without subsidy, income categories, and energy budget from the total household expenditure. The findings revealed that different household income had different ability to pay. Large portion of the urban poor income earners were devoted to energy expenditure compared to the non-poor on non-electrical energy. Energy cost incurred by the poor on non-electrical energy sources could cover the current subsidized electricity costs. Reference[16] also used the price with and without subsidy to examine the effect of subsidies on kerosene and electricity affordable among Ethiopian urban households. The mean energy budget was used as proxy for purchasing power. The energy sources were considered affordable if mean energy budget was found greater than the estimated energy costs. The results indicated that both poor and non-poor households still afford to purchase kerosene when subsidy was removed. Meanwhile, electricity was extra expensive until subsidies did not bring the impact to the poor households. Thus, amortization should be given to the poor for purchasing equipments or paying electricity bills. Moreover,[17] measured the impact of reducing subsidies on the welfare and the consumption of the poor in India. The findings showed that 86 percent of the rural households used biomass energy while the urban people preferred to use modern fossil fuel as main energy source. The percentage of kerosene used declined as the total consumption expenditure increased but the fall was small for the rural area. At the higher expenditure level for rural area, the usage of kerosene was mainly for lighting. In the urban area, the higher expenditure was directed to the use of LPG. This clearly indicated that kerosene and LPG subsidies do not benefit the rural households but favoured urban households. The study of[18] showed that energy subsidies in Trinidad and Tobago were mainly distributed to gasoline and diesel. The share of GDP to energy subsidies had increased from 0.66 percent to 1.9 percent within year 2005 to 2009. The findings also revealed that 95 percent of gasoline subsidy and 73 percent of diesel subsidy were allocated to ground transport. This is due to government aimed to increase the consumers’ disposable income and enable life affordable. Furthermore,[19] claimed that the fuel subsidy was encouraged to be removed to increase economy efficiency in the long run. However, consumers will face the problem of raising fuel price in the short run. Energy demand was reduced averagely by 7 percent as energy price increased since 1991. This leads to the conservation and sustainability of energy resources.
3. Methodology
- A descriptive survey study carried out utilizing cross-sectional data to determine the consumption of various type of energy in Sabah and Sarawak based on location and income group. The research instrument used was a questionnaire with open-ended questions.
3.1. Source of Data
- The areas covered in this study were the state of Sabah and Sarawak in Malaysia. The respondents were chosen based on probability sampling using two-stage cluster sampling method. Sabah (530,572 households[20]) was divided into 5 clusters meanwhile three clusters were established in Sarawak (540,990 households[20]). The respondents were further distinguished into urban or rural areas. Simple random sampling method was used to choose the representative districts. Lastly, the respondents are chosen randomly from the selected districts.
3.2. Method of Analysis
- Firstly, percentage of the monthly expenditure for various type of consumption over the income earned per household was estimated. The income group was distinguished into three groups where income RM3,000 and below denoted low income group, the middle income group referred to household who earned between RM3,001 and RM6,000 and the high income group were those with income RM6,001 and above ([21]). Secondly, the quantity of monthly energy consumption was illustrated to determine the pattern of consumption. Lastly, the quantity of over consumption for each type of energy was calculated by subtracting the quantity consumed with subsidy and without subsidy. When the quantity of over consumption multiplied with the subsidy given, the cost of over consumption for each type of energy can be estimated.
4. Findings and Discussion
4.1. Monthly Expenditure over Income per Household
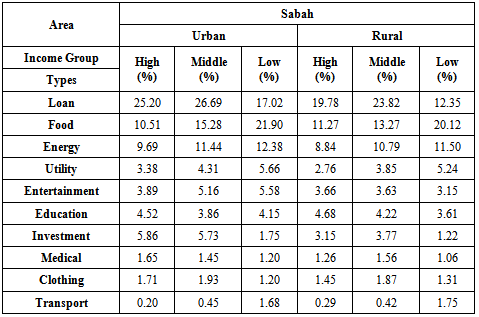
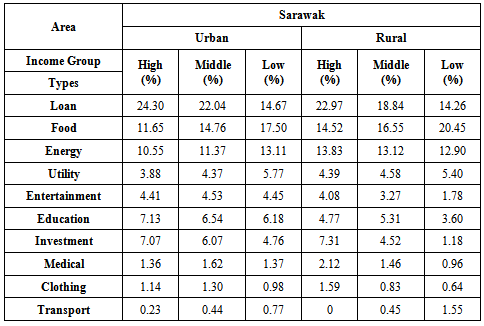
- Table 1 and Table 2 showed the monthly expenditure for various types of consumption over the income earned per household in Sabah and Sarawak respectively based on location (urban and rural) and income group (high, middle and low). In Sabah, loan instalment occupied the highest proportion of income which covered over 20 percent of monthly income among high and middle income groups in both urban and rural areas. Urban household found be paying out higher on loan instalment like housing loan and car loan compared to rural households. The situation was similar in Sarawak. This indicated that urban people were concern about their dwelling place and the convenience of transportation. This was followed by food expenditure. In contrast, the low income group spend most on food expenditure in both Sabah and Sarawak. Due to the limited affordability of their income, food was the first preferred because it was a basic requirement of life.
|
|
4.2. Energy Consumption Pattern
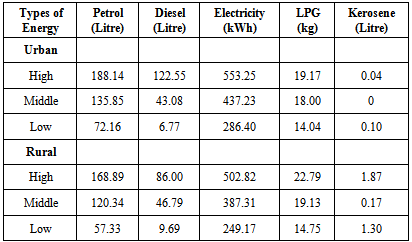
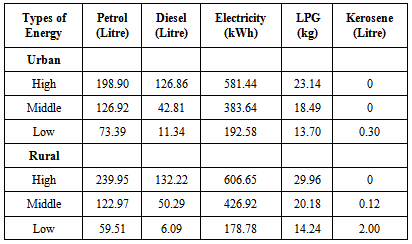
- Table 3 and Table 4 showed the quantity of consumption for each type of energy consumed with subsidy per household in Sabah and Sarawak. The quantity of all energy consumption decreases in both states when the subsidy was removed. This fulfilled the law of demand where the demand for the commodity will fall when the price of the same commodity increased.
|
|
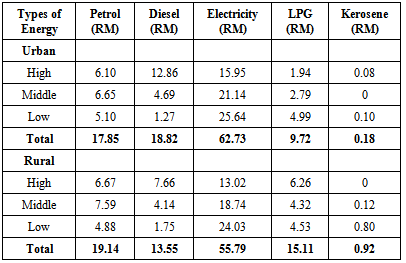
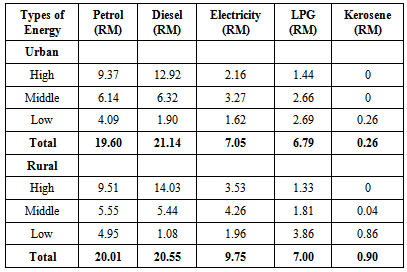
4.3. Cost of Over Consumption
- Table 5 and Table 6 showed that the cost of over consumption per household for each type of energy based on location and income group in Sabah and Sarawak respectively. According to Table 5, the highest cost of over consumption in Sabah was accounted to electricity with RM62.73 and RM55.79 per household in urban and rural areas respectively. Surprisingly this indicated that low income group was considered as the main group of over consumption for electricity. Low income group achieved 40 percent of the total amount in urban while 43.07 percent in rural. This finding showed that electricity subsidy did not carry out the true assistance to both urban and rural households which was similar to the study of[16] in Ethiopia.
|
|
5. Conclusions
- In this study, energy expenditure was found to be the third largest usage over monthly income in both states. This showed that subsidy should be distributed to energy since it was an important commodity for households. Besides, the energy consumption either with or without subsidy in both states referred to multiple fuel model where all income groups preferred to use combination of energy. With this, energy subsidy can be the “pull” or “push” factor to affect households in using the type of energy. Furthermore, the cost of over consumption in Sabah indicated that subsidy given to electricity should be removed or reduced since enormous wastage was found. Meanwhile it was seen that most of the over consumption for petrol and diesel was caused by high income group in both states. For diesel, low income group consumes only a small portion of total consumption. Therefore, diesel subsidy was considered to be reduced since it always benefited the high income group. On the other hand, the over consumption for LPG was caused by low income group, thus LPG subsidy should be recommended to remain due to its objective in helping poor.