Nariman Mohd-Saad
Department of Economics, Finance and Banking, College of Business, Universiti Utara Malaysia
Correspondence to: Nariman Mohd-Saad, Department of Economics, Finance and Banking, College of Business, Universiti Utara Malaysia.
| Email: |  |
Copyright © 2012 Scientific & Academic Publishing. All Rights Reserved.
Abstract
Water has a high intrinsic value and has been referred to as blue diamond. Water is an important input in the production process of the industry and also to daily life of household. By that, the state-owned operators of water supply in the Northern Corridor Economic Region (NCER) should be efficient in supplying water to companies operating and household in their respective states as well as to promote growth in the state’s economy. This paper therefore examines and compares efficiency among state-owned water operators in NCER, Data Envelopment Analysis is used to evaluate the efficiency of among state-owned water operators in Perlis, Kedah, Penang, and Perak. The study’s findings showed that Penang is the most efficient provider of water supply in the NCER.
Keywords:
Efficiency, DEA, State-Owned Water Operator
Cite this paper: Nariman Mohd-Saad, Efficiency of State-Owned Water Operator in Northern Corridor Economic Region of Malaysia, American Journal of Economics, Vol. 3 No. 6, 2013, pp. 358-364. doi: 10.5923/j.economics.20130306.17.
1. Introduction
NCER includes the states of Penang, Kedah, Perak and Perlis. Based on the latest state’s Gross Domestic Product, Penang and Perak can be considered as high income economies. Both states are led by the manufacturing sector. On the contrary, Perlis and Kedah are low-income income economies and steered by the agriculture sector. Thus, indicating imbalance development in the NCER’s state. In fact, the establishment of NCER is to address the uneven development in the region. Total investment in Malaysia is approximately RM34 billion in 2011. Of the total, NCER received 29% (or RM13 billion). Within the NCER, Penang recorded the highest inflow investment with RM7 billion, followed by Kedah (RM6 billion). Perak and Perlis each received investments of RM 90 million and RM 3 million far more less than Penang and Kedah.Local and multinational factories operating in the NCER need water in their production process without any interruption. In addition to industry, the state-owned water operators also supply water and services to households. NCER’s population is about 5.1 million in 2010 in which Penang has 1.5 million inhabitants, Kedah (2 million inhabitants), Perak (2.4 million inhabitants) and Perlis (0.2 million inhabitants), Consequently, the delivery system of water supply and services of state-owned companies have to be efficient to meet the demand of industry and households in their respective states. This is important to ensure industrial development sustainability, attract new investment, particularly investment from abroad and increase quality of life of by providing clean and treated water to households. Water supply coverage in NCER’s states for population in urban areas reached 100% in 2010. Except for Penang, water supply coverage in rural areas in NCER’s states reached 100%. Penang’s rural water supply coverage is 99.6%. State-owned water operator in NCER, includes: Kedah: Syarikat Air Darul Aman(SADA http://www.sada.com.my); Penang: Perbadanan Bekalan Air Pulau Pinang (PBAPP http://www.pba.com.my); Perak: Lembaga Air Perak (LAP http://www.lap.com.my); and Perlis, Syarikat Air Perlis (SAP http://jkr.perlis.gov.my/jkr).
2. State-Owned Water Operators
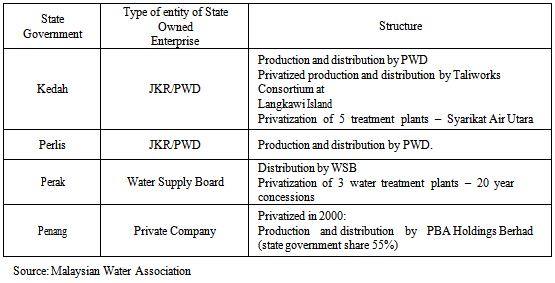
Main challenges for the water supply and service industry are: to deliver facilities or services of a high quality; to ensure an efficient and effective delivery system to meet the rising demand of industry and household; and to optimize the use of water resources and protecting the environment.Prior to the major restructuring of the water industry in Malaysia in 2006, the water supply and services is governed by the State Government’s Public Works Department (or Jabatan Kerja Raya, JKR). During the privatization era in 1980s, some state governments wholly or partly privatized their water supply and services Bhd. and managed the state’s water supply and services to industry and household. Perak’s state government adopted corporatization and created Lembaga Air Perak. However, Kedah partly privatize its water supply and services and therefore maintain its JKR entity. Perlis does not privatize its water supply and services. Table 1 shows type of state-owned water operators. Table 1. State-owned water operators before 2006
 |
| |
|
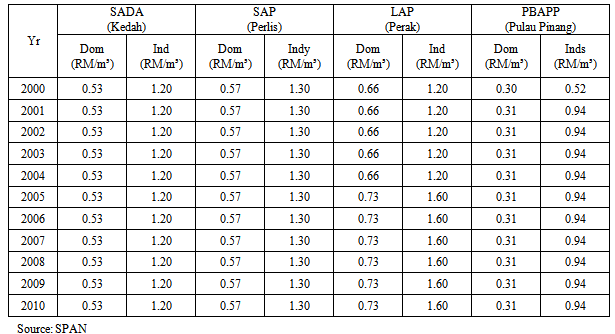
Each state-owned operator determined its own water policy and tariff rate. Differences in tariff rates are part of the efficiency indicators. Lower tariff rate shows that water operator is competent in managing water supply and services. Water operator is inefficient if tariff rate is high. Competitive tariff rate benefit the industry by lowering production costs. For households, the low price will lessen the cost of living.Based on Malaysian Water Association’s statistics[1], the average tariff rate imposed on domestic consumers is between 0:31 Sen/m3 to 0.90 Sen/m3. For industrial users, it is between 2.93 Sen/m3 to 0.90Sen/m3. Penang’s PBA Holdings Berhad) which is under private entity imposing the lowest tariff rate for both domestic and industrial users (see Figure 1). The difference in tariff rate and type of entity among state owned enterprise implies different levels of efficiency in the management of water supply and services to consumers.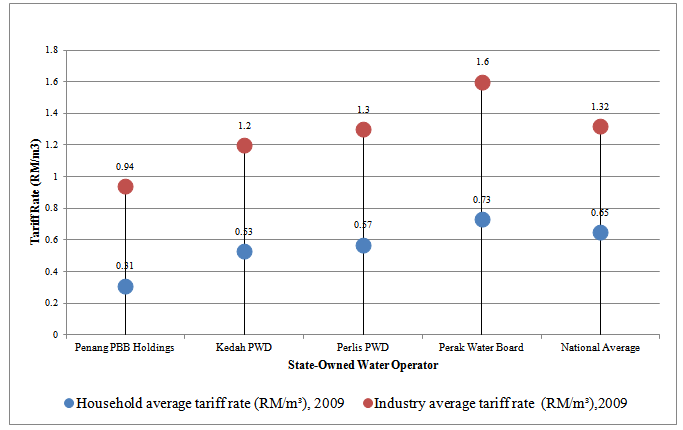 | Figure 1. Average tariff rate for industry and household, 2009 |
3. Methodology
Data Envelopment AnalysisWe used Data Envelopment Analysis (DEA) to measure efficiency among state-owned operators in the NCER. DEA is an analytical tool that can assist in the identification of best practices in the use of resources among a group of organizations. It is a mathematical programming production frontier approach and relative efficiency is measured in relation to the constructed frontier. The frontier is constructed using a piece wise linear combination that connects the set of “best practice observations” in the sample, yielding a convex efficient frontier.[2]The DEA model developed by Charnes et al[2] assumes constant returns to scale (CRS) under which the DEA derived input- and output-oriented measures of efficiency for DMU are identical. The CRS assumption can be relaxed and the DEA model can be easily modified to incorporate variable returns to scale (VRS)[3]. Various extensions of the CCR model have been proposed since the early introduction of DEA. Banker, Charnes and Cooper (BCC model)[3] has introduced its production frontiers spanned by the convex hull of the existing decision making units (DMUs) which lead to variables return to scale (VRS) characterization with (a) increasing return to scale at the first segment followed by (b) decreasing return to scale in the second fragment and (c) constant return to scale at the point where the transition from the first to the second segment is made[4]. DEA were used to develop empirical production frontiers that are used to evaluate observations representing the performances of all the entities or DMUs that are to be evaluated[4]. These DMUs are assumed to be homogeneous and repetitively perform the same function by utilizing similar inputs in order to produce similar outputs. Assume there are N firms (DMUs) using a vector of inputs (k) to produce a vector of outputs (m), based on the input oriented CCR model.Measure of efficiency of a particular firm is calculated as; min θiθ,λ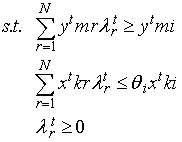 where, θ = is a scalar, λ = N*1 vector of constant, y = the amount of output m for DMU r at time t, x = the vector output k of DMU r which Ranges in r = 1,, n, at time t. The equation will evaluate the efficiency score for each production unit in sample (θ) and in search for the weights used by the identified efficient production units to construct the same output level as the ith production unit (λ). The calculation is repeated for n times once for each unit in the sample. The value of θ obtained will be the efficiency score for the r DMU where 0≤ θ ≤ 1. In case of θi has the value equal to 1 the DMU lies on the frontier and is fully efficient. If < 1, the firm is inefficient and needs a (1 – θi ) reduction in the inputs level to reach the frontier. Technical efficiency (TE) as measured by the DEA can be identified by using an input or output orientation. When using an input orientation, technical efficiency is measured as proportional reduction in input usage; with the output level is held constant. On the other hand when using an output orientation, technical efficiency is measured as a proportional increase in outputs, with inputs held constant. Under the assumption of CRS, the two measures will generate equal value while with an assumption of VRS, the results will differ. DEA does not require any specification of the functional form of the production relationship but develops a frontier relating inputs to outputs.
4. Findings
This study used input orientation assuming constant returns of scale (CRS). Input orientation model is used as the state government is only able to control OPEX and CAPEX in the water supply, while the number of water pipe and the total water consumption will depend on the number of inhabitants and users of which is beyond the control of the state government. While constant returns (CRS) is used because for water supply services industry they has the characteristics of a pure monopoly because there is no substitute product produced and its use is perfectly inelastic. So it assumes constant returns of scale by assuming each operator will achieve a constant rate of return if it is operating efficiently. Inputs used in this analysis consists of long water pipe (LENG) as a proxy to capital costs (CAPEX) and operating expenditure (OPEX). While the output is the number of connections (CONN) and total water consumption (CONS). Other studies related to the selection of input and output is like Thannasoulis[5,6] describe the distribution of water through the operating expenditure as inputs, while the number of connections, water pipe length and the amount of water used in the output. Lee and Hon[7] using the OPEX as input and output consists of total water use (proxy to the amount of water directed), the number of connections and long water pipeline. Coelli and Walding[8], using the number of connections and amount of water produced as output while operating expenses and long water pipe (proxy to capital) as inputs. Susila[9] using the operating expenditure (OPEX) and long water pipe as a proxy to capital costs (CAPEX) as inputs, while the quantity of water, the number of users and the output area. The data used in this study includes of: • Total consumption (cubic liters): CONS• The number of water pipe: CONN• The length of water pipelines (km): LENG• Operating expenditure (RM): OPEX
4.1. Water Operators’ Technical Efficiency Scores
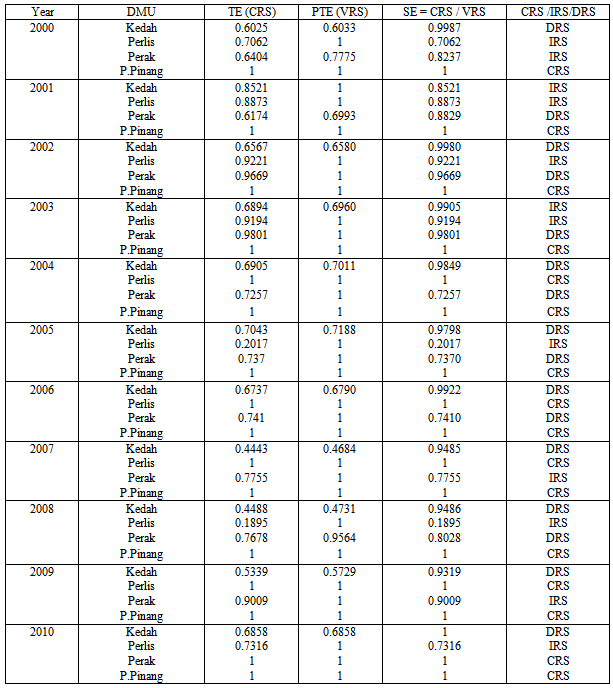
Technical efficiency score which can be divided into pure technical efficiency ( PTE) and scale efficiency (SE) scores. PTE is water operator’s efficiency due to the efficiency of its water supply and services, while SE scores are derived from inefficiency in the use of inputs relatively to outputs, which is either constant, increasing or decreasing scale. Over the period 2000-2010, DEA’s findings showed found that the average score of technical efficiency of water supply and services in Peninsular Malaysia is 71%. Thus, indicating that there is room for improvement in the technical efficiency of the state-owned water operators in Peninsular Malaysia. The average level of technical efficiency scores are between 0.66% and 0.80% (Figure 2). 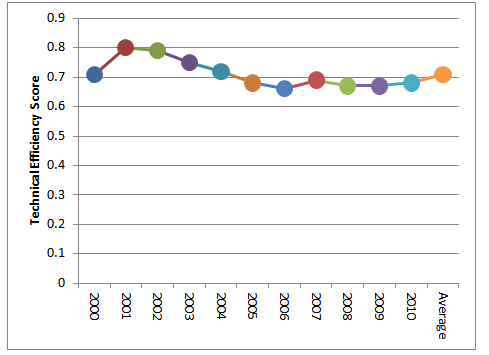 | Figure 2. Average technical Efficiency Score 2000-2010 |
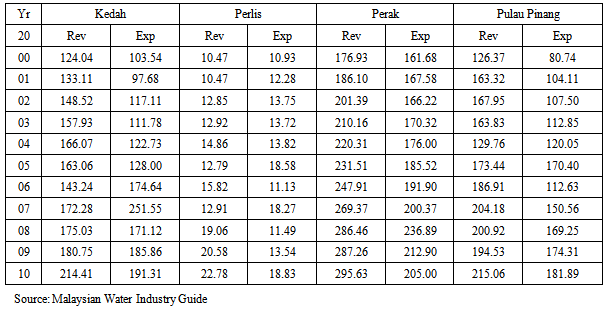
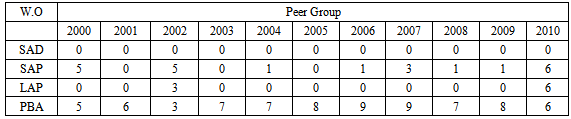
Among NCER’s states, Penang PBA Holding Bhd. has achieved technical efficiency scores of 1 for each year over the period 2000 to 2010. This shows that Penang is operating on the production boundary curve.Perlis PWD also reached technical efficiency score of 1 for selected the year 2004, 2006, 2007 and 2009. While the Perak Water Board achieved efficiency of 1 only in 2006. Kedah PWD does not even reach the technical efficiency score of 1 from over the study period. Kedah PWD however showed an increasing trend in the level of scale efficiency scores over the period 2000-2010.Level of technical efficiency scores is determined by the level of pure efficiency and scale efficiency scores. Susila study (2005) found that the inefficiency of state-owned operating under private operators is due to scale inefficiency and pure inefficiency of the government-owned operators (public).Pure efficiency (PTE) is measured by water use analysis assumes operators is on VRS and Penang once again reach the level of pure efficiency score during the first ten years. Based on 2010 only Perak and Penang are at a constant level of efficiency (constant) @ 1, this means that an increase in inputs will lead to an increase in output at a constant rate. While for Kedah, Perlis and Terengganu water supply for these states are in better condition that it is in increasing returns to scale.An increase in output exceeds the increase in input is also due to the increased efficiency in managing their water services. It will also be driven by the impact of the restructuring of the water supply by PAAB, SPAN and water management business which is monitored by SPAN and operators just to manage water without considering the capital cost burden because it will be dealt with solely by the PAAB.The study found that the level of technical efficiency scores also proved that water supply services operating under the private sector is much more efficient than under water corporation owned by the state. Efficiency of water services in Penang is also reflected by the low rate of water tariff for domestic tariff 0.31sen while industrial tariffs 0.94 sen compared with Perak where the domestic tariff rate is the highest at 0.73 cents and industrial tariff is 1.60 ( see table 2).According to Lee[10] domestic water tariff has been subsidies by industrial tariffs. This is because the industrial tariff rate is higher than the domestic tariff. Penang is also one of the favourite focus for foreign investment and hence the revenue from this industry will be able to accommodate many household tariffs. In this way the state could reduce the financial burden of the state and low water tariffs can be implemented.This shows that Penang is operating on the production boundary curve. Perlis PWD also reached technical efficiency score of 1 for selected the year 2004, 2006, 2007 and 2009. While the Perak Water Board achieved efficiency of 1 only in 2006. Kedah PWD does not even reach the technical efficiency score of 1 from over the study period. Kedah PWD however showed an increasing trend in the level of scale efficiency scores over the period 2000-2010. Low water tariffs in Penang is also further supported by its low NRW rates with an average of 19.6%, as compared to other states in Malaysia. The reduction trend in NRW in Penang can be clearly seen from 2000 with 23% goes down to 18.2% by 2010. NRW reduction has to do with the awareness and concern from the community about the importance of water. As well as being driven by increased control and monitoring of the state water authority in the affected areas.NRW rate reduction also contributed to improved water revenue and decrease operating costs. Thus Penang has recorded the state of the highest profit compared to other states in its water supply. Table 4 below shows the total expenditure and the results obtained for selected states for the period 2000 to 2010. Penang and Perak showed a surplus or profit in their water supply.Scores of technical efficiency in the management of water supply in Penang is driven by the lowest NRW rate compared to other states. NRW rate is low due to the influenced by the use of different types of high quality pipes which meet the specifications set by SIRIM and water pressure controlled.Benchmark in the DEA analysis will be determined by which the state has been referred by other state. In this study, water operators in Penang has been used as a benchmark based on the number that has been referred and the level of technical efficiency scores. From year 2000-2010, Penang has been referred by 75 times followed by Perlis water operator 23 times. Refer to Table 5.Table 2. Technical efficiency, Scale Efficiency and Pure Efficiency Score
 |
| |
|
Table 3. Average Domestic Water Tariffs and Industry
 |
| |
|
Table 4. Revenue and Expenditure of Water Supply (RM million)
 |
| |
|
Table 5. Peer Group for water service Industries from 2000-2010
 |
| |
|
5. Conclusions
Empirical studies show that water operators PBAPP (Penang) achieved the highest efficiency scores for level of technical efficiency scores and scale efficiency scores compared to other water supply operators in the study. PBAPP operator has been chosen as a benchmarking for the management of water supply services. High efficiency score in Penang has been proved in water tariffs charged to domestic consumers is the lowest in Malaysia. Similarly to its NRW which are the lowest in Malaysia over water operators in other states. In terms of policy implications, water supply operators in other states may adopt policies and strategies as Penang experience in the management of water supply services to consumers. Penang experience management approach from the angle of demand and supply. From the demand side, Penang experience encourage consumers to use water more efficiently through Sustainable Water Management Program (AQUASAVE) which was implemented in June 2010. AQUASAVE program focuses on companies, institutions, industries, hotels, educational institutions, government departments and non-business organizations and other businesses. Penang experience by impose surcharge on water users if they used more than the limit which has been determined by the Conservation Surcharge (WCS) in November 2010. Under the WCS of RM0.24 per 1000 liters for the use of more than 35,000 liters of water a month to curb domestic waste. Penang became the first state to impose a surcharge on domestic consumers who use excess water. WCS is AQUSAVE programs and awareness programs aimed at encouraging consumers to use water more prudent because Penang is known as water stressed state. Since Penang has been known as an industrial state among NCER state’s the demand for water also increase due to the inflow of MNC to the state which require high water in the production process of goods and services. AQUSAVE program was imposed to ensure sustainable water supply in the future. Water consumption in Penang is 285 liters / capita / day (lcp) above the national benchmark while compared to Singapore is only 158 lcp. The level of users among Singaporean is the 4th lowest compared to the states in Malaysia. Thus, the uncontrolled use of water by consumers can lead to water stress situations in the future.From the supply side, although NRW Penang experience is lowest among water operators in Malaysia, Penang experience continued with efforts to implement the initiative to reduce its NRW. Traditional practices during NRW management is to reduce the rate (%) between the NRW water treatment plant to the water meter position business premises. Penang experience focused reduction rate (%) NRW upstream (ie at the level of the catchment area and raw water supply system) and downstream (such as in the internal reticulation system for high-rise buildings).
References
| [1] | Malaysia Water Association. “Malaysia water industry guide”, 2001-2011 Kuala Lumpur: Malaysia, 2001-2011. |
| [2] | Charnes, A., Cooper, W.W., and Rhodes, E. “ Meas-uring the Efficiency of Decision Making Units”. European Journal of Operational Research, 2, 429–44Measuring the Efficiency of Decision Making Units, 1978. |
| [3] | Banker, R. D. Charnes, A. and Cooper, W.W.” Some Models for Estimating Technical and Scale inefficiencies in Data Envelopment Analysis”, Management Science, 30, pp. 1078-92,1984. |
| [4] | Cooper WW, Seiford LM & Shu J, “DATA ENVELOPMENT ANALYSIS” History, Models and Interpretations in Cooper WW, Seiford LM & Shu J (Editors) Handbook on Data Envelopment Analysis, Kluwer Academic Pulblisher The Netherlands.n Journal of Operational Research, 2, 429–44,2004. |
| [5] | Thanassoulis, E. “ DEA and its Use in the Regulation of Water Companies”. European Journal of Operational Research, 127, 1 – 13,2000a. |
| [6] | Thanassoulis, E. “ The Use of Data Envelopment Analysis in the Regulation of UK Water Utilities”: Water Distribution. European Journal of Operational Research, 126; 436-453, 2000b. |
| [7] | Lee, C. “Social Policies and private sector participation in water supply – the case of Malaysia”. United Nations Research Institute for Social Development, mimeo,2007. |
| [8] | Colelli,T.J.and S.Walding, “ Performance Measurement in The Australia Water Supply Industry: A Preliminary Analysis ” in Coelli, T.J. and D. Lawrence (eds). 2006 . Performance Measurement and Regulation of Network Utilities, Edward Elgar Publishing, Cheltenham.2006. |
| [9] | Susila Munisamy. “Efficiency and Ownership in Water Supply” : Evidence from Malaysia,2009. |
| [10] | Lee, C, “Water Tariff and Development: The Case of Malaysia”, Working Paper No.117, Centre on Regulation and Competition, University of Manchester, 2005. |
 Abstract
 Reference
 Full-Text PDF
 Full-text HTML