-
Paper Information
- Next Paper
- Previous Paper
- Paper Submission
-
Journal Information
- About This Journal
- Editorial Board
- Current Issue
- Archive
- Author Guidelines
- Contact Us
American Journal of Economics
p-ISSN: 2166-4951 e-ISSN: 2166-496X
2013; 3(6): 322-329
doi:10.5923/j.economics.20130306.11
Profiles and Determinants of Poverty among Urban Households in South-West Nigeria
 Abstract
 Reference
 Full-Text PDF
 Full-text HTML
Sakiru Oladele Akinbode
Department of Economics, Federal University of Agriculture, Abeokuta, Nigeria
Correspondence to: Sakiru Oladele Akinbode, Department of Economics, Federal University of Agriculture, Abeokuta, Nigeria.
| Email: |  |
Copyright © 2012 Scientific & Academic Publishing. All Rights Reserved.
Poverty is gradually becoming more visible in urban areas in Nigeria. Therefore, this paper assessed the poverty situation and its determinants among urban households in the south-west region of the country. Data collected from a total of 320 households were analyzed using descriptive statistics, Foster Greer and Thorbecke (FGT) index and the ordinary least square multiple regression analysis. The results revealed that majority of the households relied on water from boreholes for drinking, disposed refuse in undesignated places and patronized nearby drug stores when they are ill in place of proper diagnosis and treatment in hospitals. The FGT decomposition showed that 34 percent of the households were poor with a poverty gap and severity indices of 0.11 and 0.06 respectively. The study further revealed that educational level of heads (α=0.01), household size (α=0.05), gender of heads (α=0.01), dependency ratio (α=0.05) and access to credit (α=0.05) exerted significant effect on household welfare. It is recommended among others that credit facilities (with minimal stringent conditions attached) should be provided and tailored more towards females and less educated people in the area. Policies which could lead to increased employment opportunities are also advocated in order to reduce dependency ratio among households thereby alleviating poverty.
Keywords: Households, Welfare, Poverty, Urban, Nigeria
Cite this paper: Sakiru Oladele Akinbode, Profiles and Determinants of Poverty among Urban Households in South-West Nigeria, American Journal of Economics, Vol. 3 No. 6, 2013, pp. 322-329. doi: 10.5923/j.economics.20130306.11.
Article Outline
1. Introduction
- Poverty is a plague which is an issue of serious concern in all countries of the world at various degrees. Due to the effect of poverty on the well-being of man, it has attracted a lot of attention from policy makers, Non-Governmental Organizations (NGOs), philanthropists, politicians, academics, researchers among many others around world. The multifaceted nature of poverty and its attendant multiplier effect on all aspects of human endeavours may have informed the United Nation’s declaration of 1996 as the “International Year for the Eradication of Poverty”. In the same vein, the 17th day of October every year was designated as the “International day of Eradication of Poverty” worldwide. According to[1], as at year 2001, about 1.1 billion people across the world had consumption levels below $1 a day implying that this class of people were absolutely poor and 2.7 billion lived on less than $2 a day."The issue of poverty is more pronounced in the developing countries of Africa, Asia, Latin America and South America. In reference to the Federal Office of Statistics’ (now National Bureau of Statistics) records,[2] stated that about 15 percent of Nigeria population were poor in 1960; the figure rose to 28 percent in 1980 and, by 1996, the incidence of poverty in Nigeria was 66 percent or 76.6 million people.[3] stated that the scourge of poverty in Nigeria is an incontrovertible fact, which results in hunger, ignorance, malnutrition, disease, unemployment, poor access to credit facilities, and low life expectancy as well as a general level of human hopelessness.The Human Development Index released by[4] ranked Nigeria as 158th in the world behind Eritrea and this might have been due to growing incidence of poverty which is pervasive in the country. Poverty gap is getting wider everyday in Nigeria with the top rich 10 percent of the population controlling about 43 percent of the nation’s wealth. About 70 percent of Nigerians have been said to be living below poverty line ([5]) based on 2010 data. It should be noted that high incidence of poverty is a threat to national economic growth and development. According to[6], Nigeria’s prospect of halving poverty by 2015 seems weak as the Federal Government’s efforts to reduce poverty rate by 2015 is weak. The proportion of people living below the national poverty line has worsened from 65.5 per cent in 1996 to 69.0 per cent in 2010.[7] presentations based on 2010 data also corroborated these assertions.In Nigeria, poverty remains a major socioeconomic issue in spite high level of economic growth. According to the[8], Nigeria has one of the world’s highest economic growth rates, averaging 7.4 percent over the last decade. The economy is developing with plenty natural resources such as crude oil, solid minerals, large and less saline water bodies, highly cultivable land, human resources e.t.c. In fact, there is no state in Nigeria that is not endowed with at least one natural resource in commercial quantity. Contrastingly, the country still has a high level of poverty, with majority of the populace living on below $1 daily[9]; implying a decline in equity. There have been attempts at poverty alleviation, notably with the government of the federal republic of Nigeria formulating policy programmes aimed at improving productivity especially in the primary and real sectors such as agriculture and the small and medium scale businesses. Some of the programmes include but not limited to: National Accelerated Food Production Programme and the Nigerian Agricultural and Co-operative Bank(1972); Operation Feed the Nation (whose primary aim was to teach the rural farmers how to use modern farming tools) (1976); Green Revolution Programme (aimed at reducing food importation and increase local food production) (1979); National Directorate of Employment (NDE) (1986), Directorate of Food, Roads and Rural Infrastructure (DFRRI) (1986); Family Support Programme and the Family Economic Advancement Programme (1993); National Poverty Eradication Programme (NAPEP)- which was to replace the previously failed Poverty Alleviation Program (2001); the National Fadama Development Project in the early 1990s whose Phase III which took off in 2009 is being rounded off now; Commercial Agricultural Development Project (CADP) (2009) and lately the Agricultural Transformation Agenda (ATA) (2012) which is a component of the present government’s “Transformation Agenda” among many others. Unfortunately, these programmes have not been able to significantly reduce poverty in Nigeria largely due to insincerity in implementation and large scale corruption.Poverty increases the risk of homelessness. Slum-dwellers, who make up a third of the world's urban population, live in states of poverty, not better, if not worse, than rural people, who are the traditional focus of poverty in the developing world[10]. In recent time however, poverty has been seen not as a rural issue only but also as an urban phenomenon. Countries, especially the developing ones cannot overlook the issue of poverty as it will be one the major social forces in the few years to come. It is obvious that urban population is growing at a faster rate compared with the rural population and this is due to rural-urban migration.[11] alerted that there is a possibility that urban population growth rate will increase by almost twice the world’s population growth rate between 2003 and 2030. Rural-urban migration is conventionally seen in developing countries (including Nigeria) as a positive step necessary to escape from poverty which characterizes peasant farming commonly practiced in the rural area as a result of low productivity, lack of access to credit and lack of basic infrastructures such as roads, electricity, pipe borne water e.t.c. Due to inefficiency in governance alongside several other corrupt practices, most urban areas in Nigeria are not significantly different from the rural areas as the view available social infrastructures are overstretched, old, not well maintained and therefore unable to meet the demand of the growing urban population swollen up by emigrants from the rural areas. The effect of this precarious situation is that the poverty most of the migrants are trying to run away from in the rural areas usually catches up with them in cities with dare social consequences. According to[12], data from eight countries containing approximately two-thirds of the world’s people suggested that the locus of poverty is shifting from rural to urban areas. Hence, there is the need to give urban poverty the serious attention it deserves. Meanwhile, poverty analysis is one of the principal steps in formulating a workable poverty reduction strategy. Only few empirical researches have focussed on urban areas. If they do however, poverty is a dynamic socioeconomic issue which should be assessed as frequently as possible due to changing human behaviour and socioeconomic fortune. In the light of the foregoing, this research is aimed at assessing holistically the profiles and determinants of poverty among urban households in south-west Nigeria using Ogun state as a case study. Findings and recommendations from this study is expected to be useful to government in formulating specific and directional policies capable of reducing poverty in the study area.
2. Concept of Poverty
- Poverty has been defined from different perspectives depending on the bias of the author. However, the underlining theme seems not to be significantly different. Poverty is seen as the state of one who lacks a certain amount of material possessions or money to live a comfortable life. According to[13], poverty goes beyond material deprivation to include insecurity, vulnerability and exposure to risks, shocks and stress. It specifically includes not having enough food to eat, poor drinking water, poor nutrition, unfit housing, low opportunity to receive education, low employment opportunities, inadequate or complete lack of health care, lack of active participation in decision making process, a high rate of infant mortality, low life expectancy and low level of energy consumption. Absolute Poverty is defined in terms of the minimal requirements necessary to afford minimal standards of living. It refers to the deprivation of basic human needs, which commonly includes food, water, sanitation, clothing, shelter, health care and education (NBS, 2012). According to[14], the widely used $1 a day poverty line was set for World Development Report 1990. A consensus emerged in the international development community on this standard for measuring extreme poverty in the world, and it became the basis of the first Millennium Development Goal which is to halve the 1990s $1 a day poverty rate by 2015. It was further argued that absolute poverty (measured using a poverty line with a constant real value) is the more relevant concept in poor countries. In 2005, after extensive studies of cost of living across the world, the World Bank raised the measure for global poverty line to reflect the observed higher cost of living. Now, the World Bank defines extreme poverty as living on less than US$1.25 (PPP) per day, and moderate poverty as less than $2 a day. Subsequently the use of $1.25 a day has been gaining popularity as the new international benchmark for poverty measurement. Meanwhile, scholars have argued that the money metric measures of poverty are too restrictive and thus recommended the use of non-income social indicators such as life expectancy, assets, literacy and infant mortality to measure poverty. However, the money metric approaches have been widely used and they remain the most popular as they are more direct and devoid of the complexity involved in other suggested approaches.Relative poverty on the other hand is defined in the context of economic inequality in the location or society in which people live e.g within a village, town, city, state, province, region, country e.t.c. Relative poverty is defined by reference to the living standards of the majority in a given society and separates the poor from the non-poor. According to[10] the concept of relative poverty is based on the idea that the way individuals or households perceive their position in society is an important aspect of their welfare. Here, households with per capita expenditure greater than two-thirds of the Mean Household per Capital expenditure are usually classified as “Non-Poor” whereas those below it are “Poor”. Furthermore, households with less than one-third of overall Mean Household Per Capita expenditure are usually classified as “core-poor (extreme poverty)” while those households with greater than one-third of overall mean per capita expenditure but less than or equal to two-thirds of the mean per capita expenditure are classified as “moderately poor” ([7]).[14] stated that relative poverty (in which the poverty line rises with the mean) is more salient in middle and high-income countries.Causes of poverty include but not limited to war; famine; diseases; lack of education; divorce; teenage pregnancy; underemployment; immigrant status; extravagance, irrational decision especially those related to culture and values, minority status; physical and mental disability; loss of job; disasters; laziness; overpopulation and inequality.The effects of poverty are as numerous as its causes. The case of increased poverty and inequality further marginalize the poor and this has been one the reasons for agitation for salary increase by workers both in the public and the private sectors. Poverty can also be said to be one the remote causes of civil strife; political, religious and ethnic riots; thugery, armed robbery, pilfering, pocket picking, prostitution and other risky or undesirable behaviours. Each of these consequences of poverty has its own multiplier effects on both individuals and the society as a whole.
3. Methodology
3.1. Study Area
- The study was carried out in Abeokuta the capital city of Ogun State, South-west Nigeria. The state was carved out the old Western region in 1976 by the then Federal military Government. It is located within latitudes 3°30'N-4°30'N and longitudes 6°30'E-7°30'E. The state has a total of 20 Local Government Areas. Abeokuta (the study area) has the highest population and it is the most urbanized city in the state. It is mostly populated by civil servants, artisans, traders, transport workers, student’s etc. Substantial part of the population migrated from nearby villages and small towns to this capital city. The state is bounded in the West by the Republic of Benin, in the south by Lagos state and the Atlantic Ocean, in the east by Ondo state and in the North by Oyo state. The state covers a land area of 16,762 km2 with a population of 3,728,098 according to the 2006 population census.
3.2. Sampling Technique
- Sample units (households) were randomly selected across different locations in the study area. They were chosen carefully in order to cut across various socioeconomic groups. The households were selected using a systematic random sampling from the house street numbers which were used as sampling frame. In this method, sampling intervals were determined by dividing the frame by the required number of households in the street and households were selected at the regular intervals. A total of 343 households were sampled for the study but 320 of the questionnaires were used for the analyses as twenty-three (23) were discarded due to incomplete information and other deficiencies which made them unsuitable for the analysis at hand.
3.3. Method of Data Collection and Data Sources
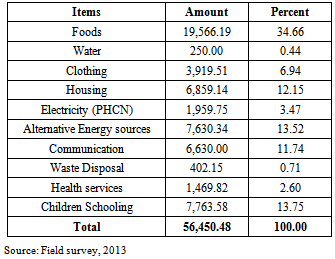
- Primary data were used in this study. These were collected by personal interview and recording with the aid of structured questionnaires. Data were collected on socio-economic characteristics of households (such as household head’s age, income, education e.t.c), types of houses, materials used in building the houses respondents were living, ownership, access to and type of drinking water used in the household, waste disposal methods, types of schools attended by the children, types of toilets in the house, types of occupation, health services patronized, food and non-food expenditure among several other variables needed to carry an analysis of poverty situation of households.
3.4. Method of Data Analysis
- Descriptive statistics: Frequency tables and percentages were used to describe the socio-economic characteristics of respondents, their housing and living situation, health services patronized e.t.c.FGT index or P-Alpha measure of poverty: This was used to assess the poverty situation of households within the study area. The FGT poverty index is a family of additively decomposable measure of poverty which was proposed and developed by[15]. It has been widely used in empirical poverty studies (e.g[16];[17];[18];[19];[20] e.t.c). It is a generalized measure of poverty which measures the outfall from the poverty line and also considers inequalities among the poor. The higher the FGT statistic the more there is poverty in a society. The FGT formula is given as:

 . Where Pα = Foster, Greer and Thorbecke index (0 ≤ Pα ≤ 1)N = total number of households sampled for the studyz = the poverty line ($1.25 equivalent to N196.25 Nigerian currency, at $1 = N157 exchange rate) yi = the per capita expenditure of the ith householdα = the FGT parameter (where α takes the values 0, 1 and 2 respectively, depending on the degree of concern about poverty. If there is increase in the value of α, the aversion to poverty as measured by the index increases. In line with this, when there is no aversion to poverty α = 0, the index simply becomes:
 This is referred to as the head count ratio or measure of poverty incidence. When α = 1, the index so generated is a measure of poverty depth or poverty gap. Finally, when α = 2, the index generated is the poverty severity and the closer the value is to 1, the more severe the poverty situation is such society.Multiple Regression Analysis: The Ordinary Least Square (OLS) multiple regression analysis was used to determine socioeconomic characteristics of household affecting their welfare as proxied by their per capita expenditure. The model is given as:W = ɳ0 + ɳ1G + ɳ2M + ɳ3E + ɳ4Z + ɳ5A + ɳ6D + ɳ7C + ɳ8R + εWhere W = Per capital expenditure of the ith householdG = Gender of head (1 if male, 0 if otherwise)M = Marital status of head (1 if married, 0 if separated, divorce, single, widow or widower)E= Educational level of household head (in years spent in school)Z = Household sizeA = Age of household head (in years)D = Dependency ratio)C = Access to credit facility (1 if head has access, 0 if otherwise)R = Remittances recipients (1 if household receives regular remittances, 0 if otherwise)
 4. Results and Discussion
4.1. Socioeconomic Characteristics of Households
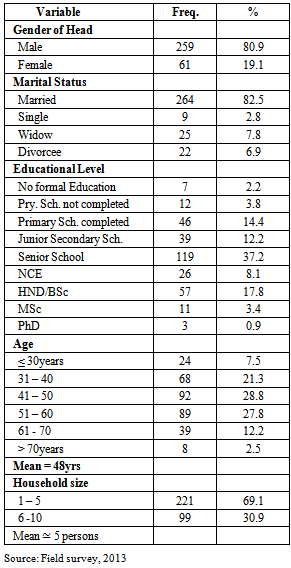
- The study revealed that majority (80.9%) of the household heads were male. This is usually the typical and natural household structure in traditional African setting and in most other continents of the world. Females only become the household head in the event of death of the husband, separation or outright divorce. Expectedly, majority (82.5%) of the household heads were married; others were widows, divorcees or separated and about 45 percent were educated up to the senior secondary school level. Average age of household heads was about 48 years with an average of 5 persons in the household. Further analyses of the age of the household heads revealed that majority (about 57 percent) were still below the age of 50 years (Table 1). About 58 percent were self employed while the remaining were salary earners working in government ministries, departments, agencies, paramilitary establishments, institutions, schools or private sectors.
|
4.2. Housing and Living Conditions of Households
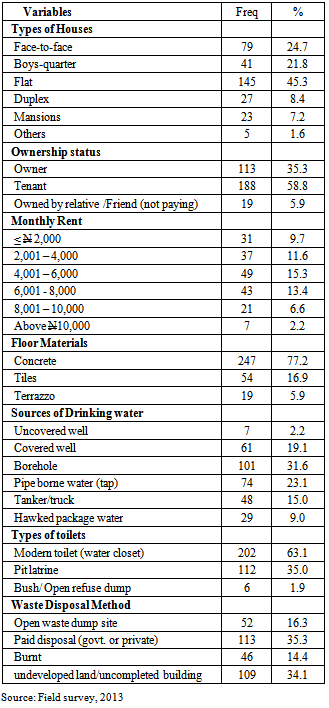
- Table 2 shows that 45 percent of the households lived in flats. Another 24.7 percent lived in multi-tenanted (face-to-face) type of houses while others were living in mansions, duplexes, boys-quarters e.t.c. The findings here is contrary to that of[21] which reported that 36 percent and over 50 percent of the urban households in Kwara state, north-central Nigeria lived in flats and face-to-face houses respectively. About 59 percent of the households lived in rented apartments; about 35 percent owned the houses they were living while others were living free of charge in houses either owned by relatives or friends. Majority of the houses (77.2 percent) had concrete floor while others were made of tiles and terrazzo.
|
|
4.3. Incidence, Depth and Severity of Poverty among Households
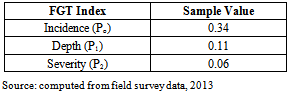
- Table 5 revealed a poverty incidence (head count) index value of 0.34 implying that 34 percent of the sampled households were poor. The poverty depth value was 0.11implied that an average poor household in the study area has to mobilise resources up to 11 percent of the poverty line i.e $1.25 (N196.25) which translates to N21.67 (or US$0.14) more per person per day in order to escape poverty. It is therefore clear that poverty is present among the sampled households in Abeokuta, southwest Nigeria. The poverty severity index value of 0.06 shows the seriousness of poverty in the study area. The closer the value of this index to one (1) the serious the poverty in the area. Indices obtained in this study are not in agreement with some of those found in literature. For instance,[19] reported poverty incidence, depth and severity indices of 0.47, 0.23 and 0.16 respectively while[18] reported values of 0.6158; 0.2719 and 0.1546 respectively in Benue state north-central Nigeria.
|
|
4.4. Description of Poverty Profile of Households by Socioeconomic Characteristics
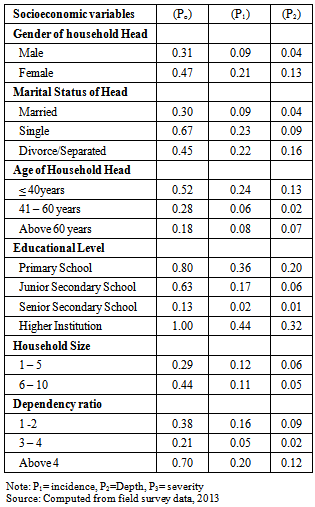
- Breakdown revealed that the three indices of poverty considered in the study (incidence, depth and severity of poverty) were higher among female headed households. For instance, the headcount ratio was 0.47 among female headed households compared with 0.31 among male headed households. The gender nature and cultural beliefs are in favour of better economic empowerment for male compared with female especially in Africa. In the same vein,[21] reported incidence values of 0.47 and 0.81 for male and female headed households respectively. Furthermore, households headed by more educated persons have smaller poverty incidence, gap and severity. These followed the trend observed in[17] where poverty incidence values were 0.412 and 0.092 for households whose heads had highest educational levels of senior secondary school and tertiary education respectively. Furthermore, larger households have higher indices than smaller households and households with higher dependency ratio also returned higher poverty indices while those headed by older persons have lower indices (Table 6).
|
4.5. Determinant of Household Welfare
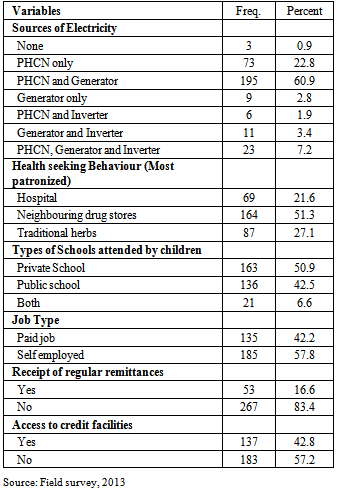
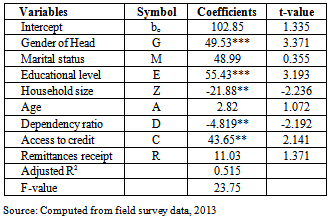
- Before discussing the determinants of welfare which emanated from the Ordinary Least Square (OLS) multiple regression analyzes, it is imperative to diagnose the set of data used for the study for the presence or otherwise of certain econometric problems which may violate the basic assumptions underlying the use of the techniques.Data Diagnosis Tests: Autocorrelation (errors’ independence) -Autocorrelation test was done to establish if the error terms were independent of each other or not. In this regards, the Durbin Watson (DW) statistic was calculated using the SHAZAM computer software. The DW statistic value of 1.96 which was sufficiently close to 2 and the rho (ρ) value of 0.09 which was not statistically significant confirmed that the data used for the study were free from autocorrelation problem.Heteroscedascity: The chi-square value of 8.75 significant at 1 percent level returned by the heteroscedascity test pointed to the fact that the data set has a constant or stable variance across data points thereby the hypothesis about the presence of the econometric problem of heteroscedascity was rejected.Normality: The normality of the data set is not in doubt given the large number of households involved in the study. In fact, non-normal distributions tend towards normality as sample size increases. Therefore, prominent assumptions underlying the technique were not violated and the OLS regression analysis was carried out. All the explanatory variables included in the welfare model came out with the expected signs i.e household size and dependency ratio have negative signs while other regressors positively affect poverty (proxied by households’ per capita expenditure). Out of the eight explanatory variables included in the model, five (gender, educational level of head, household size, dependency ratio and access to credit facilities) exerted significant effects on household welfare. Gender being a dummy variable (where male headed households were score “1” and female headed households scored “zero”) and returning a positive coefficient implies that poverty is lesser in male headed households compared with female headed households. This corroborates findings of[21],[17] and[19]. The positive and significant coefficient of education implies that the more educated the household head the more the household per capita expenditure. This is more so because in developing countries such as Nigeria and like in many other developed ones, education is one of the criteria for securing better paying jobs and such higher income usually trickles down to household members thereby moving them away from poverty.Furthermore, education is believed to be able to provide people with better managerial skills needed to manage private businesses thereby earning more income and avoid poverty.[21] also found education to be a significant determinant of poverty. The implication of the significant negative sign of household size is that as household size increases poverty also increases because the per capita income decreases. The coefficient value of 0.2188 implies that an increase in the household size by one person reduces daily per capita expenditure by N21.88 (US$0.14). It can be deduced that larger households are likely to be poorer than smaller households. In addition, as members of the household who were not contributing to the household (dependants) increases, poverty becomes more pronounced in the household ceteris paribus because of the increased pressure on the available income. This corroborates the findings of[17]. In addition, access to credit facilities has a significant positive effect on per capita expenditure. Meanwhile, being a dummy variable where those who had access were scored “one” and those who did not have were scored “zero”, it can be deduced that access to credit reduces poverty. Access to credit allows individuals to acquire more physical assets, expand their businesses and take advantage of sudden investment opportunities which are likely to improve their income and move them away from poverty (table 7). The R-squared value of 0.515 means that 51.5 percent of the variations in household per capita expenditure were as a result of variations in the explanatory variables which were included the model estimated.
|
5. Conclusions and Recommendations
- A noticeable proportion of households in the study area are living in substandard housing conditions as germane issues such as sources of drinking water, refuse disposal methods, population density within a building and health seeking behaviours are still below acceptable standard. The study has been able to reveal that poverty is pervasive in the area with poverty biting harder on female headed households, larger households, households headed by less educated persons and those who did not have access to credit. These findings are expected to be useful to policy makers and intervention organizations towards alleviating poverty in the area and in the country as a whole.In the light of this, it is recommended that credit facilities which are without or with very minimal stringent conditions (such as provision of collateral) be provided. This may be achieved by encouraging potential beneficiaries to form groups through which such intervention programmes could be implemented. Directional policies such as training in skill acquisitions should be tailored more towards females and less educated people in the area. Policies which could lead to increased employment opportunities are urgently required in order to reduce the number of household members who were not contributing to household income (dependants) in the area as this will reduce poverty. Finally, the federal government should not relent in its efforts to address the epileptic power supply situation in the country in order to enhance the survival and growth of small and medium scale businesses which will reduce unemployment. In addition, the large amount of money spent on alternative power supply by households could be used to improve household welfare.
ACKNOWLEDGEMENTS
- The author wishes to thank several paid enumerators who participated in the data collection exercise.