-
Paper Information
- Next Paper
- Previous Paper
- Paper Submission
-
Journal Information
- About This Journal
- Editorial Board
- Current Issue
- Archive
- Author Guidelines
- Contact Us
American Journal of Economics
p-ISSN: 2166-4951 e-ISSN: 2166-496X
2013; 3(6): 260-267
doi:10.5923/j.economics.20130306.03
Stock Prices and Inflation: Evidence from Nigeria
 Abstract
 Reference
 Full-Text PDF
 Full-text HTML
Akinlo Olayinka Olufisayo
Dept. of Management and Accounting, Obafemi Awolowo University, Ile-Ife, Nigeria
Correspondence to: Akinlo Olayinka Olufisayo, Dept. of Management and Accounting, Obafemi Awolowo University, Ile-Ife, Nigeria.
| Email: |  |
Copyright © 2012 Scientific & Academic Publishing. All Rights Reserved.
This paper examines the relationship between inflation and stock price index in Nigeria over the period 1986 – 2010. The results of the study, obtained using the Vector Error Correction Model, confirm the existence of long run relationship between inflation and stock price index. Moreover, the results provide evidence in support of Fisher effect in the short run and long run. This simply suggests that stocks are good inflation hedges both in the short and long run.
Keywords: Inflation, Stock Price, VECM, Nigeria
Cite this paper: Akinlo Olayinka Olufisayo, Stock Prices and Inflation: Evidence from Nigeria, American Journal of Economics, Vol. 3 No. 6, 2013, pp. 260-267. doi: 10.5923/j.economics.20130306.03.
Article Outline
1. Introduction
- The relationship between stock prices and inflation has been subject of numerous research papers in the last four decades. However, there is no consensus on the nature of the relationship between the two variables. While some studies found no relationship, others reported either a positive or a negative relationship.[1] proposed proxy hypothesis which shows inverse relationship between stock prices and inflation. The negative stock returns-inflation relationship is explained by the positive relationship between stock returns and basic determinants of equity values, such as capital expenditures, average real rate of return on capital and productivity of a company[1]. In contrast, if one conceives stock or security as capital goods, inflation treats the capital goods in the same aspect as other goods, such as agricultural products and industrial products[2]. This simply means that increasing inflation should precipitate higher price level of general goods as well as securities. This assumption was argued by[3] that when the future expected inflation rate is higher, the ratio of stock price to real earnings drops. This is as a result of the fact that effective tax rate on a company’s source of income is increased to correspond to higher inflation rate.Although studies have been conducted on the relationship between stock prices and inflation in the developed and many industrialized economies, the same cannot be said of sub-Saharan African Countries (SSAs) like Nigeria. The dearth of studies on the subject matter in SSA can be explained by the relatively recent formation of the stock markets in the sub region except for few of them including South Africa, Egypt and Morocco. There is the need to fill this gap as it relates to Nigeria. Asides, in Nigeria, many mutual funds are investing in both domestic and international stock market, thus the knowledge of the relationship between inflation rate and stock prices would be of immense benefit to both portfolio managers and economic workers.The rest of the paper is organized as follows: an overview of the trends of stock prices and inflation is provided in section 2. Section 3 provides an overview of recent findings on stock prices and inflation. Section 4 provides the methodology. In section 5, empirical results are discussed. Section 6 concludes.
2. Overview of Trends of Stock Prices and Inflation in Nigeria
- The Nigerian Stock Exchange was established in 1961 by the Lagos State Act. It was reconstituted into the Nigerian Stock Exchange in 1977 with trading floors in Lagos, Kaduna, Port Harcourt, Kano, Onitsha, Yola and Ibadan. Another stock market was subsequently established at Abuja in Nigeria. The Nigerian Stock Market has continued to witness tremendous growth following the various economic reforms (deregulation and financial sector liberalization) initiated in 1986. The plot of available data on market capitalization shows a steady and smooth increase from 1995 to reach a peak in 2007. However, market capitalization dropped significantly in 2008 and 2009. This was sequel to the financial crisis that magnified the word economics during this period. The total market capitalization picked up slightly in 2010 (see figure 1). In the same way, the number of firms listed in the Nigerian Stock Exchange increased from just 19 in 1961 to 282 in 2006. The figure however dropped to 257 in 2010.Figure 2 below show the plots of All Share Price Index (SP) and inflation rate (INF) in Nigeria over the period 1986-2010. The figure shows that the inflation rate increased from 1986 to reach the peak in 2004. It however decreased and dropped sharply from 2005 only to assume upward movement till 2010. In the same way, all share price index increased steadily from 1986 until 2003, only to drop slightly in 2004 and 2005. It however increased sharply between the period 2006 and 2007. The figure decelerated sharply in 2008 to 2010.
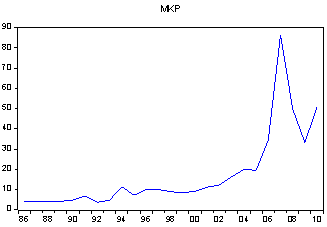 | Figure 1. Plot of Market Capitalization 1986 - 2010 |
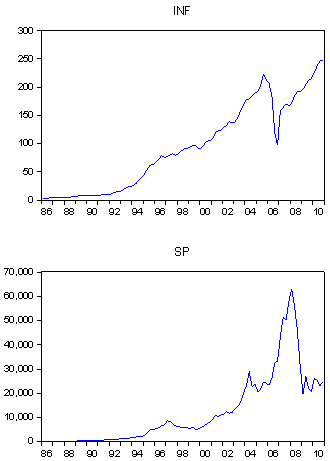 | Figure 2. Plot of Inflation (INF) and Stock Prices (SP) 1986 - 2010 |
3. Review of Empirical Literature
- The stock price-inflation relationship has attracted considerable attention in the theoretical and empirical literature. However, no consensus has emerged as to the relationship between the stock prices and inflation. In theory, stocks are assumed to be inflation neutral for unexpected inflation which should have a negative effect on stock prices. The standard discounted cash flow model calculates stock prices as the present value of future expected cash flows[4]. As pointed out in the literature, for stocks to be inflation neutral and represent a good long-term hedge against inflation, firms should pass on any increase in inflation rates to future cash flows. On the part of investors, adjusted cash flows should be discounted by inflation-adjusted rate of return[4]. Alternatively, the investors could discount the real cash flows by the same real discount rate. The argument is what is known as Fisher hypothesis (1930) or Fisher effect. The fisher effect states that the nominal interest rate is equal to the expected real interest rate and expected inflation rate. Accordingly, the ex-ante real rate of stock returns and inflation rate are influenced by nominal rate of stock returns. Thus, from the Fisher hypothesis, there is an implication that the investment in securities can hedge against inflation. In other words, stocks and financial assets prices need to move positively with expected inflation in order to serve as hedge against rising prices. Anything short of this will lead to erosion of assets through inflation.In contrast is the contention that the stock returns/price and inflation relationship is negative. Three main explanations have been offered to explain this negative relationship. The first is the argument that fisher hypothesis is more applicable in the long run as an equilibrium relationship. The second is the behavioural hypothesis used to explain the short run relationship[5]. This hypothesis argues that investors mistakenly price future real cash flows by discounting by the nominal rate of return. The third known as proxy hypothesis by[1] argues that since stock returns and future real economic growth are positively related, as inflation increases, real economic growth declines and thus become more volatile thereby pushing investors to require higher risk premiums to cover the additional risk.Empirically, few studies have established long run positive relationship (Fisher effect). Amongst these are[6];[7];[8];[10];[11;[12];[4]. However, virtually all these studies confirmed short run negative effect i.e. the inflation illusion as named by[5]. The study by[6], and[7] reported positive relationship between nominal stock returns and inflation for United Kingdom. This finding is consistent with the generalized Fisher hypothesis. In the same way,[8] reported positive relationship between inflation and nominal stock returns for both UK and USA. The same result was obtained for Greece by[9]. The study by[4] found positive relationship between stock prices and inflation for Jordan, Saudi and Morocco.Several other studies have reported negative relationship between stock prices and inflation.[13] present evidence that stock prices are negatively related to both the expected and the unexpected component of consumer price index for USA. In the same way, studies including[13];[14] and[15] for USA,[16] reported negative relationship between stock market returns and inflation in Greece. The same result was obtained for Turkey by[17].However, in contrast to the two views noted above, few studies have reported insignificant relationship between stock prices and inflation. Among such studies are:[18] and[19]for USA, and[20] for UK.Essentially, from the empirical literature above, the following points are discernible. One, there seems to be negative relationship between stock prices and inflation. Two, in the long run there is positive relationship between the two variables.
4. Methodology
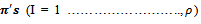
- In this study, the vector auto-regressive model for analysis was adopted. The approach is adopted for some reasons. First, none of the variables in the system seems to be exogeneous. VAR appears to be the most plausible method, as it does not require a priori assumption of exogeneity of variables. Second, VAR model allows each variable in the system to interact with itself and with each other without having to impose a theoretical structure on the estimates. Finally, the approach provides a convenient method of analyzing the impact of given variable on itself and all variables by using variance decomposition (VDCs) and impulse response function (IRFs).The main objective is to determine the cointegration relationship amongst the variables of our model namely; stock prices (SP), inflation (INF), interest rate (INT) and gross domestic product (GDP). Formally stated, the VAR model is given as:
 | (1) |
 are (4 x 4) matrices for the variables
  is a (4 x 1) column vector of the first difference of
  is a (4 x 4) matrix for the variable
  which is a (4 x 1) column vector of lagged dependent variables ,
  is a (4 x s) matrix containing s deterministic variables for each dependent variable,
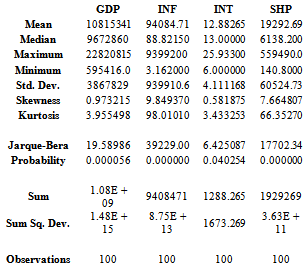
  is a (4 x 1) column vector of disturbance terms normally distributed with zero means and constant variances.However, if all variables in our VAR are integrate with order 1[I(1)], and if the cointegration relationships among them exist, we then use Vector Error Correction Model (VECM) to estimate the impulse response and variance decomposition functions.Quarterly data spanning the sample 1970 to 2010 sourced from the Central Bank of Nigeria (CBN) Statistical Bulletin 2011 edition were used. The variables are the real GDP of time t (GDP), the inflation rate which is the Consumer Price Index (1980 = 100), interest rate (INT) and stock price index (SHP). As earlier pointed out in sub section 2, the number of listed firms increased from mere 19 in 1961 to 257 in 2010. The securities listed on the Nigerian stock Exchange comprises about 30 Government stocks, 35 industrial stocks and about 200 equity/ordinary shares of companies. Many of the listed companies have foreign and multinational affliations.Descriptive Statistics of the dataThe descriptive statistics of the data used in the study is as shown in table 1. The results indicate positive skewness meaning that they are asymmetrical. Also, the kurtosis value of all variables shows that data is not normally distributed as values of kurtosis far deviated from 3. The descriptive statistics indicates that the values are not normally distributed about its mean and variance.
|
5. Empirical Results
5.1. Correlation Tests
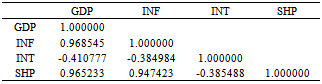
- As a prelude to the unit root and cointegration tests, the correlation among the variables under consideration was looked at. The results are as shown in table 2. The result shows that GDP is positively correlated with other variables except interest rate. Inflation is equally positively correlated with stock prices but negatively correlated with interest rate. Interest rate is however negatively correlated with stock prices. In all cases of positive correlation, the coefficient of correlation is very high above 90 per cent.
|
5.2. Unit Root Test
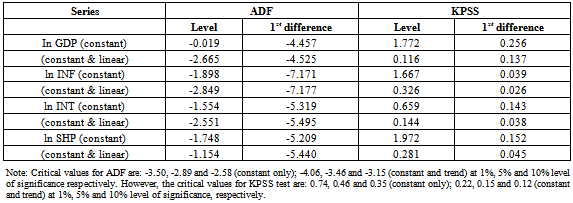
- To test formally for the presence of a unit root for each variable in the model both Augmented Dickey Fuller (ADF)[21] and KPSS[22] tests were employed. Thus the limitation of ADF statistics in deciding whether ɸ = 1 or ɸ = 0.98, in a model like:
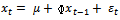 has been remedied by the application of the KPSS statistic simultaneously. The null hypothesis for ADF statistic and KPSS test are; H0: non stationarity (unit root) and H0: stationarity respectively. All the results obtained are as shown in table 3. The results show that after differencing the variables once, all the variables were confirmed to be stationary. It was therefore concluded that all the variables are integrated of order one.
5.3. Cointegration Test
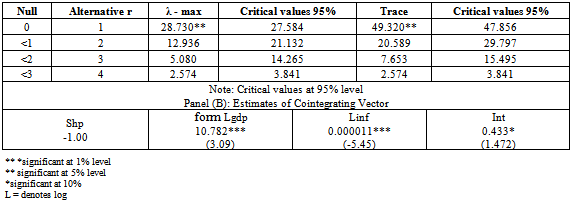
- Once the order of integration of each of the variable is ascertained, cointegration test was conducted. The existence of cointegration would imply that even though individual series may be non-stationary, one or more linear combination of them are stationary. For this purpose, the study adopts the[23] technique. The results of the cointegration tests are presented in table 4.The results of the trace tests and λ-maximum show that the null hypothesis of no cointegration i.e. 0, can be rejected. It is therefore concluded that there is at least one cointegrating vector in the model. Panel B of the results shows the cointegrating equation normalized on the stock price variable. The results show that inflation, interest rate and gross domestic product have positive effects on stock prices. The coefficients of inflation and gross domestic product are significant at 1 per cent while the interest variable is significant at 10% as shown by the t-ratios indicated in parenthesis. The results show that in the long run, a 1% increase in inflation rate will increase stock prices by 0.000011%. Also, a 1% increase in gross domestic products will increase stock prices by 10.78%. Finally, a 1% increase in interest rate will increase stock prices by 0.43%. This result seems to confirm the existence of positive relationship between inflation and stock prices in the long run. Hence, the result tends to establish the long run hedging Fisher effect in the case of Nigeria.
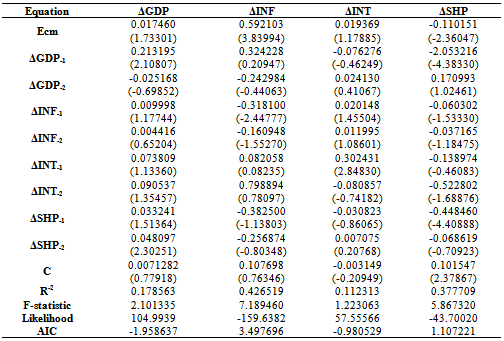
5.4. Results from Vector-Error Correction Model
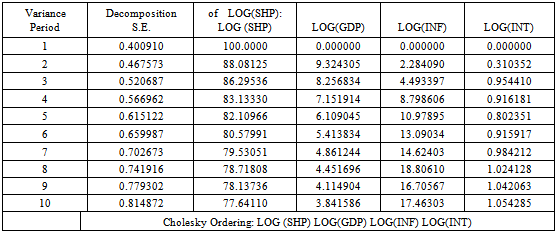
- The results of the estimated vector error correction model, using an optimal log of two[determined by Alkaike information criterion AC and Schwatz Criterion (SC)] are given in table 5. The error correction term is significant for stock price and inflation equation. The error correction term has the correct sign for stock prices. As is the case with any vector auto regressive model, the individual coefficients of error correction model are hard to interpret.As a result, the dynamic properties of the model are analysed by examining the impulse response functions and the variance decompositions (VDCs).
|
|
|
|
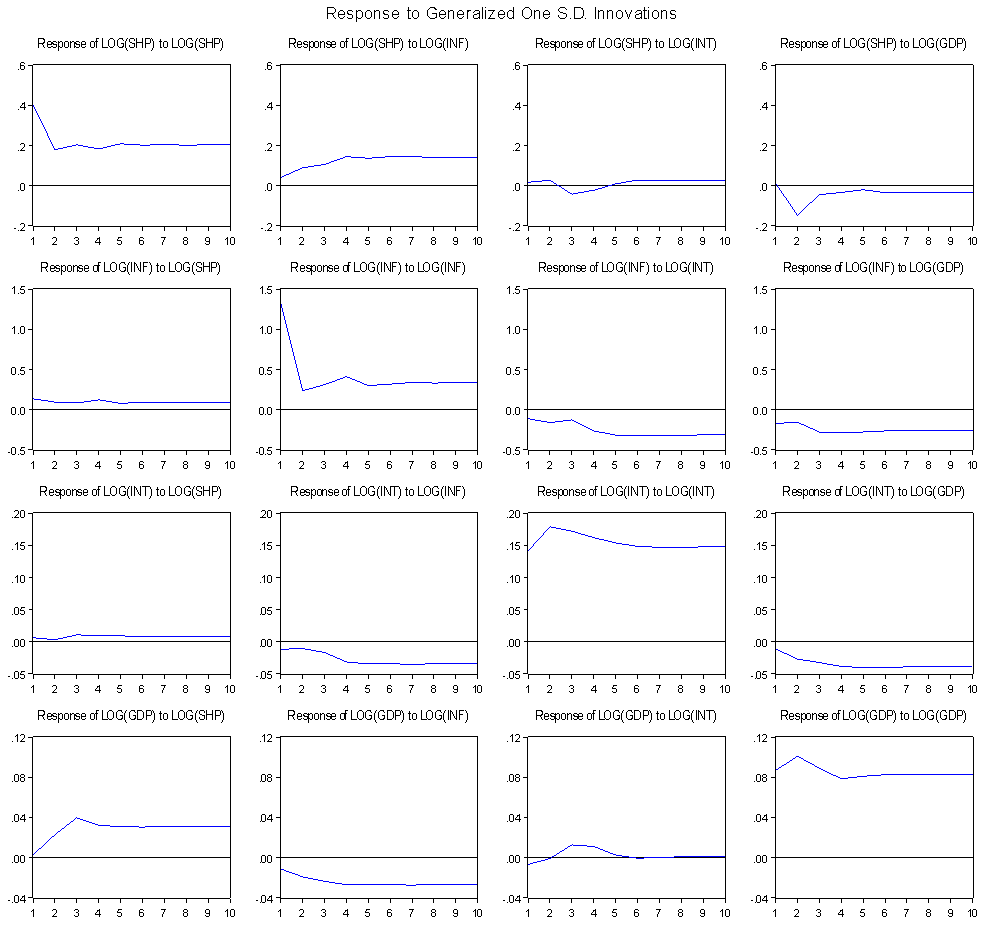 | Figure 3. Impulse Response Functions |
6. Conclusions
- The paper has examined the relationship between stock prices and inflation in Nigeria over the period 1986 – 2010. After performing stationarity test and a test for co-integration, a four-variable error correction model was estimated. The results from the impulse response functions and variance decomposition provided evidence in support of Fisher effect in the short run. The results seem to contradict the findings of some previous studies that a negative relationship exists between inflation and stock prices. Finally, the results from the cointegration test confirmed Fisher hypothesis in the long run.The conclusion from this study is that stocks are good inflation hedges both in the short and long run period.