-
Paper Information
- Next Paper
- Previous Paper
- Paper Submission
-
Journal Information
- About This Journal
- Editorial Board
- Current Issue
- Archive
- Author Guidelines
- Contact Us
American Journal of Economics
p-ISSN: 2166-4951 e-ISSN: 2166-496X
2013; 3(6): 252-259
doi:10.5923/j.economics.20130306.02
Inflation and Sustainable Output Performance in the West African Sub-Region: The Threshold Effect
 Abstract
 Reference
 Full-Text PDF
 Full-text HTML
Jonathan Dastu Danladi
Department of Economics, University of Ibadan, Ibadan Nigeria
Correspondence to: Jonathan Dastu Danladi, Department of Economics, University of Ibadan, Ibadan Nigeria.
| Email: |  |
Copyright © 2012 Scientific & Academic Publishing. All Rights Reserved.
The question as to what the optimal level of inflation should be that would engender maximum output performance has been a crucial issue over the decades. This paper empirically explores the issue of the existence of threshold effect in the present relationship between inflation and economic growth in the context of West African economies. The study is imperative due to the superficiality and gaps in the existing literatures in exploring the issue of the existence of threshold effect in determining the relationship between inflation and economic growth in the sub-region in terms coverage of issues, analytical framework and methodology. The study covers four countries in the West African region: Burkina Faso, Ghana, Nigeria and Senegal for the period 1980–2009. Findings from the empirical results strongly suggest the existence of a threshold level of 9% beyond which inflation exerts a negative effect on growth. The West African region should prioritize attention to maintaining a relatively low and stable inflation rate if the goal of attaining steady and rapid economic growth is to be achieved.
Keywords: Inflation, Output Performance, Threshold Level, West Africa, Economic Growth Developing Countries, Optimality
Cite this paper: Jonathan Dastu Danladi, Inflation and Sustainable Output Performance in the West African Sub-Region: The Threshold Effect, American Journal of Economics, Vol. 3 No. 6, 2013, pp. 252-259. doi: 10.5923/j.economics.20130306.02.
Article Outline
1. The Problem
- The central objective of monetary policy conduct is the attainment of relative price stability. This is obvious given the fact that a significant amount of resources is devoted from time to time by various monetary authorities to combat inflation and maintain stable overall price levels. The focus on price stability is derived from the overwhelming empirical evidence that it is only in the midst of price stability that sustainable growth can be achieved. Price stability does not connote constant price level, but it simply means that the rate of change of the general price level is such that economic agents do not worry about it; otherwise, it has phenomenal implications such as discouragement of long term planning; reduction of savings and capital accumulation; reduction of investment; shift in the distribution of real income and consequent misallocation of resources; and creation of uncertainty and distortions in the economy. In the past, the relationship between inflation and economic growth has gained so much attention from researchers, policy makers and monetary authorities of both developed and developing countries. The question as to whether inflation is important or harmful to the process of economic growth remains a controversial issue. The issue originally evolves from the controversial notion between the structuralists and the monetarists. The structuralists argue that inflation is necessary for economic growth, whereas the monetarists argue the opposite, that inflation is detrimental for economic growth[1]. Mundell[2] and Tobin[3] postulated that since a positive relationship exist between the rate of inflation and the rate of capital accumulation, it implies that a positive relationship exists between inflation and the rate of economic growth. According to Gregorio[4] since money and capital are substitutable, an increase in the rate of inflation increases capital accumulation by shifting portfolio from money to capital thereby, stimulating a higher rate of economic growth. On the other hand, Fischer and Modigliani [5] opine that a negative and nonlinear relationship exist between the rate of inflation and economic growth through the new growth theory mechanisms. According to them, inflation slows down economic growth largely by reducing the efficiency of investment.Many recent empirical studies confirm the existence of either a positive or negative relationship between inflation and output performances. More recently, the general consensus evolves that low and stable inflation promotes economic growth and vice versa[6, 7, 8]. These further raise the question of how low is low? How low should the inflation rate be in order to support economic development? The answer evidently depends on the nature and structure of the economy and varies across countries. In this regard, recently, macroeconomists have adopted an econometric technique simply by looking at a nonlinear or structural break effect which states that the impact of inflation on economic growth could be positive up to a certain threshold level and beyond this level the effect turns to be negative[9]. This supports both the views of the Structuralists and the Monetarists up to a certain extent, that is, low inflation is helpful for economic growth but once the economy achieves faster growth then inflation is detrimental for the sustainability of such growth. In the West African sub-region, high rate of inflation and price instability is prevalent. For this reasons, many countries in the region, have of late, directed a significant percentage of their monetary policy operation to the fight against inflation to a single digit in order to enhance output productivity. A major question that begs answer is whether the relationship between inflation and output growth in West Africa is non-linear. If yes, what is the threshold level of inflation for the region?The objectives of the study is to empirically explore the present relationship between inflation and economic growth in the context of the west African states and to carry out a threshold analysis to determine the optimal level of inflation permissible for high output performance in the region. This study is justified on the basis of the superficiality and gaps in the existing literatures in exploring the issue of the existence of threshold effect in the present relationship between inflation and economic growth especially in the context of West African economies in terms coverage of issues, analytical framework and methodology, particularly covering a rigorous empirical analysis that sets among other things the fulfillment of the aforementioned objectives. Even though Khan and Senhadji[8] use 140 countries and Li[10] uses 90 developing and 28 developed countries to estimate threshold effect, they did not consider the characteristic peculiarities distinguishing the West African sub-region from other developing countries.The remainder of this paper is organized as follows: Section 2 provides some stylized facts and background information about the historical trends of inflation and economic growth in the selected countries in West Africa. These countries are Burkina Faso, Ghana, Nigeria and Senegal. Section 3 reviews literature on inflation and economic growth.. Section 4 discusses the theoretical underpinning and methodology used to obtain the empirical findings reported in this paper as well as sources of data. Section 5 provides estimated results on inflation and economic growth, and finally, section 6 presents a summary of the main conclusions, limitations of the paper, and discusses a possible future extension.
2. Background Information
2.1. Burkina Faso
- Agriculture and mining are the most important economic activities contributing to the GDP of Burkina Faso. Agricultural activities include pastoral farming and the growing of sorghum, pearl millet, maize (corn), peanuts, rice and cotton while mining activities include the mining of copper, iron, manganese and gold. Also, a substantial part of the economic activity of the country is funded by international aid. Remittances used to be an important source of income to Burkina Faso until the 1990s, when unrest in Côte d'Ivoire, the main destination for Burkinabe emigrants, forced many to return home. Remittances now account for less than 1% of GDP.
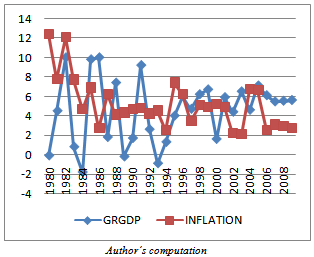 | Figure 1. Burkina faso: inflation and GDP growth rate (1980-2009) |
2.2. Ghana
- Ghana remains one of the more economically sound countries in all of Africa. In figure 2, the trend of Ghana’s GDP appears stable over the entire period of the analysis which is a redolent of stable sources of revenue to the economy at large. The economy continues to rely heavily on agriculture which accounts for 37.3% of its GDP and provides employment for 56% of the work force, mainly small landholders. Manufacturing accounts for 7.9% of their GDP. Ineffective economic policies of past military governments and regional peacekeeping commitments have led to continued inflationary deficit financing, depreciation of the Cedi, and rising public discontent with Ghana's austerity measures with inflation going up to 120% in the early 80s. Within that period, inflation rate in the country was very high as well as its volatility but smoothen out with a downward trend from the early 2000 – 2009 as shown in figure 2.
 | Figure 2. Ghana: inflation GDP growth rate (1980-2009) |
2.3. Nigeria
- Agriculture used to be the principal foreign exchange earner of Nigeria. At one time, Nigeria was the world's largest exporter of groundnuts, cocoa, and palm oil and a significant producer of coconuts, citrus fruits, maize, pearl millet, cassava, yams and sugar cane. About 60% of Nigerians work in the agricultural sector, and Nigeria has vast areas of underutilized arable land.The discovery of oil in the country changed the face of the economy tremendously since the early 70s. The oil sector remains the main and dominant source of growth in Nigeria’s gross domestic product as it constitutes about 91% of the country’s GDP. It is observed that the GDP has maintained a steady rise since the 1970s. In the late 70s and early 80s, the country recorded an average growth rate of 8%. The GDP of the country is estimated at $377.949 billion with per capita $2,422. Previously in Nigeria, economic development had been hindered by years of military rule, corruption, and mismanagement. It was a period characterized by price instability as shown in figure 3 above. Inflation has its major kink between 1993 and 1994 when it rose to 72% from 13% in 1991, representing a rise of about 460%. The fluctuations in these rates make policy formulation and implementation very difficult for the monetary authorities.
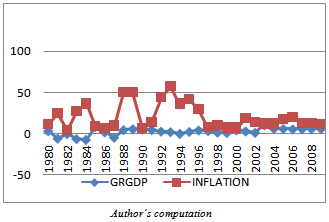 | Figure 3. Nigeria:inflation and GDP growth rate (1980-2009) |
2.4. Senegal
- The mainstay of the economy of Senegal include the exportation of fish, chemicals, cotton, fabrics, groundnuts, and calcium phosphate, with India as one of their major trading partners while others are United States, Italy and the United Kingdom. Senegal has an estimated Population as at 2009 of 13,711,597 with GDP (PPP) as at 2010 of $23.274 billion and per capita $1,772. After its economy retracted by 2.1% in 1993 Senegal instigated a major economic reform program with the support of the international donor community. This reform began with a 50% devaluation of the country's currency, the CFA franc (see figure 4).
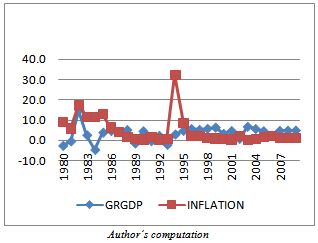 | Figure 4. senegal:inflation and GDP growth rate (1980-2009) |
3. Literature Review
- An appraisal of literatures on inflation and output reveals that several scholars and researchers worldwide have attempted to examine the subject matter with scope ranging from country-specific studies to panel of countries. Some of these literatures are reviewed in this section. Khan and Senhadji[8] examine the issue of the existence of threshold effects in the relationship between inflation and growth, using new econometric techniques that provide procedures for estimation and inference for 140 developed and developing countries. They estimate a threshold level of inflation above which inflation significantly slows growth at 1–3 percent for developed countries and 11–12 percent for developing countries. The negative and significant relationship between inflation and growth, for inflation rates above the threshold level, is quite robust with respect to the estimation method, perturbations in the location of the threshold level, the exclusion of high-inflation observations, data frequency, and alternative specifications. Sargsyan[11] carried out the threshold effect study in the relationship between inflation and output in Armenia. The purpose is to test for a threshold level of inflation at which the effect of inflation on growth changes from negative to positive, as inflation passes that level. The threshold level of inflation is calculated using specific econometric technique as in Sarel[7] or Khan and Senhadji[8], which though was primarily used for panel data models, is applicable to time series models as well. The estimation results reveal a 4.5% threshold level. The threshold level of inflation at 4.5% means that this level of inflation is the break-even level of inflation, above which inflation has a negative impact on the growth rate of output. The paper concluded that targeting a level of inflation higher than current but not exceeding calculated threshold level might be beneficial for Armenia.Ahmed and Mortaza[12] postulated that moderate and stable inflation rates promote the development process of a country, and hence economic growth. Moderate inflation supplements return to savers, enhances investment, and therefore, accelerates economic growth of the country. They explore the present relationship between inflation and economic growth in the context of Bangladesh. Using annual data set on real GDP and CPI for the period of 1980 to 2005, an assessment of empirical evidence has been acquired through the co-integration and error correction models. They also explore what the threshold level of inflation should be for the economy. It is established that there exists a statistically significant long-run negative relationship between inflation and economic growth for the country as indicated by a statistically significant long-run negative relationship between CPI and real GDP. The estimated threshold model suggests 6-percent as the threshold level (i.e., structural break point) of inflation above which inflation adversely affects economic growth. Quartey[13] put forward that the aim of the policy of price stability is to provide a stable environment for real sector activities to flourish but the outcome of the policy on real sector activities in Ghana has not been subjected to any empirical investigation. The study investigates the revenue maximizing and the ‘growth maximizing’ rate of inflation for Ghana using data from Bank of Ghana and WDI. The study finds that economic performance is higher under low inflation era than when inflation is high. The results are robust and show that the revenue maximizing rate of inflation for Ghana is 9.14 per cent using quarterly data over the period 1990-2006. It is also deduced from the study that the single digit inflation target set by the Central Bank Ghana is not growth maximizing.Sergii[14] investigates the growth-inflation interaction for Commonwealth of Independent States (CIS) for the period of 2001-2008. It is found out that this relation is strictly concave with some threshold level of inflation, which is in line with the previous empirical studies based on earlier sample periods. Inflation threshold level is estimated using a non-linear least squares technique, and inference is made applying a bootstrap approach. The main findings are that when inflation level is higher than 8% economic growth is slowed down, otherwise, it is promoted. The non-linear growth-inflation interaction is quite robust to the estimation method and specification.Li[10] corroborated that high rate of inflation causes problems not just for some individuals, but for aggregate economic performance. But less agreement exists about the precise relationship between inflation and economic performance, and the mechanism by which inflation affects economic activity. The study examines the relationship between inflation and economic performance by using data for 90 developing countries and 28 developed countries over the period 1961-2004. The evidence strongly supports the view that the relationship between inflation and economic growth is nonlinear. For the developing countries, the data suggested two thresholds relating economic growth and inflation. The first and second threshold levels were estimated to be 14% and 38% respectively. At the rates of inflation lower than those of the first threshold, the effect is obscure and positive; at rates between the two threshold levels, the effect is significant and strongly negative; at extremely high rates the impact diminishes but still significantly negative. For the developed countries, only one significant threshold is detected (24%). At rates below this threshold, inflation has a significantly negative effect on economic growth, while the magnitude diminishes as inflation exceeds this threshold.Gokal and Hanif[15] examines the relationship between inflation and economic growth in Fiji and observed that one of the most fundamental objectives of macroeconomic policies in Fiji is to sustain high economic growth together with low inflation. But there has been considerable debate on the nature of the inflation and growth relationship. Thus, it is tested whether a meaningful relationship holds in Fiji’s case. The tests reveal that a weak negative correlation exists between inflation and growth, while the change in output gap bears significant bearing. A causality test is also conducted and the results show that causality between the two variables runs one-way from GDP growth to inflation. Lupu[16] conducts a study on the correlation between inflation and economic growth in Romania and highlights the existence of interdependence between the phenomena of inflation and that of the growth process. Preferences on issues of relationship between inflation and economic growth is necessary because its analysis reveals huge potential for development and for the fact that it promotes the transition process in Romania which was the route to efficient functioning of competitive market economy. The research was conducted using ideological and quantitative approach, and the research results show that the relationship can be seen in two ways, one that reflects the negative aspect of the relationship between the two where an increase in inflation reduces output productivity (at high level of inflation). Over this period of time (1990-2000), inflation in Romania was oscillating, high, mainly as a consequence of the effects of the delay in the essential restructuring of the economy; the recurrent cessation of the stabilizing efforts; the inadequate wage policy; the expanded financial disorder; the decrease of the domestic output of goods and services. On the other hand, there is the one that reflects the positive aspect of the relationship between the two where stability in inflation raises output productivity. Over this period of time (2001-2009), inflation in Romania was reduced drastically to 5.8% in 2009.Fielding[17] uses monthly time-series data on the prices of 96 individual products in the 37 states of Nigeria to analyze the factors that drive inflation volatility. Among the significant determinants of volatility are average inflation rates, transport and communication infrastructure, consumer access to credit markets and urbanization. Analysis of the data reveals that there is substantial heterogeneity across products in relative importance of these non-monetary factors that drive inflation volatility. Accordingly, better transport and communication infrastructure, as captured by road length, literacy and linguistic homogeneity, are associated with lower inflation volatility in a state. However, more extensive access to credit facilities is associated with higher inflation volatility, as is urbanization. Since most changes in inflation are unanticipated, these results apply equally to conditional and unconditional inflation volatility.
4. Theoretical Framework and Methodology
4.1. Theoretical Framework: Output and Inflation
- Barro and Gordon[18] consider an economy where aggregate real effects and expectations about inflation affect aggregate supply. These effects can be captured by assuming that aggregate supply is given by the Lucas-type supply curve Romer[19]:
 | (1) |
 is the log of its flexible-price level; π and πe are actual and expected inflation respectively. It is assumed that the flexible-price level of output is less than the social optimal level. This could arise from positive marginal tax rates or from imperfect competition. One major assumption here is that inflation above some level is costly and that the marginal cost of inflation increases as inflation rises. A way to capture these is to make social welfare quadratic in both output and inflation. Therefore, the objective of the monetary authority is the minimization of the loss function:
  | (2) |
 | (3) |
 | (4) |
 | (5) |
 | (6) |
 | (7) |
 | (8) |
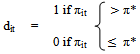
 . The equilibrium is for expected and actual inflation to rise to the point where the marginal cost of inflation balances its marginal benefit through higher output[19]. Methodology and the ModelThis paper utilizes the panel regression model as in Sarel[7] or Khan and Senhadji[8] to estimate the threshold level of inflation for West Africa. The equation to estimate threshold level of inflation has been considered in the following conditional form:
 | (9) |
 | (10) |
 | (11) |
5. Estimation and Results
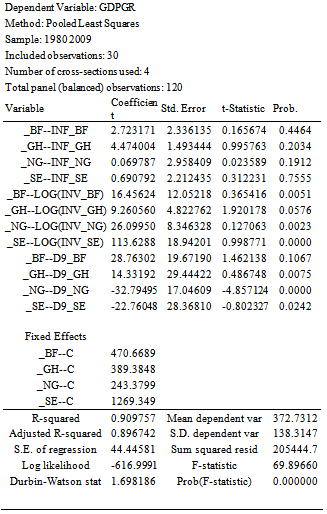
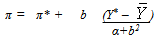
- As stated earlier, to find the threshold level of inflation, equation (12) is estimated for various annual levels of π* in the range of[2-14]. After each estimation, corresponding values of adjusted- R2 are collected, and the optimal threshold is identified as
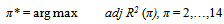 Where adj R2 (π) depend on the chosen threshold level of inflation.The result of the estimation is shown in the table in appendix 1. The result shows the final estimation output, with threshold level of inflation identified at 9% annually. The adjusted-R2 statistic reached its maximum at the level of π * = 9%. Figure 5 shows the behavior of the values of adjusted-R2 at different values of threshold levels of inflation.
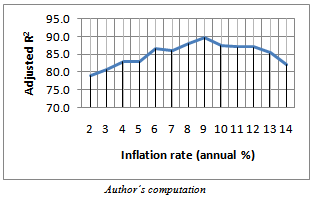 | Figure 5. Values of adjusted R-squared at different threshold levels of inflation |
6. Conclusions and Recommendations
- This paper empirically explores the issue of the existence of threshold effect in the present relationship between inflation and economic growth in the context of West African economies. The data cover four countries in the West African region: Burkina Faso, Ghana, Nigeria and Senegal for the period 1980–2009. Estimates were obtained for the panel data analysis. The empirical results strongly suggest the existence of a threshold beyond which inflation exerts a negative effect on growth. This threshold is found to be 9%. This threshold level is more or less consistent with that obtained by Khan and Senhadji[8] but lower for developing countries. (Their estimates are 1–3 percent and 11–12 percent for industrial and developing countries respectively, depending on the estimation method). Below the threshold, the relationship is found to be positive but insignificant. This finding in this study is significant as it is a useful tool at the disposal of the monetary authorities of the countries in the region in formulating policies that would track inflation and keep it in check. With this finding, the authorities can now strive towards the attainment of the highest possible level of output without fear of high price prevalence if the threshold level can be sustained.The region of West Africa needs to focus on maintaining a stable price level if they want to attain the dream of being among the developed countries; as macroeconomic stability and the necessary infrastructures are among the preconditions for sustained growth. Among the ways inflation can affect growth, an important avenue is the effect of inflation on investment. Low or moderate inflation is an indicator of macroeconomic stability and creates an environment conducive for investment. This is supported by the significant and strong relationship found between investment and output in this study. Since a threshold level is found, monetary authorities of the region should embark upon inflation targeting at the optimal threshold level as this is the point that maximizes output. Inflation levels far below the threshold level can be sub-optimal because firms are better off when prices rise. But a long term price increase has its negative effect on households’ pockets. As nominal wages in the region are somewhat sticky, it takes time for nominal wages to adjust to inflation. Also because of imperfections in the market and weak financial intermediation, relative price adjustment usually takes longer period of time, and therefore the effect of inflation on the real sector of the economy drags for long. From this perspective, West African economies can accommodate to higher inflation more easily than its developed counterparts. This is reflecting the fact that, a stable low level of inflation is necessary, but not sufficient, for economic growth and prosperity. However because of the high rigidity of nominal wages and prices, a higher growth rates targeting somewhat higher level of inflation can be achieved at a given stable and sustainable level of investment in the region. Inflation rates higher than the breaking point (9%) will be at the expense of economic growth for the region.Furthermore, to promote growth and keep inflation low, the government needs to control budget deficits as these spending in developing countries are often precursory to inflationary pressures. While simulations indicate that budget deficit control can be achieved by switching public expenditure from consumption to investment, this may be a difficult policy to pursue, especially in the West African economic settings which are often characterized by maladministration and profligacy. However, the overarching message is that the government should curtail unproductive expenditure, which is bad for both growth and inflation, in favour of investment. This study is limited in the sense that the analysis carried out does not take into account the characteristics of the relationship between inflation and output in the region. Therefore, further research is imperative in this respect.
APPENDIX
- Appendix 1: Estimation results for the basic model