-
Paper Information
- Previous Paper
- Paper Submission
-
Journal Information
- About This Journal
- Editorial Board
- Current Issue
- Archive
- Author Guidelines
- Contact Us
American Journal of Economics
p-ISSN: 2166-4951 e-ISSN: 2166-496X
2013; 3(5): 210-221
doi:10.5923/j.economics.20130305.02
The Relative Impacts of Federal Capital and Recurrent Expenditures on Nigeria’s Economy (1980-2011)
 Abstract
 Reference
 Full-Text PDF
 Full-text HTML
Oziengbe Scott Aigheyisi
Department of Economics and Statistics, University of Benin, Benin City, Nigeria
Correspondence to: Oziengbe Scott Aigheyisi, Department of Economics and Statistics, University of Benin, Benin City, Nigeria.
| Email: |  |
Copyright © 2012 Scientific & Academic Publishing. All Rights Reserved.
The paper explores the relative impacts of federal capital and recurrent expenditures on Nigeria’s economy in the 1980–2011 period. The empirical analysis begins with an investigation of the effect of total government expenditure (GOVEXP) on gross domestic product (GDP) using multiple linear regression analysis. The estimation result provides evidence that strongly supports Ram’s growth accounting model. GOVEXP was thereafter disaggregated into capital expenditure (CAPEXP) and recurrent expenditure (RECEXP) and the impacts of these on GDP were investigated by exploiting the cointegration and error correction mechanism. Unit root test results indicate that the variables which were non-stationary in levels became stationary after first differencing. The cointegration test result indicates the existence of a long-run relationship between the variables. The estimated ECM model reveals that the short-run impact of each explanatory variable on GDP was statistically insignificant contemporaneously, but significant with a lag, with RECEXP exerting greater impact than CAPEXP, though the impact of the former was negative while that of the latter was positive. The variance decomposition results indicate that the proportion of forecast error variance of GDP explained by innovations in RECEXP dominates the proportion explained by innovations in CAPEXP in all the periods. The paper recommends, inter alia that larger share of government expenditure should go into provision of infrastructure and other capital projects.
Keywords: Government Expenditure, Capital Expenditure, Recurrent Expenditure, Economy
Cite this paper: Oziengbe Scott Aigheyisi, The Relative Impacts of Federal Capital and Recurrent Expenditures on Nigeria’s Economy (1980-2011), American Journal of Economics, Vol. 3 No. 5, 2013, pp. 210-221. doi: 10.5923/j.economics.20130305.02.
Article Outline
1. Introduction
- Government expenditures play key roles in the operation of all economies. It refers to expenses incurred by the government for the maintenance of itself and provision of public goods, services and works needed to foster or promote economic growth and improve the welfare of people in the society. Government (public) expenditures are generally categorized into expenditures on administration, defense, internal securities, health, education, foreign affairs, etc. and has both capital and recurrent components. Capital expenditure refers to the amount spent in the acquisition of fixed (productive) assets (whose useful life extends beyond the accounting or fiscal year), as well as expenditure incurred in the upgrade/improvement of existing fixed assets such as lands, building, roads, machines and equipment, etc., including intangible assets. Expenditure in research also falls within this component of government expenditure. Capital expenditure is usually seen as expenditure creating future benefits, as there could be some lags between when it is incurred and when it takes effect on the economy. Recurrent expenditure on the other hand refers to expenditure on purchase of goods and services, wages and salaries, operations as well as current grants and subsidies (usually classified as transfer payments). Recurrent expenditure, excluding transfer payments, is also referred to as government final consumption expenditure. The annual budget spells out the direction of the expected expenditure, as it contains details of the proposed expenditure for each year, though the actual expenditures may differ from the budget figures due, for example, to extra-budgetary expenditures or allocations during the course of the fiscal year.Government expenditure is a major component of national income as seen in the expenditure approach to measuring national income: (Y = C+I+G +(X – M)). This implies that government expenditure is a key determinant of the size of the economy and of economic growth. However, it could act as a two-edged sword: It could significantly boost aggregate output, especially in developing countries where there are massive market failures and poverty traps, and it could also have adverse consequences such as unintended inflation and boom-bust cycles (Wang and Wen, 2013). The effectiveness of government expenditure in expanding the economy and fostering rapid economic growth depends on whether it is productive or unproductive. All things being equal, productive government expenditure would have positive effect on the economy, while unproductive expenditure would have the reverse effect.The objective of this paper is to investigate the relative impacts of capital and recurrent expenditures on Nigeria’s economy in the 1980-2011 period. The rest of the paper is organized as follow: Section 2 contains a brief statement of the issue that the paper addresses. Trends in government expenditure are discussed in section 3. The theoretical framework and review of empirical literature are contained in section 4. Detailed and rigorous empirical analysis is presented in section 5. Section 6 contains the summary of the findings, and the conclusion. Section 7 contains the recommendations of the paper.
2. The Problem
- For a resource- and cash- rich country having nearly 70% of its population living in relative poverty conditions, whose infrastructures are in a state of decay, whose health, education and other growth-promoting and welfare - enhancing institutions are in near state of near-collapse, whose roads (most of them) have become death traps due to their deplorable conditions, and whose power sector is in a state of moribund, one would expect that the share of capital expenditure in total expenditure dominates that of recurrent expenditure, considering the role it plays in economic growth and human development, but this has not been the case for Nigeria. The very high rates of unemployment, illiteracy rate, poverty rate (evidenced in the number of people living in shanties, with little or no access to quality education, medi-care, potable water, etc.), low human development index, etc., do not match the ever growing expenditures dominated by recurrent expenditure, though statistics have shown that the growth rate of the nation’s economy had been impressive in recent times. This goes to show that the country has been experiencing jobless growth and growth without development. It also shows that a large percentage of Nigeria’s population does not benefit from the expenditures of her government. Thus the intended objectives and goals of government expenditure have been largely defeated.
3. Trends in Federal Government Expenditures in Nigeria (1980-2011)
- Federal expenditure in Nigeria is classified into expenditures in government functions such as administration, social and community services, economic services and transfers. Expenditure on administration includes general administration, defense, internal security and national assembly. Expenditures on social and community services include those on education, health and other social and community services. Expenditures on economic services include those on agriculture, construction, transport and communication and other economic services. Government transfers include public debt servicing, pensions and gratuities, contingencies/subventions, etc. (CBN Statistical Bulletin, 2011). With the exception of government transfers, other classes or categories of government expenditure have capital and recurrent components. The trends in Nigeria’s federal government recurrent and capital expenditure in the 1980 – 2011 period are discussed below.
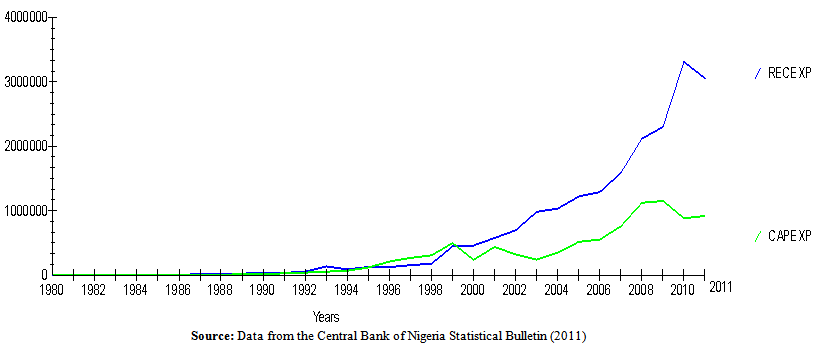 | Figure 1. Trends in Nigeria’s Federal Government Recurrent and Capital Expenditure (1980 – 2011) |
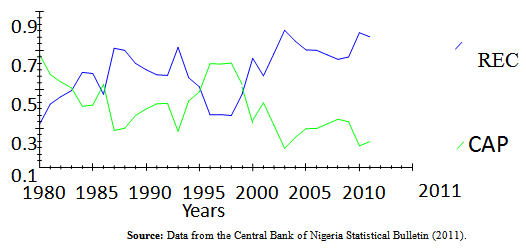 | Figure 2. Trends in proportion of recurrent expenditure (REC) and capital expenditure (CAP) in total expenditure (1980-2011) |
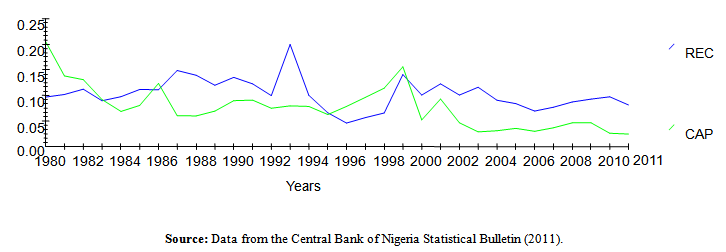 | Figure 3. Trends of Recurrent and Capital Expenditure in GDP (1980-2011) |
4. Theoretical Framework and Review of Empirical Literature
- The determinants of government expenditures are well documented in the extant literature. Economic theories and hypotheses such as those of Wagner, Wiseman and Peacock, etc. help to explain the determinants of the growth of government expenditure, prominent among which is the size of the government. Specifically, Wagner’s law (also referred as the law of increasing State activity or the law of expanding State role) states that as the economy develops (evidenced in high rate of industrialization and the growth of per capita income), the share of government expenditure in the gross national product tends to rise accordingly. Here, the growth of government expenditure is attributed to economic growth and development. Peacock and Wagner’s hypothesis emanated from a study that was premised on Wagner’s Law. According to this hypothesis, industrialization which elicits increased government spending also enhances government revenue generation, particularly through taxation which is used to finance government expenditure. Peacock and Wiseman were however of the view that government expenditure evolves in a step-like pattern, owing to variations in pattern of government expenditure in periods of upheaval and periods of relative calmness. Government revenue from taxation increases in period of upheaval as the tax-resistance level of the people tends to decline. The revenue generated from enhanced taxation is used to finance government expenditure which expectedly increases during the period of upheaval. Once calmness is restored, government expenditure does not usually go down to its previous trend. The Keynesian theory asserts that governmentexpenditure especially deficit financing could provide short - term stimulus to help halt a recession or depression. The Keynesians however advised that policy makers should be prepared to reduce government expenditure once the economy recovers to forestall inflation (Mitchell, 2005). Much empirical researches have been conducted to investigate the impact of government expenditure on economic growth in various countries. The results however have been mixed. While some observe that public expenditure favours growth, others argue that excessive government expenditure could be detrimental to growth. Sinha (1998) studies the relationship between government expenditure and GDP in China, and finds that a strong positive relationship exists between both variables. The Granger causality test shows there is evidence (though weak) of unidirectional causality, with causality running from government expenditure to GDP. Loizides and Vamvoukas (2004) investigate the causal relationship between the relative size of government (measured as the share of total expenditure in GNP) and economic growth rate using data on Greece, UK and Ireland, and find that government size Granger causes economic growth rate in all three countries in the short run, and in the long run for Ireland and UK, and that economic growth Granger causes increase in the relative size of government in Greece, and Ireland when inflation is included.In a study to examine the growth effects of public expenditure for a panel of 30 developing countries over the 1970s and 1980s Bose et al (2007) finds that the share of government capital expenditure in GDP is positively and significantly correlated with economic growth, while current expenditure is observed to be insignificant. At the disaggregated level, government investment in education and total expenditures in education are the only outlays that were observed to be significantly associated with growth it the budget constraint and omitted variables are taken into consideration. Applying two different panel datamethodologies to seven transition economies in South Eastern Europe, Alexiou (2009) finds evidence for the support of significant positive effect of government spending on capital formation on economic growth. Cooray (2009) investigated the role of the government in economic growth by extending the neoclassical production function to incorporate two dimensions of government - the size dimension (measured by government expenditure) and quality dimension (measured by governance) for a cross-section of 71 economies. The empirical results indicate that the two dimensions of government are important for economic growth. Similarly, Wu et al (2010) examined the causal relationship between government expenditure and economic growth by utilizing a panel data set which include 182 countries covering the period from 1950 to 2004, and their results provided evidence that strongly supports both Wagner’s law and the hypothesis that government spending favours economic growth regardless of how government size and economic growth are measured. By disaggregating the countries by income levels and the degree of corruption, their result also confirmed existence of bi-directional causality between government activities and economic growth for the different sub-samples of countries, with the exception of low income countries.In a study to investigate the impact of government expenditure (disaggregated into various components) on economic growth in Nigeria in the 1970-2008 period, Nurudeen and Usman (2010) find that government total capital expenditure, total recurrent expenditure and expenditure on education have negative effect on economic growth. Expenditure on transport, communication and health are however observed to have positive effect on growth. Similar study by Loto (2011), employs the method of cointegration and error correction mechanism to investigate the impact of government expenditures in various sector of the economy such as education, health, national security, transportation and communication, and agriculture, on economic growth in Nigeria in the 1980-2000 period, and finds that government expenditure on agriculture and education impact negatively on economic growth, though the impact of expenditure on education is observed to be insignificant. The impact of expenditure in the health sector on economic growth is observed to be positive and significant, while the impact of expenditure on national security, transportation and communication are observed to be positive and statistically insignificant.. Employing the ordinary least squares estimation technique, Muritala and Taiwo (2011), investigate the effect of recurrent and capital expenditure on GDP and find that both components of government expenditure have significant positive effects on the GDP. Using different regression models for time series data covering the period 1990-2006 on Jordan, Dandan (2011) finds that government expenditure at the aggregate level has positive impact on the growth of GDP. He also finds that interest payment (a control variable in the model) has no influence on GDP growth. In a study to examine the relative effectiveness of monetary and fiscal policies in Nigeria, Aigheyisi (2011), employs the method of cointegration and error correction using quarterly data spanning the period 1981Q3 to 2009Q4 and finds that total government expenditure (acting as proxy for fiscal policy) positively affected real gross domestic product (RGDP) in the short run. By regressing GDP on capital and recurrent expenditure (after deflating data on all variables by the consumer price index, CPI), Sharma (2012) finds an insignificant negative relationship between the capital expenditure and recurrent expenditure, and the real GDP for the Nepalese economy, attributed to mismanagement and embezzlement of public funds by government officials and political appointees. Modebe et al (2012), investigate the impact of recurrent and capital expenditure on Nigeria’s economic growth using multiple regression analysis for data covering the period 1987 to 2010 and find that the impact of both components of expenditure was statisticallyinsignificant, though the impact of recurrent expenditure was positive and that of capital expenditure, negative. However, the findings cannot be relied upon as the diagnostic statistics prove the estimated model to be invalid. For example, the DW-statistic of 1.413043 points to the problem of positive autocorrelation, which could render policies formulated on the basis of such models impotent.Onakoya and Somole (2013) employ the three-stage least square simultaneous equations estimation technique to examine the impact of public capital expenditure on economic growth in Nigeria in the context ofmacroeconomic framework at sectoral level. The empirical results reveal that public capital expenditure contributes significantly to economic growth in Nigeria. The results also show that public capital expenditure directly, positively impacts the output of oil and manufacturing, but adversely affected the output of manufacturing and agriculture. The impact on the services sector is however observed to be insignificant. Further evidence from the empirical results is that public capital expenditure indirectly enhances economic growth by encouraging private sector investment attributable to the facilitating role of government in the provision of public goods/infrastructure.
5. Empirical Analysis
5.1. Effect of Government Expenditure on Nigeria’s Economy (Multiple Linear Regression Analysis)
- We begin the analysis by investigating the effect of total government expenditure on Nigeria’s economy in the 1980 – 2011 period. The ordinary least squares estimation technique will be explored for this. Thereafter total expenditure will be disaggregated into capital and recurrent components and the impacts of each component on the economy will be examined using the error correction methodology.The model to be estimated is specified functionally as follow:
 | (1) |
 | (2) |
|
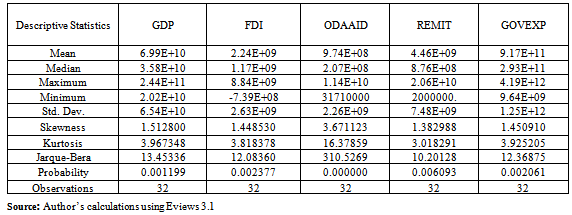
5.1.1. Descriptive Statistics of (Distributions of) Variables
- It can be observed from Table 1 that out of the three external sources of development finance considered, on average, the amount of official development assistance and foreign aid that flowed into the country in the period under consideration exceeded the other the amount of the other (foreign direct investment and personal remittances received). It can also be observe that counter-intuitively, on average, the size of government expenditure within the period under review exceeded the size of the GDP. Data from the World Bank and the Central Bank of Nigeria show that from 1980 to 1987, the size of the GDP was greater than the size of government expenditure, but beginning from 1987 to 2011, the size of the latter dominated that of the former. The mean and median of the distribution of GOVEXP exceed those of other distribution being considered. All the distributions are positively skewed, with the ODAAID distribution having the longest tail. Apart from the REMIT distribution whose Kurtosis value indicates “near normality”, the Kurtosis values of the other distributions indicate that they are leptokurtic, with the ODAAIAD displaying the highest degree. The probabilities of the Jarque-Bera statistics indicate that the skewness and the Kurtosis of the distribution do not match normal distributions, and so the null hypothesis of a normal distribution is rejected for each of the distributions.
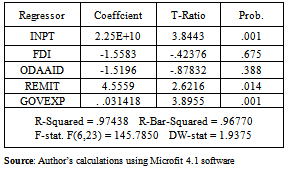
5.1.2. Multiple Linear Regression Estimation
- The result of the estimation of the model after correcting the preliminary OLS estimation results using the Cochrane-Orcutt estimator is presented in Table 2.The results show that only the signs on the coefficients of GOVEXP and REMIT conform to a priori expectations. The signs on the other variables do not. Moreover, these two variables also significantly explain variations in the dependent variable as they both pass the test of statistical significant at extremely low levels (0.8% and 0.03% levels respectively). The significant effect of government expenditure gives evidence in support of Ram’s growth accounting model which reveals that government size or spending “generally affects growth and performance in a favourable manner largely through a positive externality effect on growth” (Wu, n.d., p. 4). The other variables are quite insignificant in explaining the dependent variable. Thus within the period under review, government expenditure and personal remittances from Nigerians abroad contributed significantly to the size of the nation’s economy. The effects of FDI and ODAAID on the nation’s economy, though negative, were quite insignificant. We are however cautious not to insinuate that foreign aid, ODA and foreign direct investment pose dangers to the economy as they could be vital ingredient for economic growth and development if properly harnessed.
|
5.2. The Relative Impacts of Capital and Recurrent Expenditures on the Size of Nigeria’s Economy
- Having established that government expenditure, in totality, had significant positive effect on economic growth, we now proceed to investigate the relative impacts of its component on the economy in the period under review. We also begin by examining the descriptive statistics.
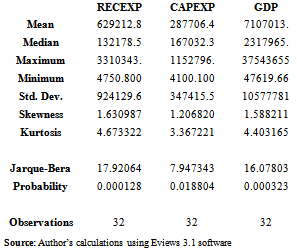
5.2.1. Analysis of Descriptive Statistic
- Data for the variables covering the sample period employed for the analysis are sourced from the Central Bank of Nigeria Statistical Bulletin, 2011. We begin our analysis by observing the descriptive statistics of each of the variables.
|
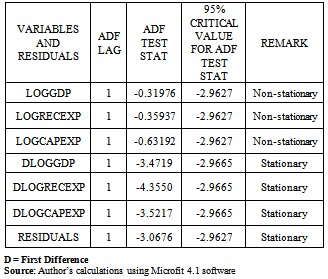
5.2.2. Cointegration and Error Correction Mechanism
- This study employs the cointegration and error correction methodology (ECM) advanced by Engle and Granger (1987). This methodology involves two steps, viz: testing the variables and residuals from the Ordinary Least Squares (OLS) regression of the dependent variable on the regressors, and estimating the error correction specification, given that the variables are found to be cointegrated. The cointegration test involves testing the OLS residuals for unit root. Where they are found to be cointegrated, this signifies the existence of causal relationship between the variables and implies the existence of long-run relationship between them. The Augmented Dickey Fuller (ADF) statistic will be employed to test for unit root. The logarithm of the variables will be employed for the analysis.The results of the unit root tests on the variables and residual are presented in the Table 4 below.
|
 | (3) |
|
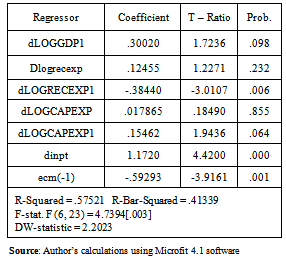
5.3. Discussion of Results
- The short-run impact of recurrent expenditure on gross domestic product is positive and statistically insignificant contemporaneously, though it impacts significantly (at the 1% level), albeit negatively, on the economy with a one-period lag. Specifically, within the period 1980 – 2011, a 10% increase in recurrent expenditure was associated with over 3.4% decrease in the gross domestic product. This negative impact runs contrary to a priori expectation and suggests that the Federal government’s recurrent expenditure has been inefficient, and that excessive recurrent expenditure has had depressing effect on the Nigerian economy. However, capital expenditure impacted positively on the economy, though the impact was strong/significant after a period lag as the coefficient passes the test of statistical significance at the 4% level. The signs on the coefficients of contemporary and lagged capital expenditure variables conform to a priori expectation. Within the period under review, a 10% rise in capital expenditure was associated with a 1.5% increase in the GDP. Thus, both recurrent and capital expenditure impacted oppositely, significantly on the GDP with a lag, though the impact of recurrent expenditure was stronger as indicated by the coefficients and the T-ratios. The coefficient of the error correction coefficient is as expected, negatively signed and statistically different from zero even at the 0.1% level. Thus it will rightly act to restore equilibrium within the system should there be any deviation from it in the short run. Its coefficient (measuring the speed of adjustment to equilibrium in the event of displacement from it) indicates that about 59.3% of the disequilibrium in the system is offset by short-run adjustment annually to maintain long run equilibrium. It further confirms that there is indeed a long-run cointegrating relationship between the variables of the model, just as it points to existence of causal relationships between the variables (see subsection 5.5).A look at the summary statistics reveals that the model has a fairly good fit, as the coefficient of determination (R- Squared) indicates that over 57.5% of the systematic variation in GDP is explained by the regressors. The F-statistic of 4.7394 is highly significant as it passes the test of statistical significance at the 0.3% level, indicating that the variables jointly explain the dependent variable (GDP), more so, significantly. The DW-statistic (which is greater than dU (=1.9313)) is also satisfactory, and so the null hypothesis of absence of serially correlated residuals (i.e. autocorrelation) is not rejected. These diagnostic tests confirm the validity of model. The model can therefore be relied upon for analysis and policy formulation.
5.4. Stability Test
- The stability of the (parameters of the) model was investigated with the plots of cumulative sum of recursive residual (CUSUM) and cumulative sum of squares of recursive residuals (CUSUMSQ). The plots are presented below.
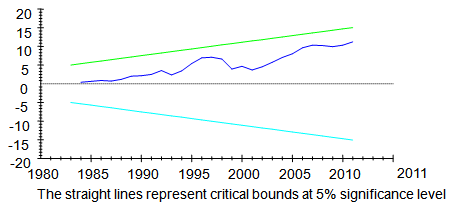 | Figure 4. Plot of Cumulative Sum of Recursive Residuals |
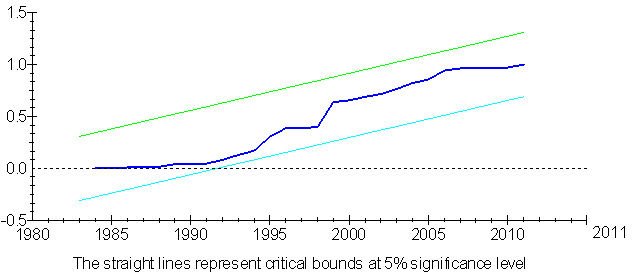 | Figure 5. Plot of Cumulative Sum of Squares of Recursive Residuals |
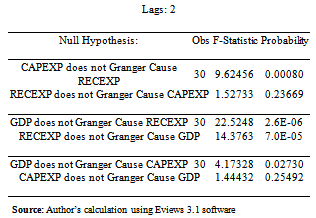
5.5. Granger Causality Test
- To confirm/establish the existence of causal relationship between federal government expenditure (recurrent and capital) and GDP and to further confirm the existence of long-run cointegrating relations between the variables, the pair-wise Granger causality test advanced by Granger (1969) was conducted. Cointegration relationship also implies existence of causal relationships (unidirectional or bidirectional) between the variables (Gujarati and Porter, 2009). The results of the test are presented below.The test was conducted using annual time series data for each variable. Results obtained are as reported in Table 6. Two-way (bidirectional) causation is observed between recurrent expenditure and GDP, in other words causality runs in both directions, while unidirectional causation is observed between capital expenditure and GDP, with causality running from GDP to capital expenditure, indicating that the size of the economy (GDP) is a significant predictor of the size (amount) of capital expenditure.
|
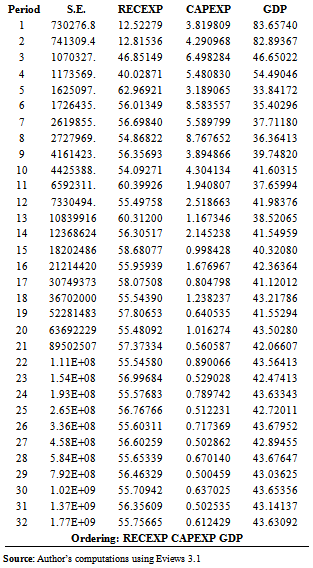
5.6. Forecast Error Variance Decomposition
- Further investigation of the relative impacts of recurrent expenditure and capital expenditure on the GDP was embarked upon by exploiting the forecast error variance decomposition to deduce the intertemporal response pattern of GDP to exogenous shocks to, or innovations in the expenditure variables, thus examining the proportion of the forecast error variance of the GDP that is explained by exogenous shocks to capital and recurrent expenditures within the period. The result is presented in Table 7.
|
6. Summary and Conclusions
6.1. Summary
- • Total government expenditure had significant positive effect on Nigeria’s economy in the period covered by the study, confirming the Ram’s postulation and the Keynesian theory. The implication is that Nigeria’s economy at its current stage of development owes much to government spending.• Remittances from Nigerians abroad played supplementary role to government expenditure in the 1980-2011 period. • The size of Nigeria’s economy is a significant predictor of the size (or amount) of capital expenditure, i.e. the amount spent on capital projects and/or the amount spent in the upgrade of such projects. • On average, Nigeria’s Federal Government’s recurrent expenditure exceeded her capital expenditure in the 1980 – 2011 sample period. This is considered preposterous, considering that as a developing country she ought to spend more on capital formation to boost the growth of her economy.• The estimated short-run (Error Correction) Model reveals that contemporaneously, the impacts of recurrent and capital expenditure on Nigeria’s GDP were statistically insignificant.• Both recurrent and capital expenditure impacted significantly on GDP after a one-period lag in the short run. The impact of recurrent expenditure on GDP was negative while that of capital expenditure was positive, though the (negative) impact of recurrent expenditure was stronger or more significant than that of capital expenditure. This was further confirmed by the results of the forecast error variance decomposition which revealed that the proportion of forecast error variance of GDP explained by innovations in recurrent expenditure consistently exceeded that of capital expenditure.• Nigeria’s Federal government recurrent expenditure had been largely unproductive and inefficient, while her capital expenditure had been relatively productive.
6.2. Conclusions
- This study further brings to the fore, the role of expenditure in capital formation in economic growth and development. It also reveals the dangerous and inhibiting effect of excessive recurrent expenditures on the size of the economy of a typical developing country. Government expenditure has been a significant driver of Nigeria’s economy, though the speed tends to be retarded or “slowed down” by the dominance of recurrent expenditure. The contribution to existing literature of this research is that it reveals that government expenditure contributes significantly to the size of Nigeria’s economy, though the predominance of recurrent expenditure in the composition has tended to reduce its effectiveness. It also reveals that personal remittances received from abroad has played significant supplementary role to government expenditure in the expansion of the size of the economy as measured by the GDP.
7. Recommendations
- Based on the empirical findings, the following are the recommendations of the research:1. Considering the current state of Nigeria’s economy, capital expenditure should be greater than recurrent expenditure in order to lay the foundation for sustainable development and growth. There is need for rational utilization of the nation’s resources. Furthermore, expenditures on items/activities that are irrelevant or have no significant linkage to growth should be avoided. Prudence on the part of the government is highly desired and this requires strong political will.2. Higher budgetary allocation to capital formation is not just what is needed. Utilization of disbursed funds meant for capital projects should be closely monitored, especially in the area of procurement (of goods, services and works) as this constitute a major channel through which political office holders and other government appointees connive with government contractors to siphon or embezzle public funds in the country. The Bureau of Public Procurement (BPP) should be strengthened to carry out its functions effectively. Those entrusted with utilization of public funds for development purposes should be made to account for every kobo expended. To this end, the anti-corruption agencies in the country (EFCC, ICPC) should be empowered and equipped to effectively carry out their functions. They should be allowed to function independently, instead of being used as tool for witch-hunting political opponents.3. Strong (effective and efficient) mechanism should be put on ground to ensure that the poor who are in the majority benefit from the expenditures of the federal government, as the state exists for the common good and none should be excluded from the benefits it offers. This is necessary to enhance improved welfare as the welfare of the people is a veritable ingredient for a robust economy.4. Transparency, rationality, responsiveness, equity, accountability, efficiency, adherence to the rule of law, economy, should be the guiding principles in the utilization of public funds. Until these are observed, the intended objectives and goals of government expenditure will not be realized.