Girma Teshome1, Belay Kassa2, Bezabih Emana3, Jema Haji4
1School of Agricultural Economics and Agribusiness, Haramaya University; P. O. Box: 106, Dire Dawa, Ethiopia
2Professor of Agricultural Economics, Haramaya University, P. O. Box 138, Dire Dawa, Ethiopia
3HEDBEZ Business and Consultancy PLC, P.O.Box 15805, Addis Ababa, Ethiopia
4Associate Professor of Economics, Haramaya University; P. O. Box: 138, Dire Dawa, Ethiopia
Correspondence to: Girma Teshome, School of Agricultural Economics and Agribusiness, Haramaya University; P. O. Box: 106, Dire Dawa, Ethiopia.
| Email: |  |
Copyright © 2012 Scientific & Academic Publishing. All Rights Reserved.
Abstract
This study empirically examines the determinants of investment activities of 700 sample respondent farm households in East Hararghe Zone of Oromia regional state in Ethiopia applying tobit model. A multistage sampling technique and probability proportional to size (PPS) random sampling technique was used to select the respondent households. The result of the analyses shows that 71.9% of the entire sample households had investment in different forms and intensity with the average amount of 6311.91 Birr in the study year. The patterns of their investments were on livestock production, land development, productive farm assets, family education, khat plantation, and small industry and business developments. The results of the econometric analysis reveal that sex of household head, household size, dependency ratio, livestock ownership, farm income, access to road, training participation, investment incentives, contact with development agents, corruption, objective of investment, and inflation perception of household head were found to significantly influence the willingness probability and intensity of capital use for investment among the sample households. The findings of the study calls for formal institutions to support and utilize farm households’ investment achievements as an engine for overall development of the country in general and rural areas of the country in particular.
Keywords:
Investment, Farm Households, Patterns of Investment, East Hararghe Zone, Oromia, Ethiopia
Cite this paper: Girma Teshome, Belay Kassa, Bezabih Emana, Jema Haji, Patterns and Determinates of Farm Households’ Investment in Rural Ethiopia: The Case of East Hararghe Zone, Oromia National Regional State, American Journal of Economics, Vol. 3 No. 4, 2013, pp. 191-198. doi: 10.5923/j.economics.20130304.02.
1. Introduction
Investment is one of a strategic variable in economic growth of a country. It is also important determinant of both households and individual wellbeing. However, lowinvestment level has been a dominant feature of the Ethiopian Economy. The average share of gross domestic savings and investment from GDP was 12.4 and 18.5 percent,respectively for the last twenty years. As a result, the average resource gap was 6.1 per cent during these years which was financed by external sources (AEO,[1]).Even though, numerous attempts were made to encourage investment in the country, the gross investment especially from the domestic economy is quite low. The average annual FDI flows to Ethiopia from 2003 to 2006 were only $399 million and increased to $816 million in 2008. Out of the total projects approved by the Ethiopian InvestmentAuthority and Regional Offices, agricultural investment has received low proportion compared to other sectors while service sector, manufacturing and processing constitute the largest share of the investment (EIA,[2]; NBE,[3]).However, the foundation for the Ethiopian economy is and must long remain agriculture. On average, it accounts for about 40 percent of the country's GDP, about 90 percent of the exports, employs about 80 percent of the labor force and also the supplier of food stuff to consumers and about 70 percent of raw materials to agro-industries in the country. In spite of its importance in the national economy, agriculture has been challenged by large and growing population,limited and deteriorating land resources and highly fluctuating growth (AEO,[1]). In recent years, the overall economic growth in Ethiopia is marked by the fast growth and impressive performances with gross domestic product (GDP) growth of 8.8 percent in 2010. However, the growth rate registered is often notcommensurate with the level of domestic saving and investment of the country. It is either mainly derived from foreign aid, foreign direct investment or foreign based loans (Economic Watch,[4]). Then, this has made the country to excessively depend on external resources to finance their development. These external resources are not only inadequate but also erratic and shrouded in various controversies and strings. To reduce external dependence and bring self-sustainingdevelopment, the importance of raising and having demand-driven domestic investment in the country is of a paramount importance.Therefore, this study tries to analyze the majordeterminants of investment behavior of farm households which has been less addressed in our country, particularly in the rural areas from microeconomic evidence. The study tries also to show the ground reality related to patterns and determinates of farm household investment activities of farm households in the study area and to fill the existing knowledge gap in the field of concern.
2. Review of Literature
Investment plays a crucial role in models of economic growth. It is the creation of capital or the net addition to capital stock. Investment can be a public investment, household investment and privet investment. Household investment is the common type in rural areas of developing countries. Household investment generally refers to purchasing assets for productive purpose by households. It is about the process of actual capital formation through increasing the production of inventory, or new factories, housing and tools production. Among the many household behavior, investment behavior is decisive, because the scale of investment and investment impact on the level of future income, and investment will determine the direction of growth trends of the country. Household investment can be productive investment, fixed asset investment, technology investment, and savings investment (Issahaku,[5]; Viaggi et. al.,[6]).Theories of household investmentThe theories of investment start from Keynesian theory, which first identified the existence of an independent investment function in the economy. It mainly suggests that interest rates have an effect on the level of planned household investment. A fall in interest rates decreases the cost of investment relative to the potential yield and as result planned capital investment margin may become worthwhile (Viaggi et. al.,[6]; Mishra et al.,[7]).Accelerator theory is the other prominent theory defining investment as a linear proportion of changes in output. According to Mishra et al.,[7] and Asante,[8] the model states that the larger the gap between the existing capital stock and the desired capital stock, the greater a firm’s rate of investment. Then, a net investment equation is: | (1) |
Where I= net investment, K*= desired capital stock, K-1= last period’s capital stock, and δ =partial adjustment coefficientAccording to Jorgenson,[9] as indicate by Asante,[8] the Neoclasical theories explains investment as the optimal capital stock is proportional to output and the user cost of capital in which capital depends on its price, the real rate of interest, the rate of depreciation and the tax structure. The “Q” theory of investment is a theory in neoclassical framework that explains investment as ratio of the market value of the existing capital stock to its replacement cost i.e.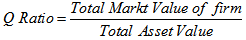 | (2) |
A low Q ratio (between 0 and 1) shows the stock is undervalued. On the other hand, a high Q ration (greater than 1) shows the stock is overvalued (Asante,[8]; Tobin,[10]).The neoliberal approach emphasizes the importance of financial deepening and high interest rates in stimulating growth. Investment is positively related to the real rate of interest. The reason for this is that a rise in interest rates increases the volume of financial savings through financial intermediaries and thereby raises investible funds (Viaggi et. al.,[6]).Irreversible investment theory (Pindyck,[11]) introduced an element of uncertainty into investment. The argument is that since capital goods are often firm-specific and has a low resale value; disinvestment is more costly than positive investment. Policy uncertainty is also another determinant of private investment. When a policy reform is introduced, rational behavior calls for withholding investment until much of the uncertainty regarding the eventual success of the reform is eliminated (Issahaku,[5]; Mishra et al.,[7]; Asante,[8]).The choice to invest by households can be as a consequence of many causal factors. But it is the fact that no single model or theory actually has the ability to account for every aspect of such a vastly broad subject. There have been many empirical studies on determinants of investment at national, household level and individuals by different researchers using time series data, panel data and cross sectional data with reference to some developing countries (Issahaku,[5]; Viaggi et. al.,[6]; Mishra et al.,[7]). The major potential determinants of household investment from these different empirical works are institutional factors, income and growth rates, demography, uncertainty measures, and external factors (Issahaku,[5]; Adeyemo and Bamire,[12]; Manyama,[13]).
3. Research Methodology
3.1. Description of the Study Area and Population
The study was conducted in East Hararghe zone of the Oromia reginal state in Ethiopia. The zone is geographically located between 7°32’ - 9°44’ North latitude and 41° 10’-43°16’ East longitudes with altitude ranging from 500 to 3405 meters above sea level (PEDO,[14].The Zone has a total population of 2,723,850 of whom 50.8 per cent are men and 49.2 per cent are women with population density of 151.87 persons per km2 and unevenly distributed (CSA,[15]). Of the total population of the zone 87.4 per cent, 12.6 per cent, and 1.11 per cent are residents of urban, rural and pastoralists, respectively.
3.2. Methods of Data Collection and Analysis
A multistage sampling technique and probability proportional to size (PPS)1 random sampling technique was used to select respondent households to collect primary data. 700 sample respondent households were used which was determined based on simplified formula developed by Yamane,[16] at 95 per cent confidence level, 0.5 degree of variability and 95 per cent level of precision. | (3) |
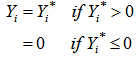
Where n is the sample size, N is total household heads, and e is the level of precision. Bottom of FormDifferent descriptive statistics were used to have a clear picture of socio-economic characteristics of all sample households and their responses. To analyze majordeterminants of household investment Tobit Model (Tobin,[10]) which is shown in equation (3.8) was used. This model was chosen because it has an advantage over other models in that it reveals both the probability of willingness and intensity of capital use which is tend to be censored at the lower limit of zero (Gujarati,[17]; Girma et al.,[18]). The tobit model specification is given as follows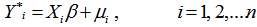 | (4) |
 | (5) |
Where: Yi: the observed household savings or annual household investmentYi* is the latent variable which is not observedΒ is Vector of unknown parameters µi is error terms that are assumed to be independently and normally distributed with mean zero and a constant variance  (i=1, 2 …n)Xi: - vector of independent variable affecting household investment. The threshold value in the above model is zero. The model parameters are estimated by maximizing the tobit likelihood function of the following form (Gujarati,[17]; Girma et al.,[18]; Maddala,[20]).
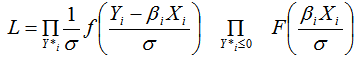 | (6) |
Where f and F are the density probability function and cumulative distribution function of Yi*, respectively.  Means the product over I for which Yi*≤0, and
  means the product over those I for which Yi*>0.Decomposition techniques were used to analyze the effects of explanatory variables1. Change in the probability of gain in independent variable Xi changes is
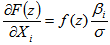 | (7) |
2. The marginal effect of an explanatory variable on the expected value of the dependent variable is: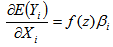 | (8) |
Where,The change in intensity of dependent variable with respect to a change in an explanatory variable among the investors category: F(z) is a cumulative normal distribution of z, f(z) is the value of the derivative of the normal curve at a given point (i.e. unit normal density), Z is the zero score for the area under the normal curve, β is a vector of tobit maximum likelihood estimate and  is the standard deviation of the error term.Prior to running the above specified models, all dependent variables were checked for the existence of data problems mainly multicollinearity problem, hetroscedasticity problem, and endogeneity problem.
4. Results and Discussion
4.1. Investment Performance of Households
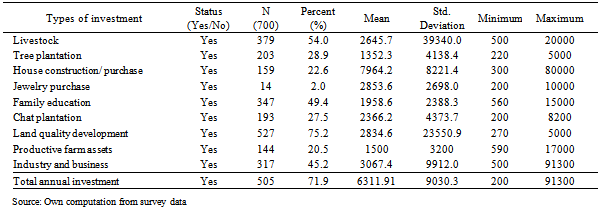
Table 1 shows that 505 (71.9%) of the entire sample households (700) had investment in different forms and intensity. The average amount of household investment was 6311.91 Birr with standard deviation of 9030.3 Birr with the lowest and the highest of 200 Birr and 91300 Birr, respectively.Table 1 also indicates the patterns of investment in the study area. The most common investment practices were investments on livestock production, land development, productive farm assets, tree plantation, house construction, jewelry purchase, family education, Khat2 plantation, and small industry and business developments. Large parts of investment by sample households were on physical assets through direct internal investment of households. Investment decisions of households on physical assets were not depend on its primary rate of return but its main determinant is likely to be its productivity. Investment in durable consumer goods was not included under physical investment as it is considered as part of consumption expenditure in this study.Of the total sample households 54.0% were participated on livestock production. This investment is mainly of the various investment choices, the highest share next to investment on land development. For land development activities like rigging of well, land conversion and fencing 75.2% of the total sample households invested. One reason for this large investment in land development activities was the general assistance and motivations given through the different government offices especially the development agents. Investment on tree plantation and chat plantations on which 28.9% and 27.5% of the total sample households participated also in the mind of the households contributing for land development besides its role to generate income from it, respectively. Of the 700 total sample households 20.5% had investments on productive farm assets. The productive farm assets were machineries, tools, buildings, and irrigation facilities used by sample households for production of crops and livestock. In order to increase farm production, quality and quantity of farm assets possessed by farmers exercise an important role.Of the total sample households 22.6% have invested in construction of houses and other buildings another area in which investment was made by many households was on family education on which 49.4% of respondentsparticipated. Investment in household business and industry has also another area on which households were participating. Whereas 45.2% of the them made investments under this investment category which were mainly sales of drinking and food items, blacksmithing, tannery, weaving, poetry, wood work, small industries (grain mill, etc.) and trading (animal, crop etc). Participation of large percentage of sample households indicates that there is a shift towards non-farm activities to diversify and increase their income by households. Moreover, only 2.0 % of the sample households have reported investing on jewelers and other financial instruments. This is one of the areas were the sample households have less participation mainly due to the return from this form of investment and value appreciation has not been considerable to the households.
4.1.1. Household Characteristics of the Sampled Respondents
The survey result showed the average age of household heads was 38.76 years with the minimum and maximum ages of 19 and 80 years, respectively and standard deviation of 11.528 years. Adult household heads were better in their investment as compared to young and old household heads. In the same case households with large family size are relatively better as compared to households with small family size in terms of saving and investment performance. There is also a significant statistical difference among households in their family size category in relation to their investment performances (χ2=0.01, p-value = 13.576) behavior.The sex and marital status were found to be one of the factors influencing household investment behaviors. In this study, among the total sampled household respondents heads 680 (97.1%) were male and the rest 20 (2.9%) were female. The proportion of male-headed and female-headed households with with investments was 493 (72.4%) and 11 (57.1%), respectively. This indicates that male headed households were relatively better in their investment status than female headed households. This is mainly due to many socio-cultural values and norms, males have freedom of mobility and participation in different meetings and consequently have better access to information. The educational status of households in the study area was considerably low. Most of these household heads had no formal education and are illiterate. From the total sample household heads about 349 (49.7%) of the household heads were illiterate.The result indicated that household heads with primary education (grade 1-4) category are relatively better (76.3% of literate households have investment) investmentperformance as compared to other educational categories of household heads.Table 1. Patterns of household investment
 |
| |
|
4.1.2. Asset Ownership of Households
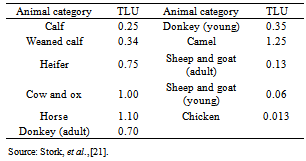
Land is one of the basic livelihood assets for all farm activities mainly in the study area. Land ownership status of households affects their farm productivity, wealth and living standard. The land holding of the sampled households in the study area ranged from 0.13 to 3.25 hectares (hec) with an average of 0.46 hec. Households with greater than 0.5 hec of land holding size are better in their investment performances as compared to households with less than 0.5 hec of land holding size. The chi-square test shows that there is a significant statistical difference among households in their land holding size related to household investmentperformance (χ2=17.215, p-value = 0.000) due to variations in land holdings among the sample households. Next to land, livestock is the most important asset as it is often used as a source of food, draft power, and income which usually serves as an index of wealth and prestige among rural communities in Ethiopia in general and study area in particular. Main livestock types in the study area consisted of cattle, equines, shoats and poultries which were used in this study after converting in to Tropical Livestock Conversion Unit (TLU) shown in Table 2 below.Table 2. Conversion factors used to compute tropical livestock units
 |
| |
|
The livestock ownership in the study area was one of the lowest in the country; because of lack of grazing land with an average of 2.25 TLU ranging between 0 to 10.77 livestock per household in TLU among selected householdrespondents with standard deviation of 1.584. The result revealed that there was significant statistical mean difference in ownership of livestock in number between households in their investment (χ2=93.063, p-value = 0.000) performances in relation to their livestock holding size.
4.1.3. Household Income and Expenditure Patterns
This survey result shows that, on-farm income and off/non farm income of the sample respondents were main sources of income for 68 percent and 2.8 percent of households, respectively. The remaining 34.2 percent of household’s main source of income was from both on-farm and off/ non-farm activities. The mean income of households with investment and with no investment was birr 21321.51 and 10988.36 with standard deviation of birr 20502.093 and 12029.120, respectively. The t-test for the two groups shows that there was statistically significant mean differencebetween the two household groups with respect to their on-farm income at less than 1% significance level (t-value=6.504, P-value= 0.000) with mean difference of 10333.2.The mean households’ total expenditure with investment and without investment was birr 19344.0 and 15955.4 with standard deviation of birr 20736.8 and 35084.3, respectively. From all the expenditures of sample households, expenditure for food items, farming inputs, non-food items and ceremonial purposes accounts for 53.94%, 15.6%, 20.0% and 10.5%, respectively. The t-test statistics for investment groups did not show significant mean difference between the two household groups
4.1.4. Access to Public Services and Economic Infrastructures
Availability of physical infrastructures and rural services are central to farm investment performances. In the study area, the average distance of households with investment and without investment was 8.3 km and 8.4 km with standard deviation of 7.3 km and 7.2 km, respectively. In the study area, 56.3% of sample respondent households have received credit services for different purposes either from formal or informal institutions and the remaining 43.7 % were not. 79.9% of households with investment and 20.1 % of households with no investment have got credit from different formal and informal sources in the study area during the survey year. The chi-square test ( =27.2 and P = .000) shows that there is a significant associations between households use of credit and investment activities of households. The survey result also indicated that on average household with investment were located 9.06 km and households with no investment were located 9.15 km distance from the nearest market place. Participation on agricultural production, saving and investment related training help farmers to create awareness. The survey result revealed that about 535 (76.3%) of the sample households participated in different trainings given in the production year. Of this 96 (13.4%) of the sample household who had investment were participated and not participated on different trainings given in the production year, respectively. The chi-square test indicate that training participation of households significantly(x2=25.103, P= 0.000) influence at 1 % level their investment activities (Table 29).
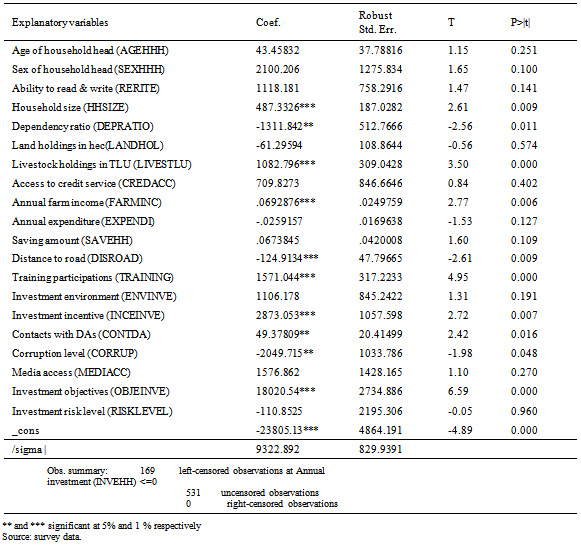
4.2. Results of the Tobit Model
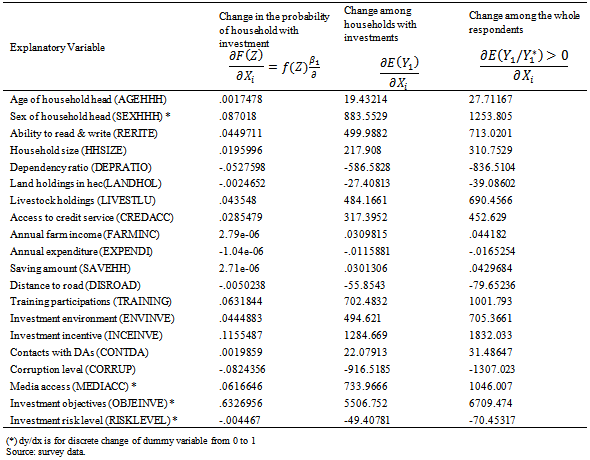
Prior to the use of the tobit model to analyze determinants of household investment in the study area, themulticollinearity problems were tested using variance inflation factor(VIF) and the result indicates the explanatory variables included in the model were not substantially correlated with each other. A total of 20 explanatory variables were considered in the econometric model out of which 12 variables were found to significantly influence the willingness probability and intensity of capital use for investment activities among the selected households. These were sex of household head, household size, dependency ratio, livestock ownership, farm income, access to road, training participation, investment incentives, contact with development agents, corruption, objective of investment, and inflation. The remaining 10 (age of sample household head, educational level of household heads, land holds, credit access, expenditure, savings, conducive investment environment, media access and risk level) were found to have no significant effect on the selected household investment activities. The marginal effects of the tobit model output measures the extent of capital use for investment activities of households with respect to a unit change of the explanatory variables. Table 4, shows the effect of marginal changes in explanatory variables on the intensity of capital use among households with investment and among the entire sample respondents.On average, change in the size of household size increases intensity of capital use by 217.90 birrr among households with investment and by 310.80 Birr among the entire sample. Similarly, livestock holding increases the intensity of capital use for investment activities by 484.2 Birr among households with investment and by 690.50 Birr among the entire sample.Trainings participations of household head increases intensity of capital use for investment by 702.6 Birr among households with investment and by 1001.80 Birr among the entire sample. In the same manner, access to investment incentives, increases the intensity of capital use for investment activities by 1284.70 Birr among households with investment and by 1832.0 Birr among the entire sample. Having clear objectives for investment activities of households increases the intensity of capital use for investment activities by 5506.8 Birr among households with investment and by 6709.50 Birr among the entire sample.On the contrary, a unit increase in dependency ratio reduces the intensity of capital use by 586.6 Birr among households with investment and by 836.6 Birr among the entire sample. Similarly, representing Corruption reduces the amount of capital investment by 916.6 Birr among households with investment and by 1307.02 Birr among the entire sample, Cetris peribus.Table 3. Tobit model estimates of the determinants of household’s investment
 |
| |
|
Table 4. Marginal effect of explanatory variables on household investment
 |
| |
|
5. Conclusions and Policy Implications
Ethiopia is one of the countries, where extreme poverty is the major challenge of overall national economy and its population. The existence of significant and high saving and investment gap is one of the outcomes of this extreme poverty. For sustainable development of the country, rising domestic investment in the country in general and among farm households in rural areas of the country in particular has a paramount importance.The conclusion from this study is that rural households do participate in investment in irrespective of their low income and have the highest potential for overall growth of national domestic investment of Ethiopia. This empirical study is contrary to the traditional theories of household investment explaining the poor cannot invest. The findings of this study further confirmed and identified that there were also various, demographic, social, economic, and institutional factors that were directly or indirectly responsible for the performance of farm household investment activities. Institutions should proactively support and promote investment in the rural areas by creating good investment environment, giving on teller made trainings and facilitating credit services for rural households.
Notes
1. The PPS is used to determine proportional allocation under which the sizes of the samples from the different cluster are kept proportional to the sizes of the cluster (Kothari, [19])2. khat is the cash crop widely grown in eastern part of Ethiopia. It is known by scientific name Catha edulis. It is typically cultivated as a shrub or small tree, sometimes reaching up to 15 meter in height.
References
| [1] | AEO (African Economic Outlook), 2011. Contry’s Overview: Ethiopia.[Online] Available: http:// www. Africaneconomicoutlook. org/en/countries/east-africa/ethiopia/[Feb 22, 2013] |
| [2] | EIA (Ethiopian Investment Agency), 2010. Ethiopian Investment Guide, Adiss Abeba, Ethiopia.[Online] Available: http://www.ethiopianembassy.org/PDF/Investment_Guide_2010.pdf[February, 2013]. |
| [3] | NBE (National Bank of Ethiopia) 2010. The Monthly Macroeconomic Indicators for the Month of March, 2010. Retrieved on January 27, 2013 from: http:// www. nbe. gov.et/pdf/monthlymacroeconomic/2010%20March/Monthly%20Macroeconomy%20indicator.pdf |
| [4] | Economic Watch, 2011. Ethiopian Economy.[Online]Available: http:// www. economywatch. com/ world_ economy / ethiopia/[February, 2013]. |
| [5] | Issahaku, H., 2011. Determinants of saving and investment in deprived district capitals in Ghana -a case study of Nadowli in the upper west region of Ghana. Continental J. Social Sciences 4: 1 - 11 |
| [6] | Viaggi D., Bartolini F., Raggi M., Sardonini L., Sammeth F. and Gomez y Paloma S. 2011. Farm Investment Behaviour under the CAP Reform Process. JRC scientific and technical reports |
| [7] | Mishra, P. K., J. R, Das and S. K. Mishra, 2010. The Dynamics of Savings and Investment Relationship in India. European Journal of Economics, Finance and Administrative Sciences, ISSN 1450-2275 Issue 18. EuroJournals, Inc. |
| [8] | Asante, Y., 2000. Determinants of Private Investment Behavior. Department of Economics University of Ghana Legon. African Economic Research Consortium Research Paper 100. Nairobi, Kenya. |
| [9] | Jorgenson, D., 1971. The economic impact of investment incentives. In Joint Economic Committee, long-termimplications of current tax and spending proposals. Washington, DC: Ninety-second congress, first session, 176-192. |
| [10] | Tobin, J., 1969. A General Equilibrium Approach To Monetary Theory Author(s): Source: Journal of Money, Credit and Banking, Vol. 1, No. 1, pp. 15-29. Ohio State University Press, USA. |
| [11] | Pindyck, R. S., 1991. Irreversibility, Uncertainty, andInvestment. Journal of Economic Literature, (xxix): 1110-1148. |
| [12] | Adeyemo, R. and A. S., Bamire, 2005. Saving and Investment Patterns of Cooperative Farmers in Southwestern Nigeria. Journal of Social Sciences, 11(3): 183-192.[Online] Available: http:/ /www. krepublishers. com/02- Journals/ JSS/JSS-11-0-000-000-2005-Web/JSS-11-3-173-258-2005-Abst-PDF/JSS-11-3-183-192-2005-254-Adeyemo-R/JSS-11-3-183-192-2005-254-Adeyemo-R-Full-Text.pdf[Feb 22, 2013] |
| [13] | Manyama, M. M., 2007. Instilling a Culture of Savings in South Africa. An MSc Thesis Presented at Gordon Institute of Business Science, University of Pretoria, South Africa. |
| [14] | PEDO (Planning and Economic Development Office), (1997). Zonal Atlas of Eastern Hararghe. Harar Printing Press. Harar. |
| [15] | CSA (Central Statistical Agency), (2010). FDRE General Country Data. |
| [16] | Yamane, T., 1967. Statistics, An Introductory Analysis, 2nd Ed., New York: Harper and Row |
| [17] | Gujarati, D.N. , 2007. Basic Econometrics.4th edition. Mc Graw-hill, Inc.,New York. |
| [18] | Girma Teshome, Belay Kassa, Bezabih Emana, and Jema Haji, 2013. Determinants of Rural Household Savings in Ethiopia: The Case of East Hararghe Zone, Oromia Regional State. Journal of Economics and Sustainable Development, Vol.4, No.3 |
| [19] | Kothari, C.R. , 2004. Research Methodology: Methods and Techniques. 2nd edition. New Age International Publications. Dharmesh Printers, Delhi. |
| [20] | Maddala, G.S., 2005. Introduction to Econometrics. 3rd Edition John Wiley & Sons (Asia) pte. Ltd, Singapore |
| [21] | Stork, H., Bezabeh, E., Berhanu, A., Borowiecki, A., andShimelis, W., 1991. Farming Systems and Farm Management Practices of Smallholders in the Hararghe Highlands: Farming Systems and Resource Economics in the Tropics,” Vol. 2 Wissenchaftsverlag, Vauk, Kiel, F.R., and Germany. |
 Abstract
 Reference
 Full-Text PDF
 Full-text HTML