Hemalatha Ramakrishnan
Management,Christ University Institute of Management, Christ University, Bangalore, 560 079, India
Correspondence to: Hemalatha Ramakrishnan, Management,Christ University Institute of Management, Christ University, Bangalore, 560 079, India.
| Email: |  |
Copyright © 2012 Scientific & Academic Publishing. All Rights Reserved.
Abstract
Cities in the third world are expanding more rapidly than the cities of the industrialized countries. Land use regulations were designed with the objective to “avoid congestion” Normally, a city is pictured as circle with the Central Business District at the center. Planning department conduct a review of land use regulations and land development practices to identify their impact on the shape taken by urbanization. Bangalore Development Authority (BDA) is the only development authority to have improved its operation in the last three decades to the point of becoming a major player in land development. Bangalore the capital city of Karnataka is one of the fastest developing Metropolitan cities in India. Is zones the best way to recognize, as the major objective of land in all use. With this probing situation the paper would like to investigate the development of the city under two phases during pre and post time period. How is land classified under various activities and finally, as per directions growth of the city has been analyzed. Momentum of changes that was initiated and still continues to develop based on time taken, quantum of land acquired and layout developed.
Keywords:
Land, Pattern, Development Authority, Zoning
Cite this paper: Hemalatha Ramakrishnan, Pattern of Land Use in Bangalore City, American Journal of Economics, Vol. 3 No. 3, 2013, pp. 133-139. doi: 10.5923/j.economics.20130303.01.
1. Introduction
Urban population in Karnataka has increased from 24% in 1971 to 29% in 1981, 30.92% in 1991 and 33.98% in 2001. When we compare the speed and growth of other metropolitan cities like Bombay, Madras, Calcutta and Delhi, Bangalore is today one of the top city in India. The city forms a part of Bangalore district, which is situated in the south- eastern part of Karnataka state. An analysis of decade wise growth rate of population in Bangalore reveals that it has recorded a high growth rate of 76% between 1971 to 1981 which was the highest for any metropolitan cities in India. The city became a good recipient of heavy doses of public investment in industry and infrastructure. Growing like a monster, the primate city of Bangalore gobbled up much that was vital for the growth of other towns and cities in the state The Bangalore Development Authority which is forming new layouts in different directions of the city leads to increase in growth percent (76%). Hence it is clear that Bangalore enjoys a rapid growth rate. The extend and growth of urbanization in the city is positive and is obvious through different factors. The study is based on the following objectives Firstly, to examine the origin of the development of Bangalore City. Secondly, to analyze the dynamism of growth of the city.Lastly, to find the progress of the city under various directions based on classification of activities. Methodology adopted is, study has used percentage calculation.Reliable data from CDP publication of the development authority was taken. and also from periodicals, magazines and newspapers.
1.1. Literature Review
Seshagiri1 in his article on “Bangalore Development” has said that Bangalore Development authority has taken up the importance of orderly development of city. The advantage of industrialization affords employment opportunities. People settle down wherever there is open space, thus starting a slum and congestion. He has suggested to create satellite towns to reduce over congestion. Irnirayas in his appeal to social organization has suggested the Bangalore City Corporation to take up the grave issue on growing pollution problem. The city grows with enormous amounts of industrial and domestic waste piling up in every part.Tiwari2 in his system approach to city study has given few guidelines about the complex process of city structure. They lack co-ordination and objectivity, planning is adhoc, unplanned and unauthorized development takes place near the periphery. He has therefore recommended to have a systematic and scientific approach to the study and planning of cities. The city could be well done by dividing the city into city regional, inter-city dimension and intra-city. Ravindra3 has carried out a micro study in metropolitan city of urban land policy. The author has found a phenomenal increase in the land prices and changes in the land use pattern over the years. Land is one of the natural resource of a nation and serves as the basis for human settlement. He has said that patterns of the city growth and its spatial structure are determined by various forces. The use of land poses serious problems because the supply of surplus land is limited and subject to many competing claims. This shortage has given rise to problems to shelter, land use and raising land prices. He has therefore suggested to start an integrated urban land policy and also calls for an effective apex organization to take up this co-ordination and to implement policy measures.Suresh Kumar4 in his inaugural address of “ the best practice symposium and citation ceremony 2008” organized by the City Managers Association-Karnataka in Bangalore said that the rate urbanization in state is 34%against national average of 28%.In his forecast he has found that the Karnataka state would be witnessing nearly 50%. People mainly youth were shifting from rural areas to urban areas and this migration is an indication of urbanization and that the state should keep its pace of infrastructure development. According to UN5 and UN Population fund report,says Karnataka still lagging behind urbanization Bangalore might have earned the distinction of being India’s Silicon Valley but Karnataka has a long way to go as far as urbanization is concerned. Karnataka is behind Tamil Nadu, Maharashtra and even Gujarat. While 43.9% of the people in Tamil Nadu lived in urban areas the figure in Karnataka is only 34%. Maharasthra and Gujarat are 42.4% and 37.45 respectively. According to Jaipalreddy in is comment has said that in the process of urbanization ample careshould be taken in order to provide infrastructure for poor all those who migrate from rural to urban areas for various options. Representative NesimTumkayahas mentioned that for the first time in history that more than half of the world population 3.3billion people would be living in urban areas. The recent report by UN habitat6 on world’s cities finds addressing inequality and achieving sustainability as the two major challenges facing them. The Indian cities are showing an increasing trend in inequality and this is tested by the rising values of Gini coefficient, a tool used to evaluate inequalities. The report points out that cities are turning into contested terrains where spatial inequalities are pronounced. Lakshmi7 in her article, she has suggested that for a growing city like Bangalore attracts many people from other parts of the country should do urban mapping and people should be aware of making their life better, developing of satellite towns should help in decongesting. Bangalore, reforms in Municipal sector, include self assessment of property tax, double entry/accrual system for a greater transparency and cadre management. Fiscal decentralization to local bodies should be given in eleventh five year plan in this greater thrust should be given to tier I and tier II cities in the state of coverage of water supply, sanitation and solid waste management . Basavaraj S Horatti8 in his dialogue on ‘Go vertical is the mantra of Bangalore Development Authority has remarked that after a two-year await and 6,600 objections, the draft master plan with multiple changes made by the state government, has finally made it past the start line. Dealing with a growing city whose population is to cross 10 million by 2021,on par with several European nations, the master plan’s vision has gone skywards. It has result builders have been permitted more floor area ratio (FAR) which permits more built-up floor space on the same plot of land. Jaipal Reddy9 urban development Minister in his proposal a comparison of FSI of India with that of New York said that in most large cities globally, the FSI varies from 5 to 15 (in lower and mid-Manhattan, New York) in the city centre, to about 0.5 or below in the suburbs. And, as technology and infrastructure improve, the FAR (FSI) in the city centre tends to increase. But, Indian cities have extremely low maximum FAR in city centres; for instance, it is only 1.33 in Mumbai’s central business district. Bangalore’s current master plan(2015) allows a maximum FAR of about 2.50, reflecting draconian land use controls. However, usually with an increase in the FAR, the population or employment density tends to decrease. While this might seem counter-intuitive, this happens because an increase in FSI is associated with an increase in floor space per person and per job. So, more floor space is built on the same unit of land, but people and enterprises consume more of it, so population and/or employment density tends to decrease. Jawaharlal Nehru National Urban Renewal Mission (JNNURM)10specifies revision of by-laws for streamlining approval processes for construction of buildings, rainwater harvesting, and recycled water, all as optional reform agenda for cities, it is silent on FAR restrictions. Unless FAR/FSIisincreased to global standards, our cities will continue to be cruel to the urban poor, who have to take recourse to footpath dwellings for shelter; old buildings will never be renovated; and cities will continue to grow beyond their optimal size, unnecessarily extending commutes. Attempt should be made to bring about transparency in property transactions.There may be several causes and factors for the development of the Bangalore city. Factors like migration, rural–urban migration, inflation, government policy changes, development of technology, industrial development, international trade development and availability of employment opportunities. The city has used the principle of ‘Zoning’ one of the basic causes for any city to grow and this factor contributes in developing the city and encourages the development agency to provide all necessary requirements as demanded by the growing population. Bangalore is the second fastest growing with an annual population growth rate of 2.8%, is next to Delhi. The study projects that population in Bangalore to be 99.2lakh in 2020. Among Asia Pacific cities with 50lakh or more residents Bangalore stands eighth in terms of rate of population growth Bangalore which was the fifth largest city in the country during 1981 was predicted to overtake Madrasor Chennai and to occupy fifth place, but it has slipped to the sixth place during 1991
2. Phases of Development
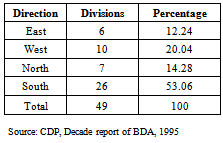
When we take into account the evolution of land in Bangalore city tracing back to the age old series of development ,the study has divided the phases of development under two different periods. One is from 1527 to 1941 and the other phase is from 1941 to 2001. During the study period in the first phase it was found that during the first phase of progress of the city was initiated and founded by chieftain Kempegowda. From 1527 to 1941 the city had progressed in the hands of Vijayanagar dynasty. But information is actually available that is only from 1799 that the city was recognized as major military centre. Between 1527 to 1798 the city was abundant with thick forest resources. Gradually, with the invasion of the city by the British the trading development has emerged. With non-identification of the city boundary limit, four gates were the main pillars to enter the surrounded city. The northern gate of the city was used asDodapette now known as Avenue road, a fort stretched in the South, the line of demarcation in the west was the Kengeri gate and the Halsur gate in the East. These were the limits and boundary that was designed and built in order to explore and as well to carry out trading activities by the western countries and Vijayanagar Kingdom.The study has also found during first phase control of the trading system were in the hands of Imperial Crown of the British Government. With available natural resources export of textiles was carried out, goods were traded to the Gulf. The production system was speedier based on the variety of textiles and demand. With this enlargement employment opportunities started to grow both directly and indirectly. Many merchants ,moneylenders and traders have benefitted and stared to grow. The increase in value of money and as well gold transactions has motivated the administration to transform the city into a flourishing Central Business trading centre. The dependency of the Indian citizens during Vijayanagar dynasty has motivated Bangalore. Industrialization to grow to a large extent and as well there was a major dependency of British Technology. Dyeing and printing, textiles export meant for the establishment of a manufacturing industry.It was also found that the influence of increase availability of job opportunities and with theoretical sovereignty of the Tipu and Mysore had little effect on control of administration. There was a change in Judicial administration and predomination of British. This has isolated the city and the city was bifurcated into Bangalore City and Cantonment. With the increase in the growth of the city to the extent of 11% that has motivated and pushed the employment level to 35% of the pete’s population in manufacturing, construction and as artisans.The study found during the I phase that in the year 1872 the jurisdiction has divided the state into several districts. Mainly Shimoga and Kolar were prominent because of natural resource available. District urban population of Bangalore grew at 5.58% in that Bangalore urban growth rate reached at 26.36%. since the urbanization in the city has always been faster rate than the average for the state as a whole.In the II phase of development of the study the study has found that the momentum of urbanization continued and the administration became more structured and the city grew with sustainable infrastructure and development. With industrial development, hydel power plant installation and well established administration had pressed the city to sustain the growth and development. The occupational structure changed substantially. With more than 40 villages been urbanized it was found that there was change in the magnitude of workers. In 1971 nearly 63.81% were accounted as agricultural workers. While in the year 1981 the percentage dropped to 48.6%. In the process of urbanization the study had found, that, not all were employed as agricultural labourers, children and women accounted for major dependency on agriculture. Women nearly 23.12% were employed while child below the age of 14 accounted 2.05% were engaged in agriculture. As the city started to designate itself as urban agglomeration centre categories of age group of above 19 years and up to 50 years started to move away from villages engaging themselves in the trade, manufacturing, processing, repair, commerce, construction, storage, transport and communication industries. Nearly 45.67% of below 19 years dependent on this service industry while others were 27.98% were in the age of 50 and less.Table 1. Distribution of Divisions as per Direction in Bangalore City
 |
| |
|
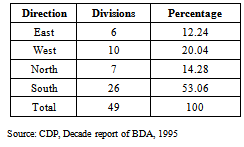
Table 2. Distribution of Divisions as per Direction in Bangalore City
 |
| |
|
According to times group, have identified the locationsbased on zone and have grouped the locations based on the directions, while Bangalore Development Authority has divided the different locations based on divisions. In order to understand clearly the direction of growth of the city, the study has followed times guidelines that was published in daily newspaper 28.05.06. Overall it can be noted that there are nearly 49 divisions planned by the BDA in its comprehensive Development plan to extend the rich growth of the city.The Development Authority motive is to bring about equitable distribution of land. In this process of encouraging the city development from various directions, The study has found that there is overall development of 49 divisions and this jurisdiction falls under the control of development authorityIn South direction there has been enormous up gradation nearly 53.06% of villages is inhabited and divisions has been developed. Secondly, on the west direction land has been suitable for industrial development and it has grown to the level of 20.04%.Coming to the East and North the process has been rather slow. The total area is 6 and 7 making marginal difference of 12 .24% and 14.28% respectively.Table 3. Distribution of Land area in Bangalore city : Direction wise
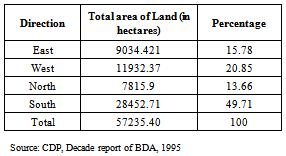 |
| |
|
Table 3 explains the distribution of land area in Bangalore city Direction wise the major junk is from the South direction, It can also be inferred that there has been increase hectacres of land that was brought into the process from scattered unidentifiable land to a civilized high level of development. This south direction that was previously only a agricultural location and primary shandy and manditrading place. Currently with more and more willingness on the part of the farmers to surrender in order to gain profit during current period with an estimation that south direction has developed in a faster manner. Obvious with increase role and determined attempt of the authority, have acquired land nearly 28452.71hectares to the total. Secondly on the west direction 11932.37hectacres of land has been gained nearly 20.85% and in the East and North there has been development with 9034 hectares and 7815 hectares of land that works out to be 15.78% and 13.66% to the total hectares of land . With larger availability of land there has been speedier development as well quantity of land were available for the Development authority to acquire in order to cater to the needs of the growing population for various economic activities.Table 4. Distribution of Population in Bangalore city Direction wise during 1991-2001
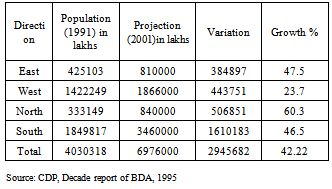 |
| |
|
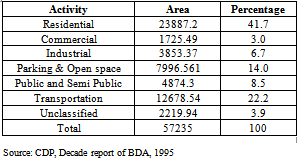
The main factor that has made the Bangalore Development Authority realize is the cities growing population. This being the fundamental force in driving the city to an overall development.However, the study has found in east direction there has been marginal rise in the population to the tune of 47.5% compared to a one percent rise from the south direction. But in the city there has been a bolstering growth in the North direction to a high level of 60.3% superseding all other three directions. There is faster growth due to high level of links and speedier development of infrastructural development. Like quality medical facilities with high tech equipments, airport development, good international schools coming up, existence of Agricultural University, easy access to availability of land and greenery environment available in this direction. So, in its new projected development the Bangalore Development Authority has found this North direction to be the best potential for further development and peripheral enlargement of the boundary is made possible by Bangalore city. In its projection it can inferred from the table that there has been increase in growth again in south direction it is because of its continuous and constant survey conducted and land available for development that has been identified by the Bangalore development authority.Table 5. Classification of land under various categories in Bangalore city (in hectares)
 |
| |
|
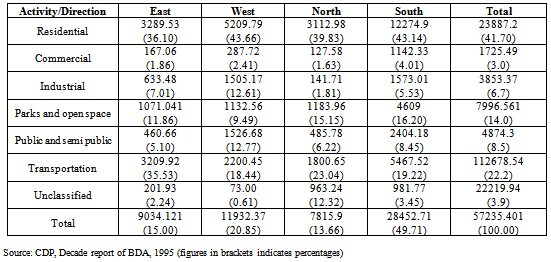
The zoning regulations for Bangalore Local Planning Area are prepared under Clause (iii) of Subsection ( 2) of Section 12 and 21 of the Karnataka Town & Country Planning Act.It can inferred from table 5 that the entire distribution of land in the city metropolis, out of the total of 57235 hectares of land., in this maximum land has been utilized for residential purpose. This fulfills the basic goal of the development authority. The authority has been successful in allotting land as well in building house for all segments of the growing population,like for middle,high and as well for the lower income groups. Apart from this the Bangalore Development Authority has been able to allocate for development of residences especially for societies groups, private layouts, of late with high raise buildings of land and houses for the growing demand of high tech groups in the city. Further the authority has been able to cater to the demands of the citizens in terms of infrastructure development and other basic amenities that is made available. These requirements are well met based on the budget allocation and implementation of various schemes and projects. These can be well understood in the budget analysis of the Bangalore Development Authority in the subsequent discussion on budget. So, out of the total land that has been covered or gained by the authority 23887.2 hectares of land has been exclusively used for residential purpose that accounts to 41.7% to the total percentage of land gained.The second activity of land use pattern is for commercial purpose. This is for the development of small trades. shops, commercial trading centres concentrated development of Central Business District from the living location to the business centre. Out of the total land use nearly 1725hectares of land has been used for the commercial purpose. This goes to say that small margin of 3.0% has been used to the total percentage of land.Development of land for industrial purpose the study found that the total land allocated is 3853.37 hectares. The percentage works out to be 6.7% to the total land used in the Bangalore city. Industrial development within the city has been categorized based on well defined schedules. The schedule is structured based on the investment and immediate requirement of the population. Like development of light industry like food processing, garment industry, hard core industries melting, welding maintenance and repair were allowed within the residential location. Where as heavy industries have shifted to outer periphery and located based on the less fertile soil suitable for industry and location of land that is used exclusively only for the industrial development like iron and steel, confectioneries, and heavy technological industry Table 6 reveals the land use pattern of Bangalore City: Division and activity wise upto the year 1995. Based on the total hectares of land that is used for various activities east, west, north and south directions have been varying with respect to utilization of land for various purposes. Firslyt, taking into account use of land for residential purpose increase hect acres of land is utilized in south to the level of 12274.9 ie., to the total allocated land of 28452.71 of hectares and the percentage level is 41.7%. Compared to West although percentage seems to close and competitive with that of south direction, land used is less to the level of 5209.79 hectares to the total allocated land of 11932.37 hectares of which 43.66%. While North and Eeast direction land used is to the level of 3289.53 and 3112.98 hectares, to the total land of 9034.121 and 78159 hectares respectively. The reason for the best location of residential selection by citizens is traditionally developed area of Bangalore has been high towards south because of good availability of land with reasonable values and as well for commuting to work place. In west with high industrial concentration preference for residential is more and as ample space is available with well built transport network. While in the east development has been progressive because of national high way and semi government industrial unit Taking into account commercial development directions wise once again in south direction occupies the top level of 1142.33 hectares followed by west, east and north directions. There are well developed business centers inJayanagar and in Banashankari. There are well developed commercial centers in the east based on traditional and religious concentration at shivajinagar. The extent of commercial development is 1.86% in the east, in west it is 2.41%, in North it is 1.86 %and in the south it is 4.01%.Table 6. Land Use Pattern in Bangalore City: Division wise and activity wise during 1995 ( in hectares)
 |
| |
|
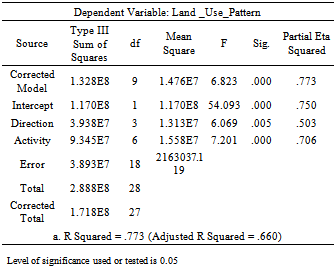
Pattern of land use and industrial development in the west many factories and industrial suburbs have been developed in these different direction. Factories like Minerva mill, Industrial estate, Ramco government factory , Deepak cable industries, breweries, Thomson saw mills FCI factory, BEL and general jobbing industries are concentrated. Also light industries and service industries are well developed. We can refer in the east direction as third city centre with the total area in terms of relieving congestion from concentrated central business district of Bangalore. The imperial tobacco company is existing and corporation slaughter house is at this direction.Also on the east direction we have the railway coach, Hindustan Aeronautical limited, Kamani metals and alloys, aero engines division, kissanproduct ,TTK product and Indian tin industries and ITI are along this direction. When we observe the land for industrial development in both east and as well as in west it is 7.01% and 12.61% respectively. The development of industry has been operating at a very low availability of land compared to south direction which of 1573 hectares of developed land. Hence we infer that there is a marginal congestion in industrial development in the west direction compared to south direction. However in east the industries have been much spacious and integrated to national highway development. In the North major portion of land is occupied by defence. Many new development have been designed. The traditional railway integral coach factory in yelahanka has been old and has developed city in the north direction. But the land that has been used is very less compared to other direction. It is only 141.71 hectares and 1.81% to the total land available for development in the north direction of Bangalore city. However in recent years development and investment is focused towards this direction.Moving on to the next activity parks and open space available is high in South direction. Open space available in the north direction because of location of natural environment and university of agricultural sciences and defence farm. And there is sufficient tank beds and lakes that is reserved for recreational purpose. A natural valley of well flow space connects the residential space. The available land is 1183.96 hectares and percentage to total is 15.15 which is second highest compared to other directions.Public and semi public organization of use of land. It is high in the west direction of 1526.68 hectares of land raising to the total of 12.77% where as south it is 28452.71 hectares and it is 8.45%. In this category land has been used to a increase level for the development of hospitals, educational institutions, University, administrative offices, Indian Institute of Science, approved industrial layouts, official buildings, library, legal court, religious centres and basic amenities provided by the government.Development of transport is widely concentrated in all directions. Minimum of 18.44% is covered from west direction to 19.22% in the North direction.. It can be inferred from the table that there is increase hectares of land is used in the South of 5467.52 and 3209 hectares in the East. There is a wide network in the East direction that connects to all central business district centers and main satellite towns.The extent of unclassified land in Bangalore city out of 22219.94 hectares of land that has been not under use. This is due to sealed land licensed and registered land are left unused. Also there has been private developers those who have acquired for further construction.ANOVA Test and its effect in measuring the growth of the city: Dependent variable is Bangalore City growth depends on the pattern of land use based on independent variables like different directions and growing population involved in various activity. Therefore, based on the identified variables two propositions is developed as follows: Null hypothesis H0 : Effect of ‘Direction’ is not significant Alternate Hypothesis: Effect of ‘Direction’ is significant Null Hypothesis H0: Effect of ‘Activity’ is not significantAlternate Hypothesis: Effect of ‘Activity’ is significantTable 7. Tests of Between-Subjects Effects
 |
| |
|
Partial ETA squared interpretation: From the table of “test of between subjects effects” the study confers that 50.3% of variability in land use pattern is accounted by direction.70.6% of variability in land use pattern is a accounted by activity.R squared interpretation:basically tell how strong the relationship is between variables. R square value tells, how good one term is at predicting another. A higher value of R square means that the study could predict one term from another. The R squared value of 0.773 is statistically significant. The higher value indicates that the relationship between the variables is strong F statistic value and inference: From the table it can inferred that for direction the F statistic value is 6.069 and this value is statistically significant at 5% level of significance since P value of .005 is less than 0.05.hence we reject the null hypothesis. i.e. we reject H0:direction is not significant in favour of alternative hypothesis H1: direction is significant.In a nut shell we reject the H0 and accept H1.From the table we can find that for activity the F statistic value is 7.201 and this value is statistically significant at 5% level of significance since P value if .000 less than 0.05. i.e.,we reject H0: activity is not significant in favour of alternative hypothesis H1: activity is significant. In nutshell we reject H0 and accept H1.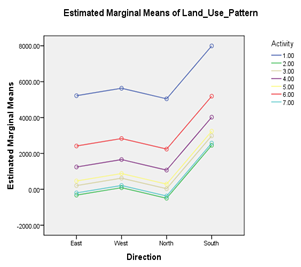 Graphical analysis Direction Vs estimated marginal mean graph depicts that direction across all activities are statistically significant but direction are even more statistically significant for activity (1) residence. The direction South amounts for maximum change in the means of level of activities..ActivityVs estimated marginal means graph indicates activities across all direction are statistically significant but activity are even more statistically significant for direction East. The activity residence amounts for maximum change in the means of level of direction
3. Conclusions
The study would like to conclude that pattern of land use in Bangalore city has been dynamic form various activities across different directions and Zoning principle has always been the ideal way of identification and better allocation of land. Ultimately, South direction continues to prosper continually with outer peripheral development. The Development authority has been doing justice in fostering different activities for the growth of the city.
ACKNOWLEDGEMENTS
The researcher would like to extend her gratitude to the Commissioner Bangalore Development Authority, Deputy Directors of Town and Country Planning for kind permission and guidance to help me take my assignment. I am indebted to my guide for her constant motivation and support.
Notes
1. Seshagiri Bangalore Development Civic Affairs 1971 pp.252. Tiwari System Approach to City Development IIM 1993 pp 153. Ravindra Micro study of metropolitan city of Urban land policy a case study of Bangalore Research study, Mysore University 1995 pp 10.4. Suresh Kumar Minister for Urban Development The Hindu October 25th 2008.5. Deccan Herald June 20076. The Hindu ,Chennai, November 20087. Smt Lakshmi Venkatachalam, “Delivering Urban Services” IAS, Principal Secretary to Government, Urban Development Department, Government of Karnataka,two-day seminar on 11th five year plan of karnataka: perspectives, 4th – 5th May 20078. Basavaraj Times of India Bangalore is set to grow vertical now June 16th 20079. Jaipal Reddy Valuation of property Urban Development Minister, Times of India 200610. Research fellow National Institute of Public finance and Policy Financial Express September 27 2006
References
| [1] | Comprehensive Development Plan,Bangalore Development Authority, 1989 and 1995 |
| [2] | Jaipal Reddy, “Valuation of property: Urban Development Minister, Times of India 2006 |
| [3] | Lakshmi Venkatachalam, “Delivering Urban Services” IAS, Principal Secretary to Government, Urban Development Department, Government of Karnataka,two-day seminar on 11th five year plan of Karnataka: perspectives, 4th – 5th May 2007 |
| [4] | Ravindra “Micro study of metropolitan city of Urban land policy a case study of Bangalore Research study”, Mysore University 1995 pp 10 |
| [5] | Research fellow National Institute of Public finance and Policy, Financial Express September, 27, 2006 |
| [6] | Seshagiri, “Bangalore Development Civic Affairs” 1971 pp.25 |
| [7] | Tiwari, “System Approach to City Development” IIM 1993 pp 15 |
| [8] | Suresh Kumar, Minister for Urban Development, The Hindu October 25th 2008 |
| [9] | Newspapers, Deccan Herald ,June 2007,The Hindu ,Chennai, November 2008 |

 Graphical analysis Direction Vs estimated marginal mean graph depicts that direction across all activities are statistically significant but direction are even more statistically significant for activity (1) residence. The direction South amounts for maximum change in the means of level of activities..ActivityVs estimated marginal means graph indicates activities across all direction are statistically significant but activity are even more statistically significant for direction East. The activity residence amounts for maximum change in the means of level of direction
 Abstract
 Reference
 Full-Text PDF
 Full-text HTML


