-
Paper Information
- Next Paper
- Previous Paper
- Paper Submission
-
Journal Information
- About This Journal
- Editorial Board
- Current Issue
- Archive
- Author Guidelines
- Contact Us
American Journal of Economics
p-ISSN: 2166-4951 e-ISSN: 2166-496X
2013; 3(2): 82-89
doi:10.5923/j.economics.20130302.04
External Tax Professionals’ Views on Compliance Behaviour of Corporation
Noor Sharoja Sapiei 1, Jeyapalan Kasipillai 2
1Faculty of Business and Accountancy, University of Malaya, Kuala Lumpur, 50603, Malaysia
2School of Business, Monash University Sunway Campus, Bandar Sunway, 46150, Malaysia
Correspondence to: Noor Sharoja Sapiei , Faculty of Business and Accountancy, University of Malaya, Kuala Lumpur, 50603, Malaysia.
| Email: |  |
Copyright © 2012 Scientific & Academic Publishing. All Rights Reserved.
Most corporation employed external tax professionals (ETP) to handle tax matters on their behalf. ETP with their superior knowledge and expertise may have the ability to influence their clients’ compliance behaviour. Regardless of the expanding role of ETP in tax reporting process, very little research has been directed at examining their perceptions. This study, therefore, investigates the compliance behaviour of corporate taxpayers from the views of ETP. Perceived tax complexity and tax psychological cost had the greatest impact in influencing the non-compliance behaviour of corporate taxpayers, in terms of under-reporting of income, over-claiming of expenses and overall non-compliance. It is believed that the findings of this study have made contribution to the relevant body of knowledge, as well as to the tax policy makers in devising measures to enhance voluntary compliance of corporation, particularly in the emerging economies. Future tax initiatives should incorporate research findings and suggestions made in this study and existing studies as well as experiences from other tax regimes both in the advanced and emerging economies.
Keywords: Tax Compliance Behaviour, External Tax Professionals, Corporate Taxpayers
Cite this paper: Noor Sharoja Sapiei , Jeyapalan Kasipillai , External Tax Professionals’ Views on Compliance Behaviour of Corporation, American Journal of Economics, Vol. 3 No. 2, 2013, pp. 82-89. doi: 10.5923/j.economics.20130302.04.
Article Outline
1. Introduction
- Generally, a large proportion of companies, especially the Public Listed Companies (PLCs) do not have an in-house tax compliance department but instead outsource all their tax activities[1],[2]. Thus, additional valuable information obtained through surveys of ETP provided corroborative evidence to the studies utilising corporate taxpayers’ survey (see for example[3]). There is an important trend in the literature of tax compliance study towards utilising a separate survey on ETP who handle tax affairs of corporate taxpayers (see[2],[4],[5]). This study investigates the taxpayer compliance behaviour of corporate taxpayers from the perspective of ETP.
2. Literature Review
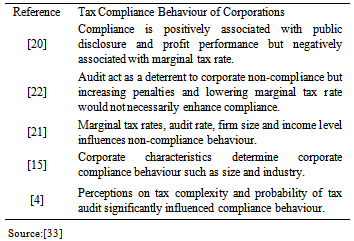
- Tax compliance is defined as the accurate reporting of income and claiming of expenses in accordance with the stipulated tax laws[6]. Thus, the failure of corporations to report or pay corporate income tax (CIT) is considered as corporate tax non-compliance[7]. There are two main approaches to tax compliance, namely the economic and behavioural approaches[8]. The economic approach is based on the concept of economic rationality while the behavioural approach applies concepts from disciplines such as psychology and sociology.The basic theoretical model applied in the economic approach is built upon the work of Becker in 1968 as in[9], who analysed criminal behaviour using an economic framework known as economics-of-crime model. It was first employed in the context of tax compliance study by Allingham and Sadmo in 1972. The model is based on an expected utility theory and a deterrence theory. The expected utility theory views taxpayers as perfectly amoral utility-maximisers, who choose to evade taxes whenever the expected gain exceeds the cost of evasion[10]. The deterrence theory is concerned with the effects of sanctions and sanction threats[11]. Within this framework, the tax rate, detection probability and penalty structure, determine the monetary costs of compliance, which determine taxpayers’ compliance behaviour[12]. This framework is termed as financial self-interest model and it has become a prominent approach in investigating taxpayer compliance behaviour (see[13],[14];[15]). Behavioural approach, by contrast, assumes that individuals are not simply independent, selfish utility maximises, but they interact according to differing attitudes, beliefs, norms and roles[16]. The behavioural perspective incorporates sociological and psychological factors, such as age, gender, ethnicity, education, culture, institutional influence, peer influence, ethics and tax morale, as factors that may affect compliance behaviour of taxpayers. Reference[12] expanded the financial self-interest model by incorporating the economic, sociological and psychological variables (Figure 1).
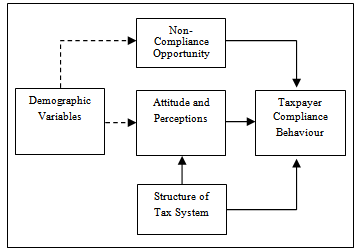 | Figure 1. Expanded Model of Taxpayer Compliance[12] |
|
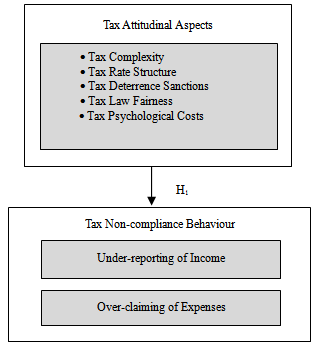 | Figure 2. Research Model of this Study |
3. Research Method
3.1. Research Sampling Design
- The ETP sample was drawn from the list of tax agents from the IRB’s website. As this study requires responses on tax fees incurred by PLCs, externals tax professionals who are attached to or have been attached to accounting firms with large companies as their tax clients, were deliberately selected.According to[28], a sample may be purposively selected based upon its ability to address the questions being asked in a study. Purposive sampling enables researchers to apply their own judgement to identify cases that will best enable them to meet their research objectives[29]. By utilising purposive sampling, a total of 200 ETP from the tax agents list of the IRB’s website were identified for this study.
3.3. Research Instruments
- Questionnaire items related to ETP’ services which were developed by these authors were adopted for this study (see[2],[4],[5]). The ETP’ questionnaire for this study consisted of two parts, referred to as Parts A and B. Part A of the questionnaire consisted of seven questions on the demographic information of ETP. Part B elicited information on perceptions towards a number of tax attitudinal aspects and compliance behaviour of corporate taxpayers, from the perspective of ETP.
3.2. Measurement of Variables
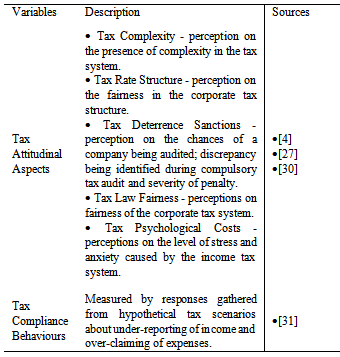
- The measurement of variables utilised in this study was based on the established sources (Table 2). Respondents were requested to indicate their agreement or disagreement with each statement using a six-point Likert scale.
|
3.4. Data Collection
- Data collection for this study comprised of two sequential steps; a pre-testing and final survey implementation. The ETP as the prospective respondents and academic researchers were chosen to ensure the understandability and applicability of the survey questions. The final drafts of the questionnaires were distributed to 20 ETP training during students’ industrial training visits and five academic staff from Malaysian public universities. Overall, positive responses were received especially regarding the understandability of questions, the format of questionnaire and the applicability of the terms used. Nevertheless, there were a few valuable suggestions for ease of response such as highlighting of key terms and rewording of questions. As the aim of conducting pre-test in this study was to examine the suitability and appropriateness of the survey instruments, no further detailed analysis was conducted. Final data collection for this study utilised a self-administered questionnaire survey method. This method of data collection was employed as a measure to obtain more reliable survey responses and a higher response rate[32], thus improving the validity of this study. Questionnaires can be personally distributed which provides the opportunity for researchers to emphasise verbally on the importance of the study and the appreciation for the individuals’ collaboration. When required, the researchers may cautiously provide some clarifications and/or examples with respect to certain difficult, sensitive or important questions.
4. Data Analysis
- Survey data were mainly analysed using the Predictive Analytics Software (PASW) for Windows (Release 19).
4.1. Response Rate and Sample Demographic
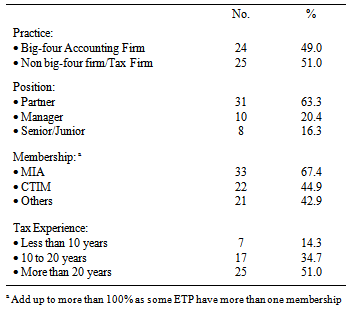
- The ETP sample was gathered from the list of tax agents available at the IRB’s website. Forty-nine (49) respondents out of 200 ETP approached, completed the self-administered survey, furnishing a response rate of 24.5 percent. All completed questionnaires were examined for accuracy of data and missing values prior to data entry. Follow-up calls and e-mails were made to address missing items and to clarify matters of possible incorrect responses. Table 3 provides the demographic profile of external tax professional involved in this study.
|
4.2. Descriptive Analysis of the Tax Clients
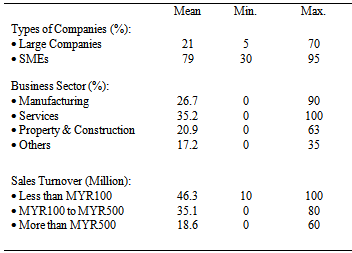
- In order to comprehend the background information of respondents’ corporate tax clients of this study, descriptive analyses was conducted (Table 4). On average 21 percent of ETP’s corporate tax clients were large companies and the remaining were SMEs (79 percent). The minimum percentage of large companies’ clientele was five percent and a maximum of 70 percent. Focusing on large companies, tax professionals were requested to provide information on their clients’ business sector and sales turnover. The highest mean percentage of large tax clients’ business sector was services (35.2 percent), followed by manufacturing (26.7 percent), property and construction (20.9 percent) and others (17.2 percent). Other business sectors included trading, plantation, agriculture, finance and banking. With regards to size of large corporate tax clients, the mean percentage was 46.3 percent for annual sales turnover level of less than MYR100 million, 35.1 percent for annual sales turnover of between MYR100 million and MYR500 million, followed by 18.6 percent for annual sales turnover of more than MYR500 million.There were almost an equal percentage of respondents practicing in the big-four accounting firms (49 percent) and non-big four accounting or tax firms (51 percent). A large majority of respondents’ position in these firms were partners (63.3 percent), followed by managers (20.4 percent) and senior/junior staff (16.3 percent). Nearly all of the respondents were members of at least one of the accounting or tax professional bodies, either locally or internationally. More than 67 percent of the ETP surveyed were members of the Malaysian Institute of Accountants (MIA), and almost 45 percent were registered with the Chartered Tax Institute of Malaysia (CTIM). Other professional bodies included the Association of Chartered Certified Accountants (ACCA), Institute of Chartered Accountants in England and Wales (ICAEW) and CPA Australia (42.9 percent). In terms of tax experience, 51 percent have more than 20 years of professional experience, 34.7 percent have experience of between five to 10 years and only 14.3 percent have less than 10 years of professional exposure. Thus, it can be concluded that the survey data was obtained from the ETP with appropriate position, knowledge and experience in handling tax matters of their respective corporate tax clients.
|
4.3. Taxpayers Attitudes and Behaviour
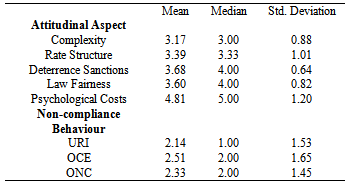
- ETP were requested to indicate their perceptions towards tax attitudinal aspects and behaviour of their corporate tax clients. Table 5 presents the mean scores of each tax attitudinal aspect gathered from the perspective of ETP. Tax psychological costs perceptions obtained the highest mean score of 4.81. This demonstrated that corporate taxpayers were facing anxiety and stress in dealing with tax requirements as perceived by the ETP. Tax deterrence sanctions perceptions’ mean scores of 3.68 indicated that ETP’ perception towards the audit likelihood, deterrence likelihood and penalty severity, was marginally high. This is followed by a mean score of 3.60 for tax fairness perceptions suggesting that the corporate tax system was regarded as being relatively fair. Finally, the mean scores of 3.39 and 3.17 for tax rate structure and tax complexity, respectively, showed that tax professionals’ perception toward these tax aspects were only marginally high and moving towards indifferent perceptions.
|
4.4. Correlation Analysis
- The relationship between tax compliance costs, attitudinal aspects and the likely non-compliance behaviour were further analysed by way of correlation analysis (Table 6).
|
4.5. Multiple Regression Analysis
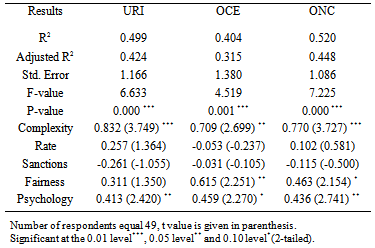
- All the three regression analyses undertaken for URI, OCE and ONC were statistically significant at the one percent level (Table 7).
|
|
5. Conclusions
5.1. Contributions of this Study
- The findings of this study may advance the existing knowledge in terms of research and practical contributions. First, this study contributes to the tax literature by providing evidence utilising ETP’ survey data. The empirical enquiries on ETP provide distinct advancement to the tax compliance behaviour area of research. Second, in terms of methodology employed, a major contribution of this study hinges on the approaches in the data collection process. As opposed to most studies in this area, which commonly engage postal surveys for data collection, this study used self-administered questionnaires. Third, with respect to the research findings, this study makes several contributions to the body of knowledge especially when one takes into consideration the very limited tax studies in the emerging economies. Practically, the findings arising from this study provide valuable information on external CIT compliance behaviour, which are very beneficial for policy makers in the area of taxation, as well as to the taxation profession and the management of companies. This study contributes to the aim of providing information in order that policy decisions may be based on reliable data through robust research findings. Accordingly, the issue on compliance behaviour of corporate taxpayers will be fully acknowledged and eventually be considered as essential features for future tax policy decision-making.
5.2. Research Limitations
- As a piece of research, this study is not without its limitations and many of them represent opportunities for future research. First, with regards to sample size, this study obtained a usable response rate of 24.5 percent (49 responses) via ETP’ surveys. Comparatively, prior studies in the area of tax compliance behaviour also appear to have reported low response rates. Nevertheless, in order for the findings of this study to be more representative, a larger sample size would have been desirable. Second, corporation tax attitudes and their compliance behaviour in this study were measured from the ETP perspectives; which might not necessarily represent the attitudes and behaviour of the PLCs being studied. Nevertheless, corporate tax computations and returns are mostly conducted and lodged by ETP on behalf of their corporate tax clients. As such, it should be acknowledged that the findings from a survey of ETP provided corroborative evidence for the corporate taxpayers’ survey findings.
5.3. Future Research Directions
- Given the findings, contributions and limitations of this study, there are several avenues for future research directions. This study on tax compliance behaviour is based on self-administered questionnaire survey responses of ETP.Future research should consider conducting in-depth interviews and/or experiments as research utilising these approaches can be a good complement to large-scale surveys as they are useful in providing a deeper understanding and explanation on the relationship between variables.Likewise, future studies may consider the use of experimental method where non-compliance behaviour of taxpayers is measured through a controlled experiment[34].Researchers may also consider employing IRB tax audit research data similar to studies of US corporations (see[20],[21]). These studies measured “actual” non-compliance by employing the IRS reported data, especially the TCMP. The use of government data, however, requires full cooperation from the IRB as the information is not publicly available due to data confidentiality.
 Abstract
 Reference
 Full-Text PDF
 Full-text HTML