-
Paper Information
- Next Paper
- Previous Paper
- Paper Submission
-
Journal Information
- About This Journal
- Editorial Board
- Current Issue
- Archive
- Author Guidelines
- Contact Us
American Journal of Economics
p-ISSN: 2166-4951 e-ISSN: 2166-496X
2013; 3(2): 68-74
doi:10.5923/j.economics.20130302.02
IPO Volume, Initial Return, and Market Condition in the Malaysian Stock Market
Rasidah Mohd Rashid 1, Ruzita Abdul Rahim 2, Hanandewa Hadori 3, Farid Habibi Tanha 4
1College of Business, Northern University of Malaysia, Kedah, 06010, Malaysia
2Faculty of Economics and Management, National University of Malaysia, Selangor, 43600, Malaysia
3Department of Management, STIE Bisnis Indonesia, Jakarta, 11560, Indonesia
4Department of Financial Sciences , University of Economic Sciences, Tehran, 1593656311, Iran
Correspondence to: Rasidah Mohd Rashid , College of Business, Northern University of Malaysia, Kedah, 06010, Malaysia.
| Email: |  |
Copyright © 2012 Scientific & Academic Publishing. All Rights Reserved.
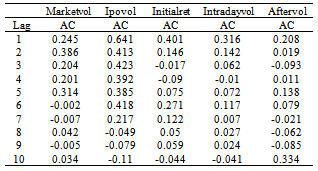
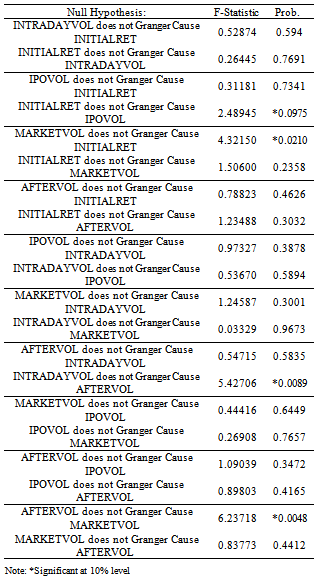
This paper examines the variability in initial returns, IPO volumes, and market conditions of the IPO listed in Bursa Malaysia during the period from January 2000 to December 2010. The IPO volume is highly auto correlated at low lags and decreases during the high lags. Examining the interrelation between IPOs volume, initial return, and market condition shows that market volatility causes the initial return, the initial return causes IPO volume, intraday volatility causes aftermarket volatility, and aftermarket volatility causes market volatility. These suggest that, over the sample period, issuers depend on the information in the initial return while taking the decision to go public. The results also document that the past quarter’s initial return and market condition highly influence the number of IPO issued the following month. The evidence over the periods of study shows that the initial return and market condition are related to the variability of IPO volume. Therefore the information on the initial return and market condition is important to both issuers and investors in making the decisions.
Keywords: Initial Return, IPO Volume, Market Condition
Cite this paper: Rasidah Mohd Rashid , Ruzita Abdul Rahim , Hanandewa Hadori , Farid Habibi Tanha , IPO Volume, Initial Return, and Market Condition in the Malaysian Stock Market, American Journal of Economics, Vol. 3 No. 2, 2013, pp. 68-74. doi: 10.5923/j.economics.20130302.02.
Article Outline
1. Introduction
- It has been empirically documented that a cycle of the IPO market in terms of volume issuance often can represent hot and cold markets. The most well-known identification is that the hot market has a high number of new listed companies and that there is low new issuance in the cold market. Another definition for hot and cold markets that has received a large number of academic attention is based on the initial return and market-adjusted initial return. The recent research by Low and Yong, using 368 IPOs listed in Bursa Malaysia from year 2000 to 2007, identifies the hot market with the number of new issues and high initial return[1]. Recently, Chong and Puah examine the pricing behavior of the initial return as well as an economic indicator and IPO volume from 1993 to 2006. They find initial return and economic indicator have a positive relationship with volume of IPOs that are listed on the Main Board of Bursa Malaysia. Based on this finding, they concludes that “windows of opportunity” exist either in under pricing or positive economic environment[2]. Most prior theoretical and empirical studies on the behavior of IPOs are carried out by looking at the initial return, IPO volume and market return[3][2]. There are still few studies that look into the relationship between IPO initial return, IPO volume and market volatility.There are some studies that analyze how initial return is related to IPO volume[3][4][5]. Lowry and Schwert find that positive information will result in high initial returns and soon following that, there will be more new IPOs filings[3]. Ritter (1998) explains the volume of IPOs tends to be high following the periods of high stock market return[4]. In contrast, Lowry finds there is no relationship between the IPO returns and IPO volume. However, the results of the study also show a negative relationship between IPO volume and post issue market returns[6]. Schill finds that when the market is experiencing an increase in volatility, the number of new issues tends to reduce[7]. The finding also shows that the monthly IPO volume drops by 13% when the market volatility increases above the normal market volatility. However, market volatility does not affect the IPO under pricing particularly among small firms[7]. In this study, the finding shows that market volatility has little effect on IPOs initial return and this is inconsistent with the legal liability and reputational hypothesis[8]. Studies on the causal relationship between the market volatility and IPO volume and initial returns in Malaysia IPOs are still scarse[9]. Therefore, the impact of market condition (volatility) on IPO volume needs to be examined as the pattern is puzzling.The motivation of this paper is to fill the gap in literature by looking at the predictability of quarterly IPO initial return, IPO volume, and market condition (proxied using market volatility), intraday volatility, and aftermarket volatility to test the autocorrelation in a different phase. Secondly, this paper will examine the Granger causality relationship among quarterly IPO volume, initial return, and market condition. Thirdly, this study proposes a new definition for the hot and the cold markets which are classified on the basis of the market volatility. The “hot market” refers to the period with a high market volatility, whereas the “cold market” refers to a condition with a low market volatility. To be robust, this study will also classify the hot and cold period using the aftermarket volatility. The hot and cold classification will be represented using a dummy variable. We use both classifications as we want to examine which betterexplains the IPO volume.The remainder of the paper is organized as follows. Section 2 contains a literature review. Section 3 discusses the data and methodology that are use for this study. Section 4 presents the empirical results and findings. Finally, section 5 summarizes the findings and concludes the study.
2. Literature Review
- There are a few theoretical explanations and factors that influence the relationship between the return, IPO volume, and market condition. Prior empirical results show that there is a relationship between IPOs initial return and IPO volume. However, this study is still puzzled by the relationship between IPOs volume, initial return, and market condition especially in the context of Malaysian capital market.
2.1. Initial Return
- Lowry and Schwert note that there are few factors that can influence average initial return[3], one of which is market condition. When investors are optimistic about the market, it will result in high initial returns. Particularly, when return on the market is high, it tends to increase the IPO initial return. Thus, there is also a possibility that, if the market volatility is high or low, such condition will affect the underpricing as well. Lowry and Schwert’s findings show that firms tend to go public whenever the average initial return is high and that there is a serial correlation in aggregate initial return. Thus, these results are consistent with the asymmetric information hypothesis and prospect theory whereby the information is incorporated into the offer price. In contrast, Ritter and Welch argue that asymmetric information is not the primary driver of IPOs activities (the number of firms that are going public)[10]. They believe the non-rational investors and agency conflict play a role in IPO activity.Abdullah and Mohd state that IPO underpricing in Malaysian listed companies are among the highest in the Southeast Asian region[11]. They examine the factors that might influence the underpricing in new issues and find that Malaysian companies are highly underpriced because of the superior prospects. They further mention that if the market (it was then known as KLSE) is efficient, it might increase the company’s value, and it appears to have a significant impact on IPOs initial return. On the contrary, if the market is not efficient and more volatile , there is a chance that it might also explain the initial return or underpricing. Accordingly, this study predicts the existence of the relationship between the market volatility with IPO volume and initial return.A recent study by Lowry et al. look at the volatility of IPO initial return, and they find that IPO activity fluctuates over time and that initial return is high during the hot market, especially for firms that are more difficult to value because of the information asymmetry[12]. The mean and volatility of initial returns seems to have a positive correlation. Moreover, Lowry et al. find the aftermarket price is believed to be a true reflection of the market value which is based on the closing price on the 21 days of trading. This study also finds that both IPO initial return and standard deviations tend to be positively correlated. In this paper, the initial return is calculated based on the first day closing price. Furthermore, this paper will look at the aftermarket volatility by using the 21-day after listing closing price to examine the volatility of the IPO firm.
2.2. IPO Volume
- Lowry and Schwert and Ritter find that IPO volume and average initial returns is highly auto correlated[3][13]. They find that positive information results in the lead lag relation such that higher initial returns result in more new issues. However, there is a question about whether the information from the market can influence the lead lag relation between market volatility and initial return as well the IPOs volume. Therefore, this study will examine whether information that is represented by market volatility tends to lead to more new companies issue. According to Lowry and Schwert, the positive information can be measured by the positive initial return[3]. Their findings also show that current initial return and past IPO volume are negatively correlated, while current initial return and future IPO volatility are positively correlated.In contrast with other prior literature, Walker and Lin find that IPO volume causes higher initial returns but not vice versa[14]. They use two stages and three stages least square to estimate the dynamic relationship between IPO volume and initial return. Their findings indicate undepricing not only affected by the number of issues at concurrent time but also in prior periods.
2.3. Market Condition
- Ritter finds that risk compositions in initial public offerings do not have a relationship with the average initial return, especially during a hot market[13]. However there is a positive relation between risk and initial return. Furthermore, Ritter argues that the greater the uncertainty about the issue of IPOs, the greater the compensations required by the investor. In other words, based on Rock’s model used by Ritter, high risk firms will have higher initial return than low risk firms. This reasoning leads to a positive relation between initial return, risk, and number of IPO issues. In his study, Ritter associates risk with sales performance; higher risk leads to low sales[13]. He also uses standard deviation of returns in the aftermarket using the first 20-day return after listing as a proxy of risk. The study finds that high average initial return is strong positive relation with high risk. However, it also finds that the relationship tends to disappear when it is tested in different periods of time. Therefore, the finding is seemingly not stable and most probably may differ in a different market. Therefore, this paper will carry on looking at the relationship between IPO volumes with average initial return, aftermarket volatility, and market volatility in the Malaysian market.Ritter states that, during a hot market, the risk will increase, and there is a positive equilibrium between risk and expected return[13]. He further mentions that there is a positive relation between initial return and market risk. Therefore, there are possibilities that market risk is one of the factors that determines the IPO volume and initial return. Thus, this study would like to fill the gap since only a few have studied this relationship.We also employ the method as Barry and Jennings who use the intraday return to measure the intraday volatility[15]. This method is introduced by Parkinson who uses the natural log of the first-day high price divided by the first-day low price for the proxy of the intraday volatility[16]. Thus, this study will use the proxy for the measurement of risk utilizing market volatility, which is the average market standard deviation on a quarterly basis. Meanwhile, the aftermarket volatility will be estimated using Lowry et al. method which refers to the aftermarket standard deviation of returns over 21 days after listing[12]. Finally, we adopt Parkinson’s intraday volatility measurement. Thus, the objective of this paper is to study the behavior of IPO volume, initial return, and market condition which is proxied by the IPO aftermarket volatility, intraday volatility, and market volatility. In short, the paper addresses the following questions:1. Do past behavior influence the IPO average initial return, IPO volume, IPO aftermarket volatility, intraday volatility, and market volatility?2. Do the initial return, aftermarket volatility, intraday volatility, IPO volume, and market volatility have correlation during hot and cold periods?3. Do the initial return, aftermarket volatility, intraday volatility, IPO volume, and market volatility show a causal relation?4. Do the market volatility, average initial return, aftermarket volatility, and intraday volatility convey any information to IPO volume?
3. Data and Methodology
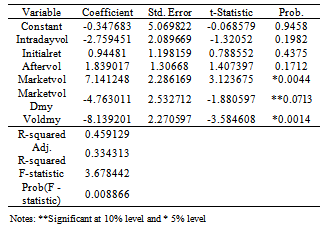
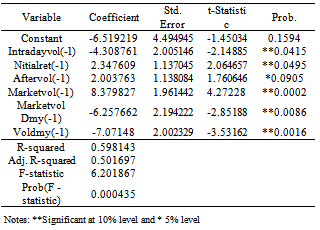
- To examine the behavior of the IPO volume, initial return, aftermarket volatility, intraday volatility, and market volatility, this study uses a sample of 443 IPOs that are listed from January 2000 up to December 2010. The study period starts in 2000 as this year represents the recovery period after the Asian economies are struck by the 1997/98 financial crisis. This study excludes incomplete data in the final selection of the IPOs. The data are in the quarterly frequency and contain the average initial return, the aftermarket volatility, the IPO volume, the intraday volatility, and the market volatility. The data is compiled from Bursa Malaysia website (http://www.bursamalaysia.com), the Star Online website (http://bizthestar.com.my/marketwatch/ipo) and the DataStream. We employ the autocorrelation test between each series to look at the pattern of the past and the future interrelationships. Then, we test the correlation to look at how strong the relationship between the variables. Granger causality is used to determine at the causal relationship between variables. Finally, we run a regression analysis to examine the variations in the exogenous variables that will influence the variation in IPO volume.The OLS regression analysis between IPO volume and six determining variable is performed using the following linear regression:
 | (1) |
4. Findings
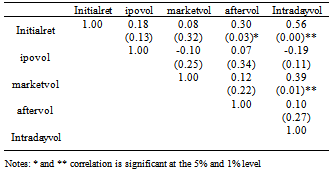
- The sample is based on quarterly average values for the 10 year period. There are two quarters (2000:Q3 and 2009:Q1) that are excluded in this study because there is no IPO issued during these periods. Table 1 shows the summary of descriptive statistics of the variables. The average initial return is about 22%, ranging from a minimum quarterly average of -34.52% to a maximum of 136%.The average number of IPOs that have been issued on a quarterly basis for the 10 year period is 10 issues, with a maximum of 24 and a minimum of 1. With respect to the volatility measurement, this study uses the Parkinson extreme value, in which the mean intraday volatility is 1.35, the market volatility using KLSE (based on monthly closing price) shows about 4%, and finally, the aftermarket volatility using the volatility measurement 21-day closing price after listing is 60%. Aftermarket liquidity seems to have higher volatility than the market (KLSE). These results imply that the listed IPOs are not only risky in long run but also risky a few weeks after the listing .
|
|
|
|
|
5. Conclusions
- The movement of IPO volume can be predicted based on initial return and market condition. Based on the Granger causality test, initial returns convey information about the future IPO volume. Therefore, the initial return reveals a signal of the IPO volume. Additionally, the decision to go public over the entire period of study shows that the variability of IPO volume depends on the past pattern of the initial return and market condition. Market condition here is proxied by intraday volatility, aftermarket volatility, and market volatility. This finding suggests that issuers can rely on the past market condition in making the decision to go public. The empirical results support Ibboston and McKenzie who find that IPO activities, underpricing, and stock market indicators do have explanatory power over IPO volume[18][19].The empirical analysis provides evidence that positive and significant correlations between the initial return with intraday volatility and the aftermarket volatility arises because stock prices are affecting them after the listing improves the forecasts of initial return. Our study has several implications. First, our findings further confirm Ritter and Welch’s findings that the market condition does influence firms’ decision to go public[10]. Secondly, we further find that IPOs are not only risky in the long run but also as soon as the first few weeks after the listing. Finally, market volatility is highly significant and the most important factor that companies should rely to make a decision to go public. In summary, the results suggest that all of the proxies for market conditions are positive related to the variability of IPO volume.
ACKNOWLEDGEMENTS
- The authors are grateful to Professors Dr. Othman Yong for his helpful comments and suggestions.
References
| [1] | Low, S.-W. & Yong, O, “Explaining over-subscription I fixed-price IPOs: Evidence from the Malaysian stock market”, Emerging Markets Review vol.12, no. 3, pp.205-216, 2011. |
| [2] | Chong, F. & Puah, C. H, “The time series behaviour of volume, initial return and economic condition of the Malaysian IPO market”, International Review of Business Research Papers vol.5, no.4, pp.409-417, 2009. |
| [3] | Lowry, M. & Schwert, G. W, “IPO Market Cycles: Bu bles or Sequential Learning?”, The Journal of Finance, vol.57, no.3, 2002. |
| [4] | Bayless, M. & Chaplinsky, S, “Is There a Window of Opportunity for Seasoned Equity Issuance?” The Journal of Finance, vol.51, no.1, pp.253-278, 1996. |
| [5] | Ritter, J. R, “Initial Public Offerings”, Contemporary Finance Digest, vol.2, no.1, 1998. |
| [6] | Lowry, M. “Why does IPO volume fluctuate so much?”, Journal of Financial Economics, vol.67, pp.3–40, 2003. |
| [7] | Schill, M. J. “Sailing in rough water: Market volatility and corporate finance”, Journal of Corporate Finance, vol.10, pp. 659– 681, 2004. |
| [8] | Ibbotson, R.G, “Price performance of common stock new issues”, Journal of Financial Economics, vol.2, pp.235– 272, 1975. |
| [9] | Yong, O, “A review of IPO research in Asia: What's next?”, Pacific-Basin Finance Journal , vol.15, no.3, pp.253-275, 2007. |
| [10] | Ritter, J. R. & Welch, I, “A review of IPO activity, pricing and allocations”, The Journal Of Finance, vol.57, no.4, 2002. |
| [11] | Abdullah, N.-A. H. & Mohd, K. N. T, “Factors inflencing the underpricing of initial public offerings in an emerging market: Malaysian evidence”, IIUM Journal of Economics and Management, vol.12, no.2, 2004. |
| [12] | Lowry, M., Officer, M. S. & Schwert, G. W “The variability of IPO initial returns” The Journal Of Finance, vol.65, no.2, 2010. |
| [13] | Ritter, J. R, “The Hot Issue Market of 1980”, The Journal of Business , vol.57, no.2, pp.215-240, 1984. |
| [14] | Walker T. J. & Lin M.Y, “Dynamic relationships and technological innovation in hot and cold issue markets”, International Journal of Managerial Financial, vol.3, no.3, 2007. |
| [15] | Barry, C. & R. Jennings, “The opening price performance of initial public offerings of common stock”, Financial Manangement, vol.22, pp.54-63, 1993. |
| [16] | Parkinson, M, “The extreme value method for estimating the variance for the rate of return”, Journal of Business, vol.53, pp.61-66, 1980. |
| [17] | Ghosh, S, “Boom and Slump Periods in the Indian IPO Market”, Reserve Bank of India Occasional Papers, vol.25, no.1, 2004. |
| [18] | Ibbotson, R.G., Sindelar, J. & Ritter, J.R, “The market’s problems with the pricing of initial public offerings”, Journal of applied Corporate Finance, vol.7, pp.66-74, 1994. |
| [19] | McKenzie, M.D, “International evidence on the determinants of the decision to list”, Australian Journal of Management , vol.32, no.1, pp.1-28, 2007. |
 Abstract
 Reference
 Full-Text PDF
 Full-text HTML