-
Paper Information
- Next Paper
- Previous Paper
- Paper Submission
-
Journal Information
- About This Journal
- Editorial Board
- Current Issue
- Archive
- Author Guidelines
- Contact Us
American Journal of Economics
p-ISSN: 2166-4951 e-ISSN: 2166-496X
2012; 2(7): 185-194
doi: 10.5923/j.economics.20120207.04
Optimal Growth with Corruption and under Development in Poorest Developing Countries
 Abstract
 Reference
 Full-Text PDF
 Full-Text HTML
Diana Loubaki
IRES, Université Catholique de Louvain, 1348, Louvain-la-Neuve, Belgium
Correspondence to: Diana Loubaki , IRES, Université Catholique de Louvain, 1348, Louvain-la-Neuve, Belgium.
| Email: |  |
Copyright © 2012 Scientific & Academic Publishing. All Rights Reserved.
This article investigates growth in an economic environment where prevail corruption and under development defined as the interaction between poverty on the one hand and the relationship between production and pollution on the other hand,. The purpose is to determinate requires conditions able to allow the economy converges to its sustainable optimal growth path. Whereas multiple equilibria due to corruption keeps the economy under developed and prevent it from the reach of the long run optimal sustainable growth path in which poverty is absent and average income levels at least equal to the threshold of the living standard, human capital accumulation through learning by doing financed by the social planner with pollution income taxes introduces social insurance acquisition possibility and sustainability improvements. The model highlights suitable mechanics of growth sustainability and establishes that corruption partly prevents international Organizations’ actions to reach their targets.
Keywords: Poverty, Sustainability, Institution Imperfections, Multiple Equilibria, Strenghned Compound Inverted U-Shape, Corruption
Cite this paper: Diana Loubaki , "Optimal Growth with Corruption and under Development in Poorest Developing Countries", American Journal of Economics, Vol. 2 No. 7, 2012, pp. 185-194. doi: 10.5923/j.economics.20120207.04.
Article Outline
1. Introduction
- The aim of this article is to provide theoretical foundations of economic growth in the context of under development and corruption prevalence in Sub-Saharan Africa. As human capital accumulation plays a great role in poverty eradication through productivity increase, social insurance acquisition through income increase does the same thing in sustainability improvements target confirmed by the inverted U-shape curve existence which indicates development sustainability achievement. The model also establishes that subsidies to low efficient firms may help poor economies get out of under development faster if corruption is absent. Studies on corruption mostly show a decrease on economic capability to get out of under development or to converge to the long run growth[1]. Institution imperfection is evaluated to up to 55% in Latin America against 45-85% in Easter Asia and 80% in Africa[2]-[3] . Mbaku emphasizes the important role that institutions have in corruption control and he recommends reconstructive democratic constitutions as a development tool[4]. In regard to the definition, corruption is a behaviour which deviates from formal duties of public role because of private regarding (personal, close family, private clique) pecuniary status gains; or violates rules against the exercise of certain types of private regarding influence[5]. The World Bank takes minimal working definition which is the abuse of public office for private gains. Corruption is motivated by poverty, productive capacities low technology and sustainability matters in developing countries while low labour productivity is mostly the resulting effect of the brain drain in Africa. According to National Commission of United Nations for Africa, 52% of people live actually with less than 1$ per day1., extreme poverty represents 43% of urban population against 59% of rural population, poverty concerned 217 millions of people in 1987, 291 millions of people in 1998 and 310 millions of people in 1999 in level terms. World Health Organization reports that non cleaned water and air as well as pollution cause almost 300,000 deaths per-day in developing countries. Therefore, under development or the link between poverty on the one hand and the interaction between production and pollution on the other hand, characterize African economies and deserves a deeper study in order to establish conditions for growth and development economics.The article uses the literatures of corruption and pollution connected to growth. On the one hand, the literature of corruption can be summarized in three approaches. The first research line addresses why policymakers, business leaders, and private citizens should concern themselves with the existence and elimination of corruption[6]. This research program focuses on the effect of policies and reforms on growth and macroeconomic stability and concludes that differences across countries in the quality of their institutions explain growth heterogeneity. The second research line addresses how and when political, social, and economic forces contribute in counter corruption drives, cost-benefit analysis on the part of a country’s leaders in order to determinate existence or lack of an official policy[7]. The third approach focuses on what types of policies effectively counter corruption and highlight effective anticorruption instruments. In a formal way, economic models the corrupt employee as a rational actor who decides whether to engage in corrupt activity by balancing the potential benefits against potential costs and consequences. Therefore, policies that worsen the consequences of engaging in corruption by increasing severity of punishment and likelihood of detection will lower corrupt activity. Bardhan argues that the frequency of corruption in a society changes the balance of its marginal costs and benefits for an official l[8]. Klitgaard conceptualizes the opportunity for corruption in a formula: C (corruption) = M (monopoly) + D (discretion) - A (accountability)[9]. The opportunity for corruption is a function of the size of the rents under a public official’s control (M), the discretion that official has in allocating those rents (D), and the accountability that official faces for his or her decisions (A). Other lines of research suggest a mixture of causal factors drawn from both political science and economic approaches. Ongoing empirical research of Kaufmann suggests that the determinants of corruption are complex because poor institutions, civil liberties, governance and economic policies, as well as other characteristics play an enabling role for corruption[10]. Along these interdisciplinary lines, the World Bank points to both institutional and economic policy factors which create a nourishing environment for corruption. On the other hand, growth literature in connection to environment components begins seriously in the mid of the 1990s on the basis of the Meadows claim. The tool used is the Kuznets curve highlights by the U-shape inverted curve in theoretical models in order to specify that growth or development is sustainable. There are three approaches of growth connected to environment. The first approach studies the relationship between growth and pollution[11]-[16], the second approach links growth to natural resources[17] and the third approach links growth to climate change.[18]-[19] This article is connected to pollution in order to study Sub-Saharan Africa growth sustainability because natural resources and climate change don’t affect human sustainability more than pollution does.This study models the economic environment closely to the literature of corruption in order to establish growth and sustainability foundations in poor countries. The economic agents of this macroeconomic analysis are consumers, firms and a social planner. The social planner corrects market failures. Both firms and consumers are divided in two parts. Some firms are efficient, some other are not. Equivalently some agents are poor and some others are not. The social planner’s intervention is legitimated by the fact that pollution hurts the poor agent's utility function whom he finances human capital accumulation with the revenues from taxes on emissions, G he got from non efficient firms which he transfers to most efficient firms in order to organize knowledge acquisition through learning by doing, while production is taking place in order to allow the poorest agents get a social insurance through income increase. The least efficient firm N1 has a probability p to face an honest budget collector staff and a probability q=1-p to face a corrupt budget collector staff who accept to negotiate about changes on the tax rate set by the social planner. Since q≠0 there exist multiple equilibria which highlight institution’s failure in the developing country and explain at the same time why the economy remains kept in a poverty trap as well as weak foreign aids impact on the economy. If q=0, the economy converges to its unique optimal sustainable development path on which, the wage rate income w(t) equals at least the threshold standard of living,
 i.e
i.e  . Then the agent can be covered by a social insurance i.e v(t)≠0. The results obtained are first, institution imperfections create growth instability and increase the difficulties to predict its evolution over time. Second, subsidies received from international donors may lift the economy from poverty trap if corruption is not introduced. Subsidies to firms are more efficient for growth sustainability and development than fiscal policy based on revenues from emission taxes proposed by the model. International aids may achieve their target without corruption prevalence. Third, corruption is unable to boost the economy to its long run sustainable path, tools control for perfect institution may must be established in order to lift the economy to optimal growth.The article presentation is organized like follow, section2 sets the model, section3 gives the market equilibrium conditions and sections 4 discusses the optimal growth sustainability program for development and poverty eradication. Finally section5 concludes on the model.
2. The Model
- Consider a developing country where exist a constant labour force at each period, L(t)=L and N firms divided in two parts to produce the same homogenous consumption good using technology differentials indexed by, z(t)ϵ]0,1]. If z<1, the technology used is cleaned and generates high (efficient) and ecological per-capita production. Otherwise if z=1, the technology used produces consumption goods in the dirtiest way.
2.1. Production Sector
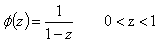
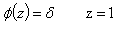
- Lemma 1: Let z be an index of technology inside the range ]0,1]. Then, technology ∅(z) chosen by the two kinds of firms differs in their technological sophistication i.e the respective non rival technology chosen by the High-Tech sector of production and the Low-Tech sector of production are
 | (1) |
 | (2) |
 | (3) |
 | (4) |
 | (5) |
 | (6) |
 | (7) |
 | (8) |
 | (9) |
 | (10) |
 If
If  , we join Solow neoclassical result with respect to absolute convergence where marginal benefit of per-capita capital stock, k₁ is higher than that of per-capita capital stock k₂,. Thus, with technological improvements, the firms N₁ grow faster than the firms N₂ . In the long-run, there is absolute convergence of the firms[21].If
  , we join the AK result with respect to conditional convergence . The marginal benefit of per-capita capital stock, k₁ is lower than the marginal benefit of per-capita capital stock k₂. Thus, the firms N₁ are more sensitive to collapse or the ending of activities than the firms N2 , the firms N₁ can't grow faster than the firms N₂ . In the long-run, the firms are not the same because the marginal benefit of capital is no more decreasing like in the previous case.
2.2. The Capital Stocks Dynamics
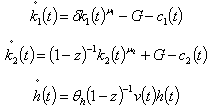
- In conformity with national income accounting conventions, it is useful to define an accounting measure of per-capita stock of capital as cumulative forgone output. Thus k₁(t) , k₂(t) and h(t) involve according to the following rule i.e
 | (11) |
 | (12) |
 | (13) |
 is a positive per unit of emissions tax rate, e₁(t)=E(t)/L₁(t) is a per-capita standard emissions of the firms N₁ , θh>0 is the productivity of human capital.
 2.3. Preferences
2.3.1. The Poor Agent
- The intertemporal utility function of the poor agent is expressed over consumption, c₁ and pollution, x₁. Pollution hurts the poor agent as expresses his utility function, (14). The social planner sets a bound on the dirtiest technology that may be used in respect to pollution generated. Therefore, the utility function of the poor agent is expressed by (14)2 i.e
 | (14) |
 therefore, the intertemporal utility function depends on per-capita consumption only, expressed by (15) i.e
 | (15) |
 and
and  From
From  per-capita pollution growth rate of the firms N₁ is
  . Substituting per-capita capital dynamics evolution by its value and setting the total revenues from emissions taxes such that,
  , then pollution growth rate is
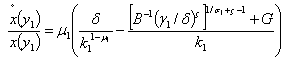 | (16) |
 then its expression is
 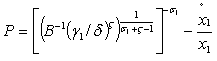 | (17) |
 | (18) |
 | (19) |
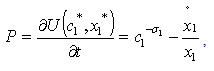
 Setting P=0 (see the appendix for proof) i.e poverty eradication yields revenues from taxes on emissions G in function of per-capita stock of capital i.e G=G(k₁). Then solving
  yields
  Substituting the expression of per-capita capital equilibrium found just above in the expression of G=G(k₁) yields the both variables in terms of parameters only i.e equations (18) and (19). The inverted U-shape exists, poverty may be eradicated and sustainability improved over time.
2.3.2. The Non Poor Agent
- The non poor agent wage rate income, wH(t) allows the agent contracts a social insurance v(t) like each agent who works in the firms N₂.. Indeed, the utility function of the non poor agent is expressed by (20) i.e
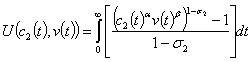 | (20) |
 . Optimization of the utility function subject to the budget constraint yields the equilibrium per-capita consumption c₂*(t) and the equilibrium per-capita social insurance i.e
  and
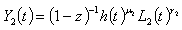
and  where ∅(z)=(1-z)⁻¹ and
  . The firms N₂ per-capita pollution function
  implies
  is a decreasing function in per-capita capital stock. Thus the firms N₂ pollution function growth rate is
  . Substituting per-capita growth rate of the capital stock of the firms N₂ by its value, yields the final analytical pollution type 2 expression (21) i.e
 | (21) |
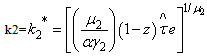
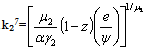
 yields the equilibrium per-capita stock of capital leading to pollution eradication, k₂* such that
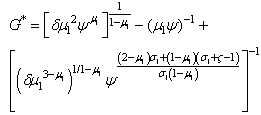
  Where G* expression is already determinate aboveProposition 43:. The thresholds of production y*, of the wage rate income w* and of human capital level h* are expressed by equations (23)- (25) i.e
 | (23) |
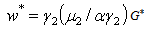 | (24) |
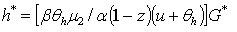 | (25) |
3. The Optimal Problem
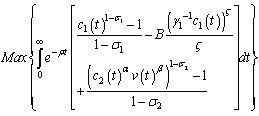 | (28) |
 According to the Optimal Control Theory, the Hamiltonian, H is expressed such as
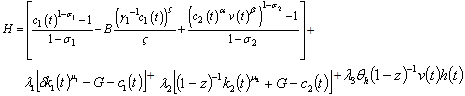 | (29) |
 | (30) |
 | (31) |
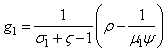
 is the economic growth rate of the firms N₁,, the growth rate of the efficient firms is
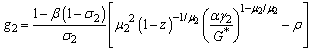
  and
and  is the environmental quality growth rateDefinition 2: the optimal sustainable development path where the economic growth and the environmental quality grow at the same rate i.e (g₁, g₂, gv) and g₂ =gv exists (See the appendix for proof)
4. Results and Discussions
- 1st results category: the tax rate set is the sum of the payment probability conditioned by the government staff behaviour, where he has a probability p to be honest and q to be corrupt added to a corruption degree expressed by s i.e :
 =pr₁+q(1-s)r₁=(q+p)r₁-qsr₁=r₁-qsr₁ yields
  =(1-qs)r₁. If q=04,i.e corruption is absent, there exist a unique optimal sustainable development path expressed by a couple of functions, (G, k2) such that, G=G* and k₂=k₂* , therefore, because
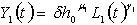
  and g₂= gv , the poor economy converges to its optimal sustainable development path without poverty and pollution5 due to the fact that p=1, then
 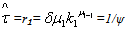 , therefore
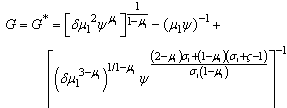 | (33) |
 | (34) |
 6, therefore
  is a preliminary corruption activity where e is a per-unit emission stock. The success of the policy depends on the value of the probability, if p is close to 1 then the optimal sustainable development path is reached because negotiations between the staff and the non efficient firm fail, thus,
 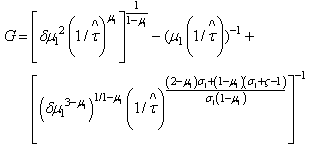 | (34) |
 | (35) |
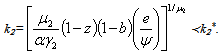
 . Otherwise, if p is close to 0, the optimal sustainable development path can’t be reached because negotiations between the staff and the non efficient firm achieved and then, G converge to 0
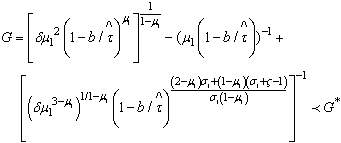 | (36) |
 | (37) |
 , =(1+b)/ψ , this situation reveals a special economic policy deal and can be viewed in two different ways with respect to the impact on sustainable development, we have
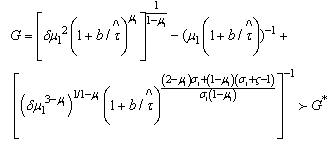 | (38) |
 | (39) |
 indeed G=G* and k2=k2* therefore, now we know that it leads to
  and this situation serves as a reference of the efficiency of the economic policy conducted by the social planner in regard to the biased situations i.e when q≠0If q≠0 , the tax rate
  indeed G≠G* and k2≠k2* thereforeIf
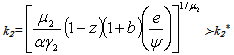
  then G>G* and k2>k2* indeed
  . if there is foreign aids introduction or fiscal policy based on investment support of the firms, growth accelerates. Otherwise, if this case corresponds to debt contraction because of corruption, then
  emissions still too high than the expected level, the economy can't converge to the optimal sustainable development path because funds are not high enough to support professional training. Emissions remain too high to allow growth increases. Poor agents are unable to change their social status because of imperfect institutions. Most of polluting firms pursue their activities, thus poverty under development and corruption maintain.If 0<s<1 then G<G* and k2<k2* indeed
  , in this case, the bias introduced leads to low funds and high pollution, thus continuous corruption and low growth.If s=1 then G≤G* and k2≤k2* indeed
  . The bias introduced depends on the value of the probability p such that the economic policy is completely ruled-out since p converges to 0 meaning that q converges to 1 or extreme eviction, in that case we have
  converges to 0. There is no capability for the social planner to make the economy getting out of poverty trap. If p converges to 1, then
 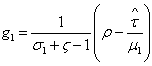 converge to g1*, development and sustainability are improved.
 5. Conclusions
- Fiscal policy based on emissions taxation can allow the poor country’s economy get out of poverty trap if required conditions are filled i.e there is no corruption for underdevelopment to cease and sustainability to improve. If institutions are imperfect, the poor country’s economic path takes more time to reach optimal locus without poverty even using subsidies on firm financial support. The model examined the modality for the poor economy where prevail corruption and under development to overcome growth absence and establish optimality and finds that: productivity increase due to human capital increase may open up social insurance possibility and sustainability increase, firms under development capacities are nourished by negotiation which creates non rational choices and poverty prevalence. Under development and poverty motivate corruption and alter sustainability. Examining the instant in time when negotiations hold between the government staffs and firms yields to economic policy interruption and show that it is difficult to prove corruption existence through data, analytical models are suitable to study hidden behaviours like corruption because of data unused for its understanding.
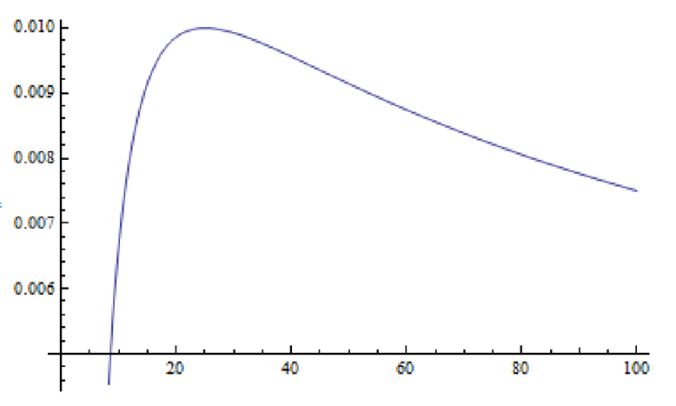 | Figure 1. the inverted U-shape provided by poor solution utility |
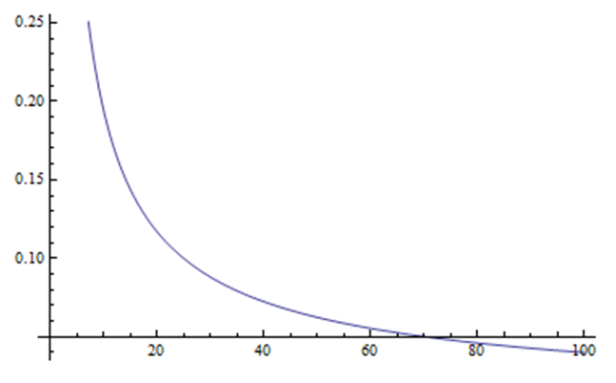 | Figure 2. Half inverted U-shape highlights by non poor agent strategy |
ACKNOWLEDGEMENTS
- The author wishes to thanks the Editor and the anonymous referees of the journal, errors and misunderstandings are solely mines.
APPENDIX
- Proof of Lemma1Following Stockey (1998), the firms produce y(t) using the technology ∅(z) which generates a level of pollution x(t)=y(t)z(t)ɛ. Therefore, potential production is y(t)∅ (z(t)) where ∅ (,) is the technology function which is increasing and convex on actual production i.e ∅′(z)≻0, ∅′′(z)≻0 and ∅′(1)=δ≼1. Then, the effective production function is Eff(y(t))=y(t)∅ (z(t))-y(t)z(t)ɛ..The choice of the technology is given by the equilibrium condition provided by the optimization of the effective production function with respect to the index of technology i.e:
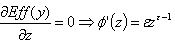 If ε≻1 then, there exist an integer n such that n=ε-1≻0. Indeed, the derivative of the function of technology is,
 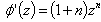 . Therefore, the previous function can be approximated by the series
 . Given that the general term of the series
  is zp and converges to 1/1-z since |z|<1. Then
  is the derivative of the previous serial where p=1+n. Thus, its general term is pzp-1 and can be approximated by the series
  which converges to 1/(1-z)². Therefore, we have ∅′(z)≃1/(1-z)². Indeed, ∅ (z)=1/1-z<∞. Consequently, if 0<z<1, the technology chosen by the firms N₂ is ∅ (z)=1/1-z<∞ which is an increasing convex function. In contrast, if z=1 then, according to the assumptions of the model, we have ∅′(1)=δ thus ∅ (z)=δz=δ which corresponds to the technology chosen by the firms N₁ , a constant function not linked to the index of technology. Consequently, the technology used by the firms N₁ is ∅ (z)=δ8. Proof of the growth rates
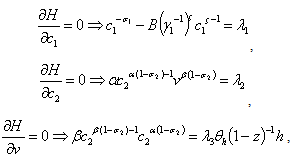 Therefore we have
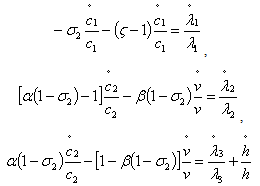 Where
Where 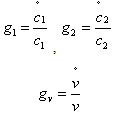 The factor prices are
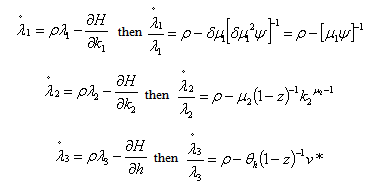 Where v* is the optimal demand of insuranceTherefore we obtain
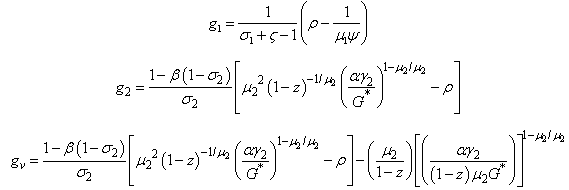 Proof of the Optimal solution stabilityIf g2 =gv then we solution can be written such as a (2,2) matrix i.eM
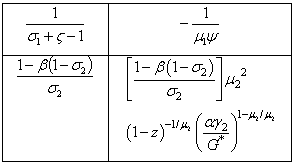 Indeed the characteristic polynomial, PM (λ) is the following matrix
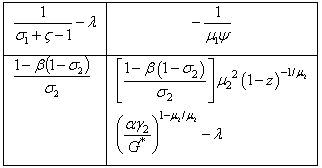 We obtained through the calculus that PM (λ)=λ2+(a+b)λ+abWhere
 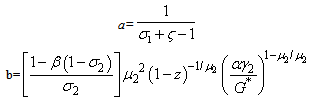 Therefore ∆=(a+b)2 -4ab=(a-b)2 >0 Thus, there exist two eigenvalues which are
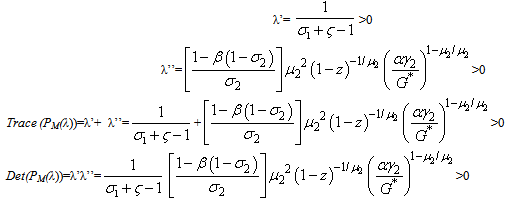 Consequently, the solution exists and is optimalProof: setting the pollution evolution to zero i.e
  yields the equilibrium per-capita stock of capital leading to pollution eradication k₂* such as
 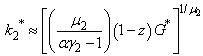 because
  then
then  which yields
  then we have
  . Indeed we can approximate per-capita capital stock such as
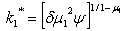
  . Therefore, since the two previous conditions on capital equilibrium stock k₁* and revenues from taxes on emissions G* are filled, the social planner’s intervention has higher probabilities of success.First, to prove the production threshold’s expression, we follow Stockey (1998) in assuming
  where 0<μ₂<1. Indeed, the threshold of the level of production is9,
  which leads to
  then
then  We have 0≺μ₂≺1 and 0<z<1 indeed,
  converges to 0 and thus y* ≼y₂Second, to express the wage rate income threshold, we know that
  then replacing the wage rate incomes by their respective value leads to
  replacing once more per-capita capital equilibrium stocks by their respective values, yields
  finally replacing G* by its value, gives the wage rate income threshold expression written above.Third: to express human capital threshold level, we assume that basic human capital growth rate moves such as
  . Therefore our aim is to make uδh0 converge to h* where
  already converge to
  and therefore we have,
  and h* is the learning by doing effect on labour productivity, v* is the insurance equilibrium computed above.Indeed,
  and following Lucas (1988), uϵ[0,1] is the fraction of time an agent spends in the production process in order to increase his labour productivity. The full time of each agent is normalized to 1 and u≼θh i.e productivity acquired older through the production process is lower than the one acquired in the education sector earlier by skilled labour or the actual labour force of the firm, N₂ .Costly education is assumed to be more efficient than learning by doing10. Therefore we have
  Indeed
Notes
- 1. This is the World Bank's global poverty count, which started with Montek Ahluwalia, Nicholas Carter and Hollis Chenery (1979), and became the dollars-a-day count in the World Development Report, 1990 was incorporated into international policy making and discussion via the Millenium Development Goals (MDG)2. This function is the same as the one used by Stockey (1998)3. The aim of the economic indicators or the thresholds of crucial variables is to evaluate the way poverty and environmental degradation can be improved in order to establish Pareto optimality in correcting failures introduced by the market based economy4. Proof of existence and stability of sustainable growth path (see the appendix)5. gv=g₂ yields σ₂=1-1/2α then g₁→g₂ if and only if r₁=[σ₁+ζ-1]/[1+β(2α-1)/4α]r₂=Δr₂ for simplicity, we assume r₁≃r₂6.
 7. See proposition 48. Because of its improvements absence through time, it is a pollution-augmenting technological change [Bovenberg-Smulders (1995)]. It generates an increase in pollution through time in contrast to the technology used by the firms N₂ which therefore, is a pollution-reducing technology. The lower the technology index is, the more efficient the corresponding production is both in its level and its quality (ecological) aspects9. the threshold of production is given since the inverse of the elasticity of substitution equals 110. This point of view is highly discussed in microeconomic concerning human capital investment where for some authors education is a filter or a signal and only the experienced at work is efficient.