-
Paper Information
- Next Paper
- Paper Submission
-
Journal Information
- About This Journal
- Editorial Board
- Current Issue
- Archive
- Author Guidelines
- Contact Us
American Journal of Economics
p-ISSN: 2166-4951 e-ISSN: 2166-496X
2012; 2(7): 146-163
doi: 10.5923/j.economics.20120207.01
A Social and Economic Development Index: NUTS Ranking in Portugal
Francisco Diniz , Teresa Sequeira
Centre ofTransdisciplinaryDevelopmentStudies (CETRAD)/Universityof Trás-os-Montes and Alto Douro (UTAD), Vila Real, Portugal
Correspondence to: Francisco Diniz , Centre ofTransdisciplinaryDevelopmentStudies (CETRAD)/Universityof Trás-os-Montes and Alto Douro (UTAD), Vila Real, Portugal.
| Email: |  |
Copyright © 2012 Scientific & Academic Publishing. All Rights Reserved.
Once we accept the principle that development is a process which leads to changes in people’s living conditions, regional development economists will always find it a challenge to try to define new ways of measuring the development level. The aim of this study is to calculate and to compare a Social and Economic Development Index (SEDI), regarding each concelho (NUTS IV) in Portugal. The SEDI is based on a set of variables– regarding demography, education, employment, entrepreneurial structure, health, and housing conditions – present in each concelho. From there it will move forward to seeking for homogeneity patterns between the various concelhos, with recourse to the clusters multivariate statistic method. Results point to there being clusters of concelhos highly differentiated, which suggests the need for a special care in setting up the spatial boundaries prior to its application to regional development policies and public management measures.
Keywords: Social, Economic Development Index, Cluster Analysis, Public Management
Cite this paper: Francisco Diniz , Teresa Sequeira , "A Social and Economic Development Index: NUTS Ranking in Portugal", American Journal of Economics, Vol. 2 No. 7, 2012, pp. 146-163. doi: 10.5923/j.economics.20120207.01.
Article Outline
1. Introduction
- The aim of this study is, first of all, to present a new way of ranking Portuguese territorial units on the mainland, at the level of the concelhos1, while making some considerations as to the position they occupy in what concerns social and economic development indicators. These will include variables other than those strictly related to economics. At a later stage, this study will be dealing with homogeneity relationships that might eventually exist among the different concelhos departing from a multivariate statistical model - the clusters – obtained in the course of a process of several stages which begin with a hierarchical method followed by a non-hierarchical one (K-means). Section 3 provides the methodological structure used in this study in order to facilitate the understanding of all the steps followed to achieve the aforementioned tasks.Section 4, in turn, presents an analysis of the results obtained as well as a description of the social and economic development level of all the different concelhos contemplated in this study, while ranking them and pointing out the variables or sets of variables which establish a connection between their development level and all the aspects which might account for it. These aspects are alsodealt with in greater detail in section 5 as an attempt to obtaining the clusters. This study ends with some final remarks andconsiderations regarding its own shortcomings at the same time that it sets some guidelines for future research.
2. Socio-Economic Development
- It is true that the concept of development implies a notion of futurity; it is also true that there can be no future without a clear knowledge of the past. From the beginning, any development process is associated with the idea of observing a certain situation which will be the starting point of that process. When subject to a deeper analysis, that idea will become the object of implementing a growth model closely linked with how it turns and changes into a quantitatively as well as qualitatively higher stage.Although the actual per capita GDP is one of the indicators more frequently used to measure and compare economic growth/development processes, going on in different spatial areas, it has raised some severe criticism among researchers who have been pointing out its limited nature, especially because per capita GDP is but one of the many aspects of regional development. In its exclusive application this indicator ends up neglecting social aspects (such as access to education, health care and other living conditions) on the one hand, and other equally important variables that can be used to measure the economic performance of a given territory[1].Since 1990, the United Nations Development Programme (UNDP) has been studying the recent history of human development evolution (especially after 1960) to the extent that it is primarily a process leading to each individual being able to widen the possibilities he or she is being given through accomplishing three major things: a long life, a good health, and knowledge that will grant him or her access to all the necessary requirements for a suitable living standard.The concept of human development, however, does not exhaust itself in achieving these goals; it involves other equally important dimensions – even if they are not easy to achieve – which have to do with political, economic, and social freedom, but also creativeness, productiveness, and respect for basic human rights. As such, it points to two main features which always go hand in hand: namely the enhancing of individual abilities and the way people put them to use, whether for productive or recreational or even political, cultural, and social purposes. The lack of balance between these two aspects concerning human development can lead to serious frustration[2].Therefore, gender issues were introduced in 1995. Since then, attention has been given to how differences of opportunity between genders could alter the ranking of countries vis-à-vis their development level. Likewise, the degree of participation of women in societies’ political and economic life has been taken into account. Ever since 1997 special attention has been given to human poverty and the countries’ situation has been measured on the assumption that poverty statute changes depending on how high the development level is or whether it is still at an early stage. Finally, in 1999 the technological achievement index was calculated for the purpose of defining leading countries, potential leaders and dynamic followers of new technologies[3].All these approaches focused on a country as a territorial unit and despite including several variables other than GIP per capita they do not reflect a wide range of valences when the territorial analysis reaches a more restrict level[4]. The value added of this study lies, on the one hand, on a territorial analysis of a more local nature and, on the other hand, on a wider range of variables (demographic, educational, health care, economic/entrepreneurial, environmental, and quality of life) making room for a better hierarchization of territorial units as far as their social and economic development level is concerned.
3. Methodology
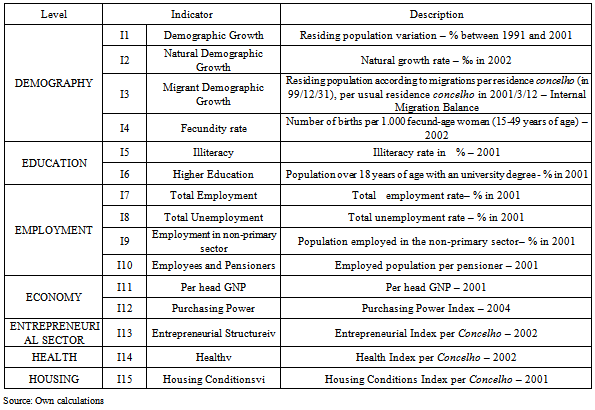
- The present study proposes a methodology which follows closely the one adopted by the UNDP in the Annual Report on Human Development in order to quantify social and economic development at a local level. It contemplates the integration of different dimensions (demographic, economic, social, and environmental) so that it can provide an integrated conceptual view on development.The status quo model was the one chosen to systematize indicators. In fact, although it is usually assumed that development is best represented when different forms of indicators (pressure, status quoand answer)2, as well as the relationships between them, are analysed – only the former was taken into consideration, since the analysis in question concerns the status quo of development dynamics within the territory composed of the 278 concelhos in Mainland Portugal.
|
 | (1) |
 | (2) |
4. Results and Discussion
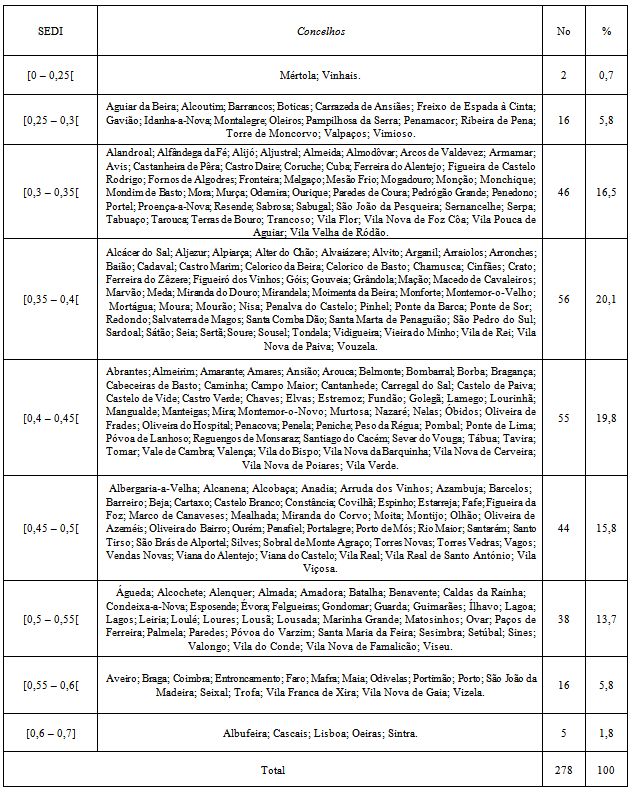
- Having described the methodology used to treat data concerning the variables chosen to deal with the various levels approached it was possible to calculate a social and economic development index – the SEDI – for each of the 278 concelhos in Mainland Portugal. Based on this index and on the values obtained for each concelho, we will first look at the hierarchical position of the concelhos explaining their development level by their place in the ranking in relation to the 15 indicators which compose the final index. The SEDI presents a value oscillating between a little under ¼ and a maximum of approximately 2/3. The variation coefficient value is not significant since the standard deviation is about 20% of the mean value. The concelho of Vinhais shows the lowest index value (0.2364), which means it is only 24% short of having the worst results of all the indicators.Lisbon in turn occupies the top place in the ranking reaching a threshold of 0.6609, which, nevertheless, places this concelho 34 points short of reaching an optimal position. The SEDI concentration is at 40 points, moving less away from the worst position than from the most favourable one. (Annexe I, Table I.1) The two concelhos with a SEDI below 0.25 (about 1%) - Vinhais and Mértola –, are both located in the hinterland and on the border with Spain. The 16 concelhos with a SEDI between 0.25 and 0.3, have in common the fact that they all lie several kilometres inland. And when the index goes up to 0.35, of the 46 concelhos in that interval (approximately 17% of the total under analysis), only Odemira lies on the coast, more precisely in Alentejo (Figure 1).
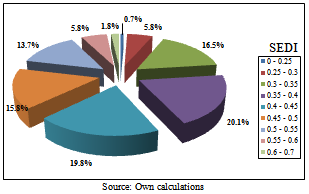 | Figure 1. Per cent Distribution of the Concelhos According to SEDI Levels |
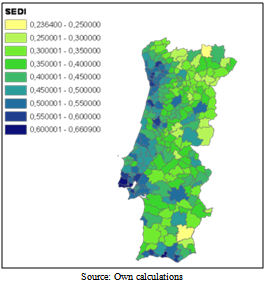 | Map 1. SEDI for the Concelhos of Mainland Portugal |
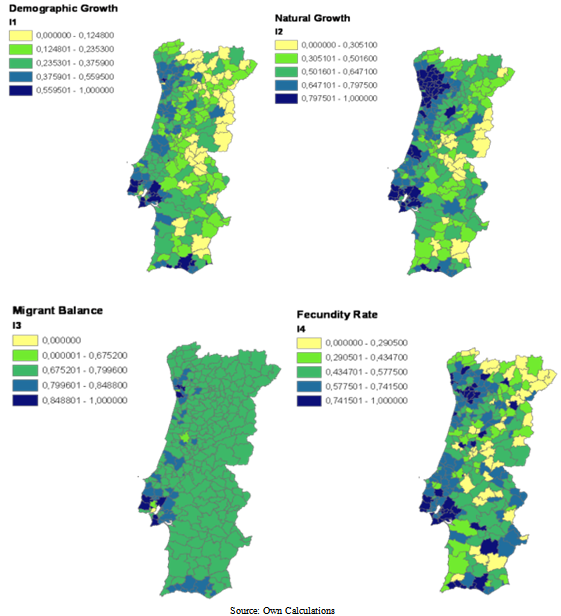 | Map 2. Demography |
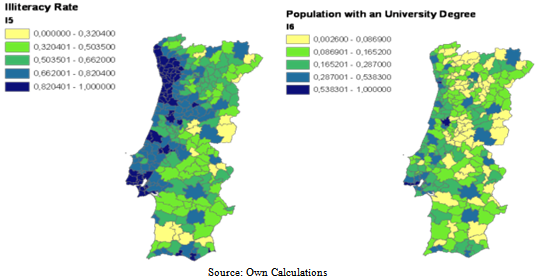 | Map 3. Education |
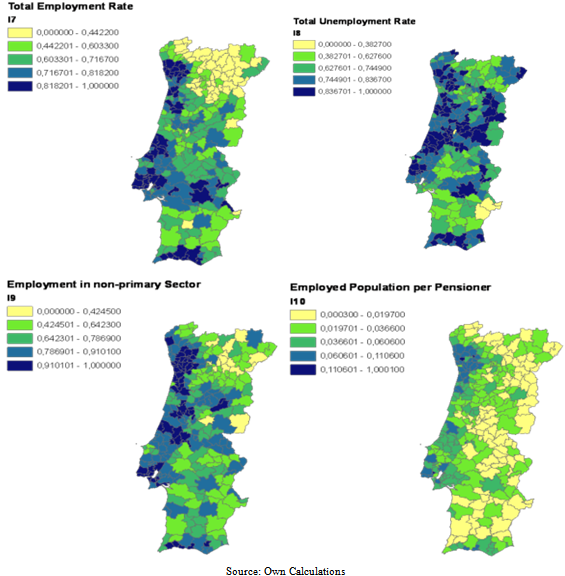 | Map 4. Employment |
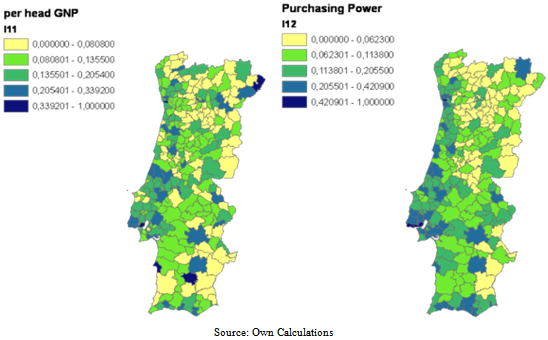 | Map 5. Economy |
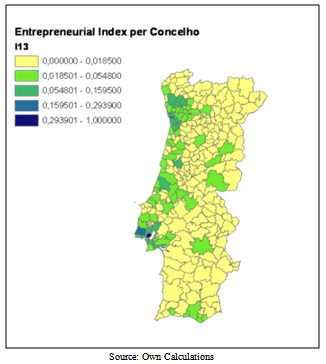 | Map 6. Entrepreneurial Sector |
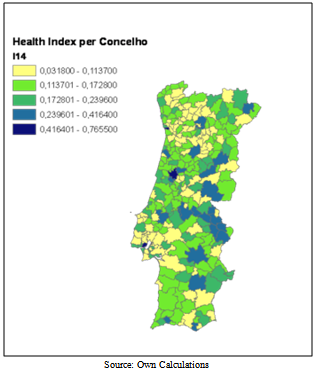 | Map 7. Health |
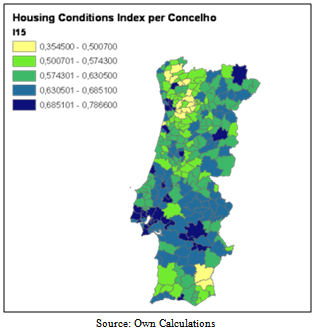 | Map 8. Housing |
- Finally, the analysis of the housing conditions shows that the concelhos situated in the interior north and not very far from the coast have more weaknesses than the ones further inland, with the exception of Mértola, and Alcoutim, in BaixoAlentejo, and Algarve, respectively. The latter actually face great difficulties as regards housing conditions. Although living conditions are much better in both metropolitan areas, it is already possible to enjoy some good conditions in terms of comfort in several concelhos of the interior of the country (Map 8).
5. Cluster Analysis
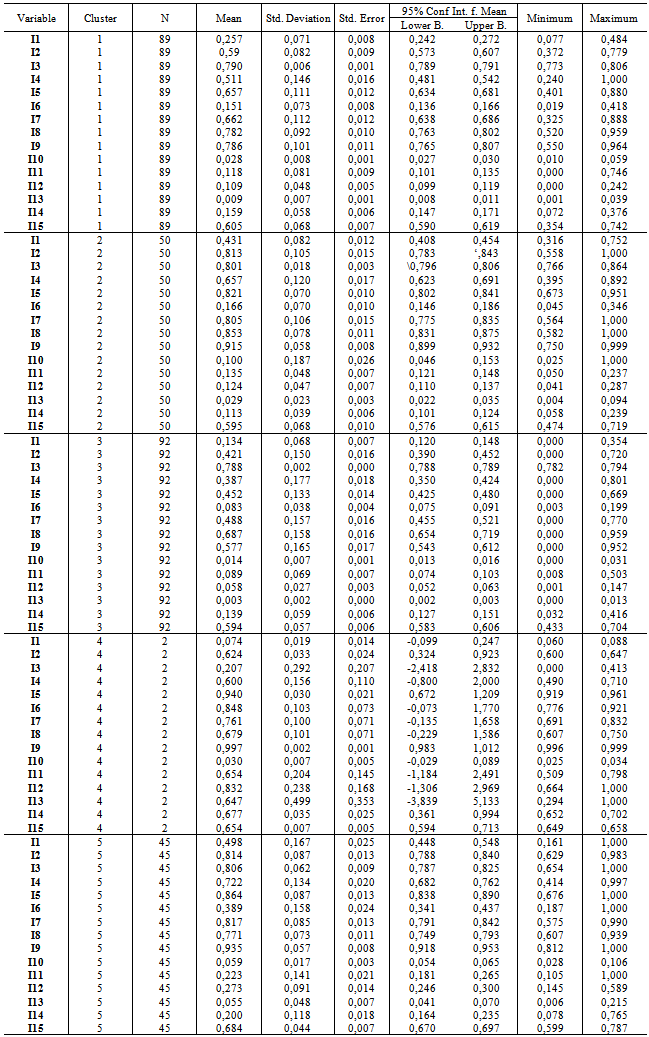
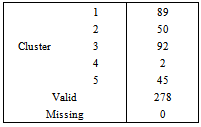
- In order to be able to analyse the SEDI’S several components we tried to group the concelhos into clusters, which as described by López[17] is a multivariate statistic method whose main object is “… revelarconcentraciones en los datosparasuagrupamientoeficiente en clusters (o conglomerados) segúnsuhomogeneidad”7.As it was already mentioned in section 2, our first intention was to obtain hierarchical clusters. Based on our findings we concluded that aggregation results were very similar whether we used the Complete or the Average Linkage (Within groups) method.
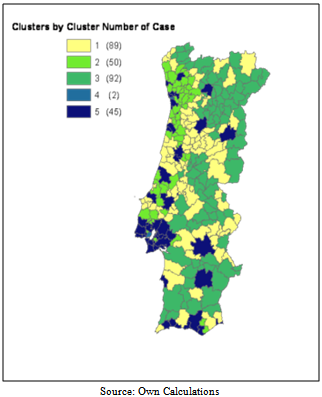 | Map 9. The concelhos grouped into clusters (K-means) |
|
6. Final Remarks and Policy / Managerial Implications
- The use of cluster techniques to analyse the several indicators which compose the SEDI in each concelho only stressed the notion that the concelhoson the coast and the ones in the interior of the country, separated by an intermediate central zone, have different characteristics and that the same situation occurs when we look at the group of concelhos which include the main towns and the concelhos around them and the one formed by the two big cities, Lisbon and O’Porto.The simple exercise of overlapping the NUT III regions map and the map of the concelhos produced would clearly show the great asymmetries in terms of development within each NUT III. These asymmetries would be even bigger if we were to overlap the NUT III regions map with the map of the territory regarding NUT II. We believe these considerations to be particularly important for the definition of new development instruments and policies insofar as the ones existing are traditionally conceived and targeted to a much too wide territorial aggregation level to be able to cope with each territorial unit’s weaknesses and specificities and, therefore, compromising its efficiency and effectiveness.These results also suggest some public management measures regarding such aspects as land use and organization and public budgeting which are essential in terms of development if a larger territorial cohesion is to be attained. We refer naturally to such measures likely to increase the literacy level, to fight the depopulation of the hinterland as well as increasing entrepreneurial attractiveness, namely by investing in schools, in the continuous training of teaching agents and in other communication infra-structures. This may be achieved with recourse to tax incentives that may help high skilled human resources settle all over the country and attract private investment in a diversified entrepreneurial tissue. In short, centralized management of regional development policies has been one of the main obstacles to a more equal distribution of resources that might lead to equal opportunities in territorial development. It is important to point out that this study was carried out through calculating indicators that referred to the total area of Mainland Portugal. Recalculating these values based on a smaller territorial unit like NUT II and NUT III will certainly be a useful topic to pursue in further research.
ANNEX I
ANNEX II – Cluster Analysis (K-means)
|
|
|
| |||||||||||||||||||||||||||||||||||||||||||||||||||||||||||||||||||||||||||||||||||||||||||||||||||||||||||||||||||||||
| |||||||||||||||||||||||||||||||||||||||||||||||||||||||||||||||||||||||||||||||||||||||||||||||||||||||||||||||||||||||||||||||||||||||||||||||||||||||||||||||||||||||||||||||||||||||||||||||||||||||||||||||||||||||||||||||||||||||||||||||||||||||||||||||||||||||||||||||||||||||||||||||||||||||||||||||||||||||||||||||||||||||||||||||||||||||||||||||||||||||||||||||||||||||||||||||||||||||||||||||||||||||||||||||||||||||||||||||||||||||||||||||||||||||||||||||||||||||||||||||||||||||||||||||||||||||||||||||||||||||||||||||||||||||||||||||||||||||||||||||||||||||||||||||||||||||||||||||||||||||||||||||||||||||||||||||||||||||||||||||||||||||||||||||||||||||||||||||||||||||||||||||||||||||||||||||||||||||||||||||||||||||||||||||||||||||||||||||||||||||||||||||||||||||||||||||||||||||||||||||||||||||||||||||||||||||||||||||||||||||||||||||||||
ACKNOWLEDGEMENTS
- The authors wish to thank Dr. Luís Rodrigues for this contribution to calculating SEDI.
Notes
- 1. NUTS IV.2. Based on a Friend’s and Rapport’s work (1979), the OECD [5] developed a model called Pressure – status quo – Answer (PSA) according to a causality concept which postulates that human activities exert some sort of pressure which qualitatively change the economic, social and environmental systems’ status quo, therefore creating the need for an adequate answer through different policies and instruments.3. Regarding the statistical sources used, the gathering of data was done mainly with recourse to INE (National Statistics Institut). Besides the information collected from Census 2001 [6] and Statistics Year Book 2001 and 2002 [7, 8], other publications were looked up in the Internet at www.ine.pt, such as Estudo do Poder de CompraConcelhio 2004 (Study on Purchasing Power) [9], concerning indicator I12 – Purchasing Power. On the other hand, indicator I11 – per head GNP was calculated with recourse to Pedro Nogueira Ramos’s Estimates on per head GNP in Mainland Portugal’s Concelhos [10].4. In this case the criterion adopted was the same used by the UNDP for the construction of the Human Development Index [13, 14].5. K-means is a non-hierarchical method which, as such, does not require a similitude/distance matrix calculation and is directly applied to the original data. It starts with the initial partition of individuals into a previously defined number of clusters and consists of transferring an individual to the cluster whose centre is nearer [15]. 6. The Complete Linkage criterion is a process by which the distance between two groups is defined as the distance between its most distant or least similar elements. The group is then described as a set of elements where each element resembles more all the other elements within the group than any of the other elements of the remaining groups [15].7. To reveal data concentration in order to effectively group them into clusters (or conglomerates) according to their homogeneity. (authors’ translation).8. Assuming that if a variable discriminates much among clusters, its variability (given by the Cluster Mean Square) will be high among clusters and low within its own cluster (obtained through the Error Mean Square). Thus, variables with a higher Cluster Mean Square and lower Error Mean Square are the ones which better define the clusters for they have a higher F value [11].9. Since we wanted to perform mean multiple comparisons we did a posteriori tests to find out which of the mean pairs were different using Tukey’s and Bonferroni’s Post-Hoc tests.
References
| [1] | N. Baster, Measuring Development – The Role and Adequacy of Development Indicators, London: Frank Cass and Company Limited, 1972. |
| [2] | D. Seers, “Os indicadores de desenvolvimento: o que estamos a tentar medir?”, Análise Social, vol. XV, 19, 1972. |
| [3] | PNUD, Relatório do Desenvolvimento Humano 1997 – 2003, Lisboa: Trinova Editora, 2006. |
| [4] | F. Diniz, An Essay on Definitions of Typologies for Less favoured areas – Two Portuguese Regions: Alto Trá-os-Montes and Douro, Electronic version of accepted papers do XIII World Congress of IEA, Centro Cultural de Belém, September 9-13, Lisboa, 2002. |
| [5] | OECD, OECD core set of indicators for environmental performance reviews, Paris: OEDC Environment Monographs No. 83, 1993. |
| [6] | INE, Recenseamento Geral da População e da Habitação – Censos 2001, Lisboa: INE, 2001. |
| [7] | INE, Anuário Estatístico 2001, Lisboa: INE, 2002. |
| [8] | INE, Anuário Estatístico 2002, Lisboa: INE, 2003. |
| [9] | INE, Estudo sobre o Poder de Compra Concelhio - 2004, Número VI, Lisboa: INE, 2005. |
| [10] | P. Ramos, “Estimativas do PIB per capita para os Concelhos do Continente Português”, Revista de Estatística, 3º Quadrimestre de 1998, V.3, pp. 29-49, 1998. |
| [11] | João Maroco, Análise Estatística com utilização do SPSS, 2ª Edição, Lisboa: Edições Sílabo, 2003. |
| [12] | Maria Helena Pestana and João Nunes Gageiro, Análise de dados para as Ciências Sociais. A complementaridade do SPSS, 3ª Edição Revista e aumentada, Lisboa: Edições Sílabo, 2003. |
| [13] | PNUD, Relatório do Desenvolvimento Humano 1990 – 1993. Nova Iorque: Oxford University Press, 1993. |
| [14] | PNUD, Relatório do Desenvolvimento Humano 1994 – 1996, Lisboa: Tricontinental Editora, 1996. |
| [15] | Elisabeth Reis, “Análise de Clusters: Um Método de Classificação sem Preconceitos”, Temas em Métodos Quantitativos para a Gestão, nº 6, Lisboa: GIESTA, ISCTE, 1993. |
| [16] | Comissão das Comunidades, EDEC - 1999 - Para um desenvolvimento equilibrado e sustentável do territorial da União Europeia, Maio, Potsdam, 1999. |
| [17] | César P. Lopez, MétodosEstadísticosAvanzados com SPSS, Madrid: Thomson, 2005. |
 Abstract
 Reference
 Full-Text PDF
 Full-Text HTML