-
Paper Information
- Previous Paper
- Paper Submission
-
Journal Information
- About This Journal
- Editorial Board
- Current Issue
- Archive
- Author Guidelines
- Contact Us
American Journal of Economics
p-ISSN: 2166-4951 e-ISSN: 2166-496X
2012; 2(5): 87-95
doi: 10.5923/j.economics.20120205.04
Teachers’ Quality and Internal Efficiency in Primary Schools in Ekiti State, Nigeria
 Abstract
 Reference
 Full-Text PDF
 Full-Text HTML
1Department of Educational Foundations and Management,University of Ado Ekiti, Nigeria
2Department of Curriculum Studies, College of Education, Ikere Ekiti, Nigeria, Teachers’ Quality and Internal Efficiency in Primary Schools in Ekiti State, Nigeria
Correspondence to: E. T. Adu , Department of Curriculum Studies, College of Education, Ikere Ekiti, Nigeria, Teachers’ Quality and Internal Efficiency in Primary Schools in Ekiti State, Nigeria.
| Email: |  |
Copyright © 2012 Scientific & Academic Publishing. All Rights Reserved.
This paper examined teachers’ quality and internal efficiency of primary schools in Ekiti State, Nigeria. As an expo facto and descriptive research, the study population comprised all the 694 primary schools in the State. Out of this, a sample of 520 primary schools was selected through the simple random sampling techniques. The headteachers of the 520 primary schools were the respondents in the study. A cohort of 91,061 pupils who entered the schools in 2003 and graduated in 2008 were purposively selected for the study. Two instruments were used to collect data. These were an inventory and a questionnaire. The data collected were analyzed using frequency counts, percentages, Pearson Product Moment Correlation analysis, Correlation Matrix, Regression Analysis of Variance and Multiple Regression. It was found that teacher quality had significant relationship with the internal efficiency of primary schools in the State. The best predictor of internal efficiency of the schools was teacher qualifications. It was then recommended that the State government should intensify more effort in the training of teachers in order to acquire higher qualifications that would enhance the internal efficiency of primary schools in the State.
Keywords: Teacher, Quality, Internal, Efficiency, Primary, Schools
Article Outline
1. Introduction
- In the Nigerian school system, teacher quality could be examined in various ways. It could be examined in terms of teacher’s qualification and teachers’ competence[1]. It could also be examined in terms of teachers’ teaching experience[2]. It could as well be examined in terms of teacher’s integrity and teacher’s job performance[3,4].In this regard, the teaching force seems to be a major variable in determining the quality of a school system. Teachers as one of the inputs into the educational process constitute an important aspect in pupils’ learning. Considering this point,[5] argued that “the level of performance in any school is intimately related to the quality of its teachers” while “the quality of any school system is a function of the aggregate quality of teachers who operate it.” This contention supported[6] Mullen’s(1993) argument that the level of a teacher’s subject matter competence is a prime predictor of pupils’ learning. He argued that it is not only the qualifications obtained by a teacher that could contribute to a teacher’s quality but actual achievement in terms of subject matter competence.Researchers have also attributed the low achievement ofpupils in schools to teachers’ inadequate knowledge of the subject matter.[7] for instance, conducted a survey on teacher factor in the effective teaching and learning of English as Second Language(ESL) in Kaduna State, Nigeria and found that out of the 95 teachers in his sample, 44(46.3%) were degree holders in English Language having qualifications relevant to what they taught while 53.7% were non-degree holders or teachers specialized in other subjects teaching English Language in schools. The issue of getting competent teachers has been a major problem to students’ learning outcomes. He however observed that children of “all aptitude levels achieved more when taught by teachers who exhibited competency in classroom management.”The length of teaching experience of a teacher has been an important factor determining how effectively the teaching-learning process in a school has been achieved. The importance of experienced teachers in schools has been highlighted by many researchers[8,9]. Researchers have also given different opinions about teaching experience and pupils’ learning outcomes in schools[10,11]. Their arguments were based on the fact that experience improves teaching skills while pupils’ learn better at the hands of teachers who have taught them continuously over a period of years.Teachers’ integrity seems to be another variable of teacher quality in the school system. Academic integrity has been defined as the dignity which an individual exhibits in the pursuit of academic knowledge[12,13]. Others have described it as the prestige of oneself in his or her educational endeavours[14,15]. As such, how a teacher conducts himself or herself effectively in a school system is a function of his or her integrity[16,17].In the same vein, teachers’ job performance is another variable that could determine teacher quality in a school system. It refers to the actions of the teacher in performing certain jobs or duties in the school. It is the totality of the input of the teacher towards the attainment of educational objectives[18,19]. It is the act of accomplishing a given task in a school organization. It could be measured through the level of teachers’ competency in subject matter, lesson note preparation, content covered, level of coverage of scheme of work, lesson presentation, monitoring of pupils work, effective supervision, effective monitoring and the disciplinary ability of the teacher[20].Notwithstanding the aforementioned variables of teachers’ quality, how teachers’ have been performing their job effectively in relation to the internal efficiency of the school system has been a matter of concern to stakeholders in education[21-23].The term efficiency refers to the relationship between the inputs and the outputs of a system[24]. The inputs into the system include the pupils, teachers, furniture, equipment and facilities as well as finance and time while the output comprises the pupils’ who graduate at the end of the system[25].The concept of internal efficiency is of special interest to educational planners[26]. This contention agreed with the view point of[27] who reported that the more internally efficient the educational systems is, the less fund it would require to fulfill its objectives. Supporting this argument,[23] reiterated that the output produced from a given quantity of inputs could be increased or kept at the same level even when input level is reduced. This implies that internal efficiency is a process of utilizing minimum inputs to maximize output. As such, the internal efficiency of a school system is the relationship of outputs (graduates) to its inputs (resources). This argument supported the view point of[28] who reported that internal efficiency is the extent of the school system to minimize input and increase output. The increase in the rate of expenditure on education by government and other stakeholders as reflected in the unit cost indicates that more money is expended on each student overtime. In this regard,[29] argued that in order to determine the internal efficiency of the school system, one has to determine the inputs such as teaching and non-teaching staff, funds, equipment, physical facilities and other facilities in relation to the output produced with such educational inputs. Researchers have identified the student flow model in the school system as consisting of the promotion rate, repetition rate and dropout rate[30,31]. They argued that promotion rate is the rate at which pupils are promoted from one class to another in a cohort in a given year while repetition rate is the rate at which pupils repeat classes in a cohort of pupils in a school system. Dropout rate, on the other hand, is the number of pupils who left the school system at a particular time due to reasons such as withdrawal, transfer, incapability and so on. In the cohort, repetition and dropout constitute wastage in the system. In an ideal situation, pupils should normally spend 6 years in Nigerian primary schools. A situation whereby pupils spent extra years above the normal 6 years constitutes wastage in the system[1].Although teachers’ were posted to primary schools in Ekiti State, Nigeria on the basis of the government approved 11/2 teachers’ per class of 25 pupils[32], the factor of the urban and rural location of the schools tends to make certain schools to have a larger number of teachers’ at the expense of other schools. As such, there seems to be instances of schools having a larger number of teachers’ of a certain category on the basis of the government approved quota of 11/2 teachers per class of 25 pupils while other schools seem to have less of such category of teachers.
2. Purpose of the Study
- This is a short phase indicating the purpose of the study.In view of the foregoing, the purpose of this study was to examine the flow rate of pupils in primary schools in Ekiti State, Nigeria in order to determine the internal efficiency of the schools. It was also to identify teacher quality variables in the schools. Since teacher variables are many, teacher variables in this study were restricted to teachers’ qualifications, teachers’ competence, teachers’ teaching experience, teachers’ integrity and teachers’ job performance.
3. Statement of the Problem
- This phase identified the problem of the study.The problem of funding the educational system in Ekiti State, Nigeria has been a matter of concern to stakeholders in education[22,33]. The problem of pupils’ repeating a class for 1 or 2 years tends to constitute wastage in the system. This is in view of the fact that the space which could have been occupied by a new pupil would have to be retained for a repeater thereby siphoning more funds from government in terms of the continued teaching of the repeater in the same class for more than one year. Many reasons perhaps could be responsible for this development. Prominent among these reasons was perhaps the quality of teachers’ in the school system. The problem of this study therefore was to determine what influence teacher quality had on internal efficiency of primary schools in Ekiti State, Nigeria?
4. Research Questions
- In addressing the problem of this study, the following research questions were raised:1. What are the promotion rate, repetition rate and dropout rate in primary schools in Ekiti State, Nigeria between 2003 and 2008?2. Are primary schools in Ekiti State Nigeria internally efficient?3. Is there any significant relationship between teacher quality and internal efficiency of primary schools in Ekiti State, Nigeria?4. Which of the variables of teacher quality could best predict internal efficiency of primary schools in Ekiti State, Nigeria.
5. Method
- This shows the procedure used in the study. It included the research design, study population, sample and research instruments.This study adopted the ex-post facto and the descriptive research design of the survey type. It was ex-post facto research as it was an after fact or after event research[34]. It was also a descriptive research in the sense that it was a form of planned collection of data from a large population for the purpose of analyzing the relationships between variables[35].The study population comprised all the 694 primary schools in Ekiti State, Nigeria. Out of this population, a sample of 520 primary schools was taken and selected through the simple random sampling techniques. Out of all the 8,740 teachers including headteachers in the schools, 2,450 teachers including headteachers were selected for the study. The method of selection was by stratified random sampling technique. A cohort of 91,061 pupils who entered the 520 sampled schools in 2003 and graduated in 2008 were purposively selected for the study. This was to enable the researcher to examine the flow rate of the pupils through the six-year school system in terms of the promotion rate, repetition rate and drop out rate. Two instruments were used to collect data for the study. These were an inventory and a questionnaire. The inventory titled ‘primary schools teacher data and pupils’ flow rate inventory’ (PSTDPFRI) consisted of two parts A and B. Part A was demographic. It elicited information on the name of the school, its location, year founded, type of school and number of classes. Part B required information on the number of teachers by qualification, status and teaching experience. It also requested data on a cohort of pupils who entered the schools in primary 1 in 2003 and graduated in primary 6 in 2008. He then required data on the number of promotees, number of repeaters and the number of dropout in each of the years.The questionnaire titled ‘teachers’ competence, dedication to duty, integrity and job performance questionnaire (TCDDIJPQ) also consisted of two parts A and B. Part A elicited demographic information about each school such as the name of the school, its location, year founded and number of classes. Part B requested information about teachers’ competence, teachers’ dedication to duty, teachers’ integrity and teachers’ job performance. The content validity of the instruments was determined by experts in Tests and Measurement who marched each item of the instruments with the research questions in order to determine whether the instruments actually measured what they were suppose to measure. Their observations were used to effect necessary corrections on the instrument. Only the questionnaire was exposed to a test of reliability. Reliability test was not conducted on the inventory because the data collected through the inventory were already in the schools. In conducting the reliability for the questionnaire, the test re-test reliability technique was used. In doing this, the questionnaires were administered to 50 respondents outside the study area. After a period of two weeks, the questionnaires were re- administered to the same respondents. The data collected on the two tests were collated and analyzed using the Pearson’s Product Moment Correlation analysis. A correlation coefficient of 0.85 was obtained indicating that the instruments were reliable and consistent for the study. The instruments were administered by the researcher and research assistants. After a period of 2 weeks, the completed instruments were retrieved from the respondents. All the respondents duly completed the instruments indicating 100% response rate. The data collected were analyzed using frequency counts, percentages, Pearson Product Moment correlation analysis, Correlation Matrix, Regression Analysis of Variance and Multiple Regression. All the null-hypotheses formulated for the study were tested for significance at 0.05 alpha level.
6. Results
- This section focuses on data analysis and the interpretation of data collected for the study.Question 1: What are the promotion rate, repetition rate and dropout rate in primary schools in Ekiti State, Nigeria between 2003 and 2008?In computing the promotion rate, repetition rate and drop out rate of pupils in primary schools in Ekiti State, Nigeria between 2003 and 2008, data on the number of promotees, number of repeaters and number of drop out were collected from the responses of the respondents to the inventory. The cohort of 91,061 pupils in primary 1 in 2003 who graduated in primary 6 in 2008 from the sampled schools was used. The data collected were analyzed using frequency count and percentages. The findings are presented in table 1.1.As indicated in table 1.1, the number of promotees in primary schools in Ekiti State, Nigeria was found to be high in each of the years. Although, the cohort of 91,061 pupils started primary 1 in the sampled schools in 2003, the number of pupils reduced in 2004 to 89,901 as a result of repetition and drop out. For instance, the number of repeaters reduced from 3, 450 in primary 1 in 2003 to 1,421 in primary 6 in 2008. The number of drop out was at a fluctuating trend in each of the years from primary 1 in 2003 to primary 6 in 2008. The years 2009 to 2011 accounted for the number of repeaters and drop out who were yet to leave the school system.In computing the promotion rate, repetition rate and drop out rate among pupils in the schools, the following formulas[36] were used:
|
 | Figure 1. Cohort Analysis showing the flow rate of students in primary school Ondo State, Nigeria |
 Where:Pg+1t+1= number of students promoted to the next class g+1 in year t+1Egt = total number of students that are enrolled in the former class g in previous year t.2. Repetition rate
 Where:Rgt+1 = number of repeaters in the new academic year t + 1in a given class g, that is, the following year.Egt = number of students enrolled in the former academic Year ‘t’ in the same class session ‘g’3. Dropout rate
 Where:Dgt = number of students dropping out of class ‘g’ in year‘t’.4. Wastage ratio
 Where:*
 *
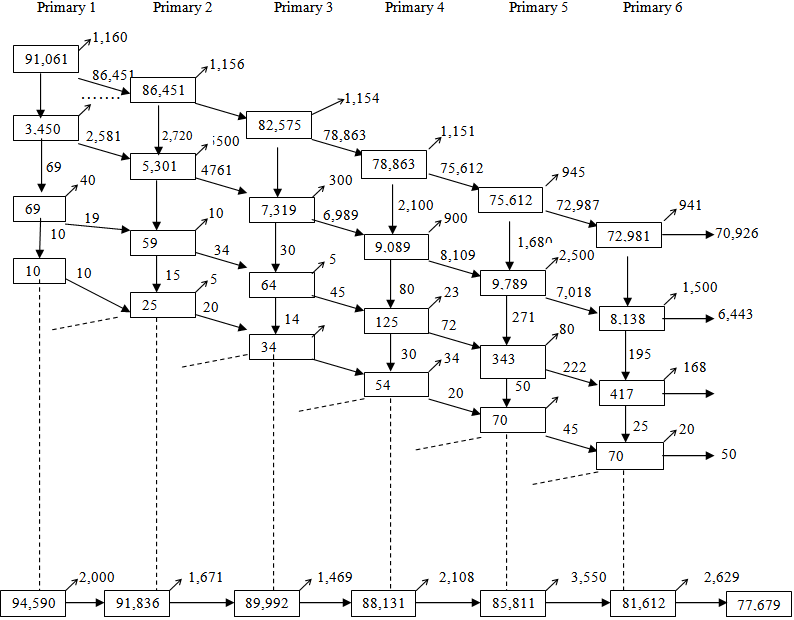
* Using the formulas, the promotion rate, repetition rate and drop out rate for the cohort of 91,061 pupils of sampled primary schools in the State were computed. Table 1.2 shows the findings.In table 1.2, the promotion rate shows a fluctuating trend from primary 1 in 2003 to primary 6 in 2008. The rate increased from 94.9% in primary 1 in 2003 to 98.5% in primary 2 in 2004. The promotion rate reduced to 98.2% in primary 3 in 2005 and increased to 98.8% in primary 4 in 2006. It then reduced to 98.1% in primary 5 in 2007 and further reduced sharply to 96.2% in primary 6 in 2008. The repetition rate reduced through out the 6years of schooling from 3.80% in primary 1 in 2003 to 1.71% in primary 6 in 2008. The dropout rate was at a fluctuating trend throughout the schooling period from 2003 to 2008. It was 1.27% in primary 1 in 2003 and 2.18% in primary 2 in 2004. It was also 1.93% in primary 3 in 2005 while in 2006 it was 0.53% in primary 4. The drop out rate however increased to 2.19% in primary 5 in 2007 as well as 4.19% in primary 6 in 2008. In the overall analysis, the table shows that the promotion rate was high throughout the schooling period while the repetition and dropout rates were at a low level.Question 2: Are primary schools in Ekiti State Nigeria internally efficient?In answering this question, data on the number of promotees, number of repeaters and drop out in the cohort of 91,061 pupils of sampled primary schools in Ekiti State Nigeria were collected from the responses of the respondents to the inventory. The data were analyzed in a cohort showing the number of promotees, number of repeaters and drop out on yearly basis from primary 1 in 2003 to primary 6 in 2008. The findings are presented in figure 1.In computing the cohort of pupils in the sampled primary schools, the following notations indicated in figure 2 were used in analyzing the pupils flow rate in figure 1.
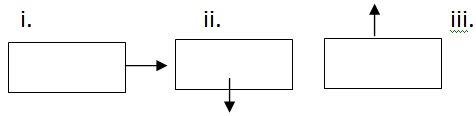 Where:i.=Promotion rateii.=Repetition rate iii.=Dropout rateThe results are as follows:No of dropout = 13,427Total output = 77,643Total inputPRY 1 = 91,061 + 3, 450 + 69 + 10 = 94,590PRY 2 = 86,451 + 5,301 + 59 + 25 = 91,836PRY 3 = 82,575 + 7,319 + 64 + 34 = 89,992PRY 4 = 78,863 + 9,089 + 125 + 54 = 88,131PRY 5 = 75,612 + 9,789 + 343 + 70 = 85,814PRY 6 = 72, 987 + 8,138 + 417 + 70 = 81,612Total input = 531,975
 Ideal input –output = 6/1 = 6Where 6 is the actual number of years to be spent by a pupil in the schools.
 ∴ Wastage ratio= 1.14In interpreting the wastage ratio, it means that one successful completer of primary school in Ekiti State, Nigeria on the average spent 6.85 pupil-years as against the ideal (optimum) pupil years of 6 years. A perfect situation will give a wastage ratio of 1 which is not possible in reality. As such, the nearer the wastage ratio is to 1, the more efficient is the system and vice- versa[1,4].Thus, in order to determine the internal efficiency, otherwise known as the coefficient of efficiency, the reciprocal of the wastage ratio was determined. As such, the coefficient of efficiency is equal to 1 divided by the wastage ratio and multiply by 100[4]. This was represented as follows:
 In this regard, the coefficient of efficiency in respect of this study was computed as follows:
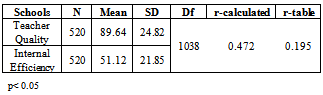
 The coefficient of efficiency = 87.7%The finding indicates that primary schools in Ekiti State, Nigeria are 87.7% internally efficient. This high coefficient of efficiency shows that primary schools in the State are internally efficient.Question 3: Is there any significant relationship between teacher quality and internal efficiency of primary schools in Ekiti State, Nigeria?
|
|
|
|
7. Discussion
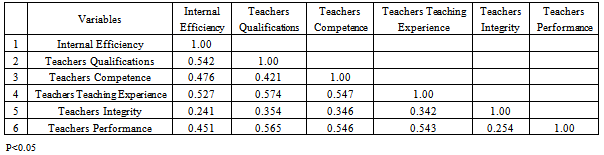
- This section focuses on the discussion of result inline with previous findings.The foregoing shows the analysis of data collected for this study. It was found that the promotion rate was high in each of the years of study, 2003 to 2008 while the repetition rate reduced sharply in primary 1 in 2003 to primary 6 in 2008. The number of drop out rate was at a fluctuating trend in each of the years. This finding agreed with the findings made by Ayodele,[40] who found increasing promotion rate and decreasing repetition and drop out rate in primary schools in Ondo State, Nigeria.The findings of this study reveal that primary schools in Ekiti State are internally efficient. Although the wastage ratio was 1.14 for the cohort 2003 to 2008, the coefficient of efficiency was 87.7%. This finding was consistent with the findings made by[1,33] who found that many primary schools in south west Nigeria were internally efficient.The significant relationship found in this study between teacher quality and internal efficiency of primary schools in Ekiti State, Nigeria suggest that the higher the teacher quality the higher the internal efficiency of the schools. This finding was in consonant with the findings made by[37] who found significant relationship between teacher quality and internal efficiency of primary schools in Kenya.The finding of this study which isolated teachers’ qualification as the best predictor of internal efficiency of primary schools in Ekiti State, Nigeria suggest that the higher the qualification of teachers’ the higher would be the internal efficiency of the schools. This finding was consistent with the findings made by[23] who reported significant relationship between teacher qualification and the internal efficiency of schools.
8. Conclusions
- This section gives a conclusion of the study inline with the findings.Considering the finding of this study, it was concluded that teacher quality is a critical variable in the internal efficiency of primary schools in Ekiti State, Nigeria. It was concluded that the higher the level of the variables of teacher quality the higher would be the level of the internal efficiency of the schools. The findings of the study have therefore led the researcher to conclude that teacher quality is a function of internal efficiency of primary schools in the State. The fact that the findings of the study isolated teacher qualifications as the best predictor of internal efficiency of the schools shows that teachers are the prime factor and the hub of the educational system in the State.
9. Recommendation
- This section gives suggestions for improvement based on the findings.Based on the findings of this study, it was recommended that Ekiti State government of Nigeria should intensify more effort in the training of teachers in order to acquire higher qualifications that would enhance the internal efficiency of primary schools in the State. Government should also intensify increase effort in staff development by sending teachers’ for further training in order to acquire advanced knowledge and skills that would make them perform better on the job in a bid to improve the internal efficiency of primary schools in the State.
References
| [1] | Akinwumiju A. (1995); Educational planning Statistics and models. Ibadan. Center for External Studies. 108-116. |
| [2] | Adeyemi, T. O. (2007). Teacher preparation and availability for achieving basic education in Ondo State, Nigeria. IDOSI Publications Turkey: Humanity and Social Sciences Journal, 2 (2); 159 – 168. |
| [3] | Wilson, A. & Pearson, R. (1993) “The Problem of Teacher Shortages” Education Economics 1, (1); 69-70. |
| [4] | Ayodele, J.B. (2005); Fundamentals of Systems Analysis in Education. Lagos: Bolabay publications.20-27 |
| [5] | Umeasiegbu, G.O. (1991) “Quality Versus Quantity in the Quest for Sandwich Education in Old Anambra State” Nigerian Education at Crossroads (ed) R. O. Okoye and H.O.N. Bosah, Onitsha; Hybrid Publishers Ltd and Anambra State College of Education Awka, pp. 12 - 17. |
| [6] | Mullens, J. E (1993) “The Relationship between Teacher Qualifications and Students’ Learning: A Study of Standard One Classrooms in Belize, Central America” Unpublished EDD Thesis, Harvard University USA. Dissertation Abstracts on CD Rom. Order No AAC 9326318. |
| [7] | Oladejo, J. (1991) “The teacher factor in the effective teaching and learning of ESL in developing English speaking countries: The case of Nigeria.” Journal of Multilingual and Multicultural Development 12 (3) 195-202. |
| [8] | Akinleye G. A. (2001) "Early childhood education: Guide for parents and teachers': UNAD Journal of Educlltion, 2 (1) October, 45. |
| [9] | Commeyras, M. (2003) “Promoting a culture of reading” The Comet Thursday, February 13; 31-32. |
| [10] | Waiching, E. M. (1994) “Reflecting on reflections: A case study of experienced and inexperienced ESL teachers” System 22 (1) Pergamon Elsevier Science Ltd. 93. |
| [11] | Dunkin, M. J. (1997). Assessing teachers' effectiveness.Issues in educational research, 7(1), 37-51. http://education.curtin.edu.au/iier/iier7/dunkin.html |
| [12] | Beehr, T. A. (1996). Basic organizational psychology, London: Allyn and Bacon Publishers.51-74 |
| [13] | McCabe, D. (2001). CAI Research, The center for academic integrity. http://www.academicintegrity.org/cai_research.asp.] |
| [14] | Glasner, J. (2002). “Where cheaters often prosper” Wired news. Aug 26, 2002.[Retrieved online November 19, 2002 from: http://www.wired.com/news/school/0,1383,54571,00.html.] |
| [15] | Obi, E. (2004). Educational management theory and practice. Enugu: Jamoe Enterprises Nigeria.34-75 |
| [16] | Chandon, J. S. (2000). Management theory and practice. New dehli: Vikas Publishing PVT Ltd. 34-62. |
| [17] | Uyo, A. (2004) “Examination malpractice rocks Zamfara” Lagos: Punch Education, The Punch, 17 (19,166) September 10; 41. |
| [18] | Ajayi, E. M. (2005): “Students performance in integrated science as a predictor of achievement in senior secondary school science subjects in Ekiti State, Nigeria.” Unpublished ME.d Thesis University of Ado Ekiti, Nigeria. 51-56 |
| [19] | Olorunsola, E. O. (2010) “Job satisfaction and performance of administrative staff in South West Nigeria universities” Unpublished Ph.D Thesis University of Ado Ekiti, Nigeria. 122-128 |
| [20] | Adeyemi, T. O. (2008). “Organizational climate and teachers’ job performance in primary schools in Ondo State, Nigeria: an analytical survey” Asian Journal of Information Technology 7 (4); 138 – 145. |
| [21] | Jones, M. (1997) “Trained and Untrained Secondary School Teachers in Barbados : Is There a Difference in Classroom Performance?” Educational Research. 39 (2); 182-183. |
| [22] | Ige, J. A. (2001) “Teacher data in secondary schools in Ekiti State” Speech delivered by the Permanent Secretary at the Senior Staff seminar, Ministry of Education, Ado-Ekiti 5-9 |
| [23] | Olubor, R.O (2004): “A Comparative Analysis of the Internal Efficiency of Public Junior Secondary Education of Two Selected States in Nigeria.” Journal of Educational Foundations and Managements (JEFAM), University of Ado Ekiti, Nigeria 4 (1) 194-196. |
| [24] | Nwadian, M. (1998) “Management in education” in Mon Nwadiani (Ed) Educational Management for sub-Sahara Africa Benin-City: Nigerian Society for Educational Planning (NSEP) in Association with Monose Amalgamates.21-46. |
| [25] | Adeyemi, T. O. (1998) “School and teacher variables associated with the performance of students in the senior secondary certificate examinations in Ondo State Nigeria” Unpublished PhD Thesis, University of Hull, England, United Kingdom; 16-18. |
| [26] | Ekundayo, H.T. (2007) “A Comparative Analysis of Private Cost of Higher Education in Ekiti State, Nigeria.” Journal of Educational Foundations and Managements (JEFAM), University of Ado Ekiti, Nigeria 4 (1) 12-18 |
| [27] | Adu, E.T. (2010): “School-based variables and internal efficiency of colleges of education in Nigeria” Unpublished PhD Thesis, University of Ado Ekiti, Nigeria.125-147. |
| [28] | Afolabi, R.A. (2006): “Relationship Between School Facilities and Internal Efficiency of Public and Private Secondary Schools in Ogbomoso Metropolis of Oyo State.” Unpublished M. Ed thesis. Unilorin. 85-106. |
| [29] | Aghenta, J.A.(2000). “Educational planning in the 21st century” in J.O. Fadipe, & E.E. Oluchukwu (ed) Educational planning and administration in Nigeria in the 21st Century. Ondo: National Institute for Educational Planning and Administration 2 -6. |
| [30] | Akintayo M. O (1991) Economics of Adult Education, Community development and social Welfare Ibadan: Centre for External degree Department of Adult Education, University of Ibadan 5- 87. |
| [31] | Mullins, L. J. (2005): Management and organizational behaviour (7th edition), New Jersey Prentice Hall. 52-85 |
| [32] | Ekiti State Nigeria, (1996) “Government approved teacher quota in schools” Ado Ekiti: Ministry of Education. Planning, Research and Statistic Department. 2-6. |
| [33] | Babalola, O.T. (2005) An investigation into the internal efficiency of Ekiti State Secondary Schools. Unpublished Med Thesis, Faculty of Education, University of Ado Ekiti, Nigeria 42-52 |
| [34] | Gay, L. R (1996) Educational research: competencies for analysis and application; Upper Saddle River, New Jersey: Merrill, Prentice-Hall Inc, 249-250. |
| [35] | Oppenheim, A N. (1992) Questionnaire design, interviewing and attitude measurement; London & New York: Pinter Publishers, 70 -72. |
| [36] | Akinwumiju, J.A. & Patwari, A.S. (1990) Statistical Analysis of population Data for Educational Planning in Nigeria. Faculty of Education, University of Ibadan, Nigeria 10-24. |
| [37] | Abaji, O. & Odipo, G. (2000) “Efficiency of primary education in Kenya: Situational analysis and implication for educational reform.” Paper presented at the Institute of policy analysis and research No. 004/97; 2-10. |
| [38] | Norusis, M J / SPSS Inc. (1993) SPSS® For Windows Base System User’s Guide Release 6.0. Chicago: SPSS Incorporated 337-338. |
| [39] | Moore, J. L. (1994) Research methods and data analysis Hull: Institute of Education, University of Hull UK. October; 9-11. |
| [40] | Ayodele J.B. (2000): School Size, Class Size and Teacher’s Quality as Correlates of Internal Efficiency in Primary Schools in Ondo State, Nigeria. Unpublished Ph. D. Thesis, University of Ibadan. 22-23 |