-
Paper Information
- Next Paper
- Paper Submission
-
Journal Information
- About This Journal
- Editorial Board
- Current Issue
- Archive
- Author Guidelines
- Contact Us
American Journal of Economics
p-ISSN: 2166-4951 e-ISSN: 2166-496X
2012; 2(3): 26-32
doi: 10.5923/j.economics.20120203.01
Risk Attitude and Insurance: A Causal Analysis
 Abstract
 Reference
 Full-Text PDF
 Full-Text HTML
Chinwendu Amaefula 1, Chukwukere Austin Okezie 2, Remigus Mejeha 1
1Department of Agricultural Economics, Michael Okpara University of Agriculture, Umudike, P.M.B 7267, Umuahia, Nigeria
2School of Social Sciences, Universiti Sains Malaysia Pulau Pinang, 11800, Malaysia
Correspondence to: Chukwukere Austin Okezie , School of Social Sciences, Universiti Sains Malaysia Pulau Pinang, 11800, Malaysia.
| Email: |  |
Copyright © 2012 Scientific & Academic Publishing. All Rights Reserved.
Decisions regarding insurance depend crucially on the extent to which individuals are willing to bear risk. Farmer’s decision of whether or not to participate in insurance is likely to be influenced by comparison of expected net gain (or loss) with or without insurance. The attitudes of farmers to risk were assessed using Likert scale. The results show that farmers were aware of the benefits of agricultural insurance and were positively disposed to it. However, majority were against using insurance as a prerequisite for extension of credit lines. This study uses Safety First principle to investigate the impact of insurance on risk attitude of farmers.The result show the overall mean to be 2.47 implying that the farmers were intermediate risk takers. The risk attitude coefficient showed that 20.6 percent were low risk-averse, 40.2 percent intermediate risk-takers and 39.2 percent showed high risk-aversion. The influence of socio-economic factors revealed that age, education, experience and stock size were significant and positive determinants of risk attitude. Access to agricultural insurance impacted positively on the attitude of farmers to production risk. The Chow test confirmed differences in risk attitude between farmers with insurance and farmers without insurance.
Keywords: Risk, Attitude, Insurance, Impact, Chow-Test
Article Outline
1. Introduction
- Agro-business is risky compared to other businesses. Farmers, like most other people, also place greater weight on potential negative outcomes of risk and they are generally willing to sacrifice potential income to avoid either risk or uncertainty (Ghadim and Pannell 2003; Marra, et al. 2003; Dewan, 2011; Picazo-Tadeo and Wall 2011).Peasant farmers are naturally keen to avoid taking risk which might threaten their livelihoods. This behaviour influences the levels and types of inputs they use and the aggregate levels of output produced. The vicious circle of poverty takes many forms but one key element in many versions of the spiral, in many environments is risk aversion. If poor people are risk-averse to the extent that they are unwilling to invest in the acquisition of modern inputs because that involves risks, they will remain poor (Mosley and Verschoor, 2003). Agricultural production is subject to risk and the attitudes of producers toward risk will influence input choices insofar as these affect production risk (Picazo-Tadeo and Wall 2011). The characteristic time-lag in agricultural production activities inhibits accurate prediction of expected output and their prices, thus increasing the concern of risks and uncertainty. In other enterprises, economics of scale may be achieved without much distortion. In agriculture, however, linear extrapolation cannot be used to predict eventual outcome.Agricultural insurance is seen as one of the best strategies to address farm risks and encourage farmers to embrace modern production practices with greater potential for better and quality yields (Wenner, 2005). In Nigeria, the Government introduced agricultural insurance programme with the tripartite aim of broadening farmers’ access to farm resources, positively changing farmers’ attitude to risk in their choice of resource use and to achieve increased food supplies in the market(Olubiyo, et al. 2009). Different factors can be identified that influence farmers’ behaviour especially making decisions that relate to farm production, vis-à-vis choice of enterprise, its combination, the type and level of resources used in a given farming season.A large number of poultry farmers in Nigeria produce under conditions that are exposed to the vagaries of nature and limited infrastructure like storage facilities and power (Onuorah, 2008). The importance of the poultry industry in Nigeria has been demonstrated by the number of researches conducted. The risky nature of the enterprise was worsoned by the outbreak of HPAI in 2006. Studies have evaluated behaviour or attitude to risk and responses of poultry farmers to risk and agricultural insurance (Aye and Oji, 2007; Ajemtomobi and Binuomole, 2006; Olubiyo et al 2009; Ajieh,2010). But to the best of our knowledge none has tried to quantitatively isolate the impact of insurance the risk attitude of farmers. Therefore, the study is an effort to quantitatively isolate the impact of insurance on the risk attitude using a sample of poultry farmers.
2. Methodology
2.1. Study Area
- Abia State is one of the 36 states of the Federation of Nigeria. The State comprises of three agricultural zones namely, Aba, Umuahia and Ohafia split into seventeen Local Government Areas. The State is located between longitude 7010’ and 800’ East and latitude 40 40’ and 60 41 North of the equator. Abia State occupies a land area of about 5834 square kilometer which is approximately 5.8% of the total land area of Nigeria and is rank 32nd out of the 36 States in terms of land area (Abia Mirrow 2006). It has a population of about 2,833,999 persons according to NPC (2006) and is rank 15th in population size in Nigeria. Its population density is about 2 persons per square kilometer of land, though this density has been increased by ecological degradation.
2.2. Sampling Techniques
- The study adopted systematic sampling procedure to select respondents. The Resident Extension officers within the localities assisted in drawing the sampling frame from which the selections were made. To ensure wide coverage and ensure that farmers within the same homogenous and contiguous area where selected, the study adopted the Agricultural Development programme (ADP) delineation of communities into blocks and circles. These ensured they operate under similar environmental factors and have related characteristics to an extent. In all a total of 97 smallholder poultry farmers were enlisted for the study.
2.3. Data Collection
- The study adopted systematic sampling procedure to select respondents. The Resident Extension officers within the localities assisted in drawing the sampling frame from which the selections were made. To ensure wide coverage and ensure that farmers within the same homogenous and contiguous area where selected, the study adopted the Agricultural Development programme (ADP) delineation of communities into blocks and circles. These ensured they operate under similar environmental factors and have related characteristics to an extent. In all a total of 97 smallholder poultry farmers were enlisted for the study.
2.4. Data Analysis
- Data analysis involved the use of inferential statistics such as means, tables, frequencies and measures of deviation. Econometric techniques adopted involved the estimation of equations based on the ordinary least squares techniques.
2.4.1. Assessment of Attitude to Insurance
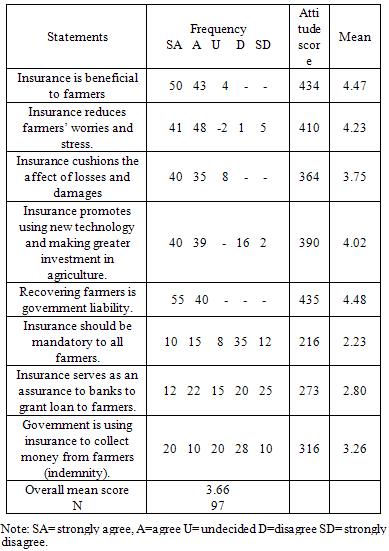
- Likert-type of scale was used in the analysis of farmers’ attitude to agricultural insurance. The scale falls under the criterion-group instrument whereby items are collected and analyzed against a criterion. In this the farmers’ attitude are determined by requesting them to respond to some attitudinal statements. Each statement has weights attached to it or scores attached to it. Weights and scores are usually assigned so that high scores indicate favourable attitudes. The responses were weighted on a 5-point likert- type scale of strongly disagree = 1; disagree = 2; undecided = 3; agree = 4 and strongly agree = 5. The mean of the weighted value was taken as a cut-off point, such that statements with values above the mean are regarded as implying a positive attitude while mean scores below the weighted value were regarded as unfavourable, implying a negative attitude.
2.4.2. Estimation of Risk Attitude
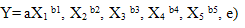
- The Safety-First Principle of determining risk attitude coefficient, proposed by Kataoka (1963), modified by Moscardi and de Janvry (1977), used in Nzenwa (2005); Ajetomobi and Binuomote, (2006) and Olaniyi et al, (2007). This principle assumes that the individual’s objective is to minimize the probability of experiencing variability (a shortfall) in output or income below a certain initial level, (specified levels of disaster). The method involves the use of ordinary least squares (OLS) techniques. In this case, the generalized power function is estimated because of its wide use in production function analysis and the yield of consistent estimates. The implicit function is stated below:
 | (1) |
 | (2) |
 | (3) |
 | (4) |
 | (5) |
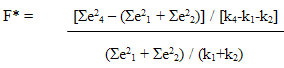 | (6) |
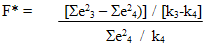 | (7) |
3. Results and Discussion
3.1. Attitude towards Insurance
- Farmers responses with respect to insurance were evaluated on the five-point Likert scale and the results are presented in table 1.
|
3.2. Determination of Risk Attitude Coefficient
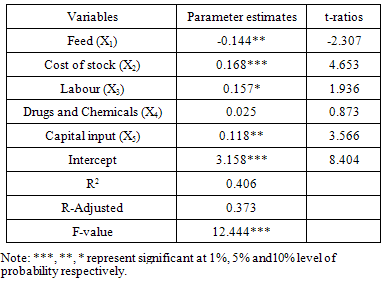
- The Safety – First Principle was used in the determination of the risk attitude parameter of poultry farmers in the study area. This principle assumes that the individual’s objective is to minimize the probability of experiencing variability (a shortfall) in output or income below a certain initial level, (specified levels of disaster). Assuming that the first principle holds, the degree of risk aversion manifested by an individual farmer is derived from an observed behavior because given a production technology and the risk associated with production and market condition. The observed level of factor use reveals the underlying degree of risk aversion. This method involves first, the estimation of the production function in which the direct relationship between input vector (X) and output (Y) is established. Then the most significant input variable from the estimated function is determined by considering the R2-values, signs and magnitudes of significant variables, coefficients of significant variables, including conformation of variables to a priori expectations. From our results, the cost of stock with a coefficient of 0.168 appeared as the most significant input of the production process in the study area. The estimated function is shown in table 2
|
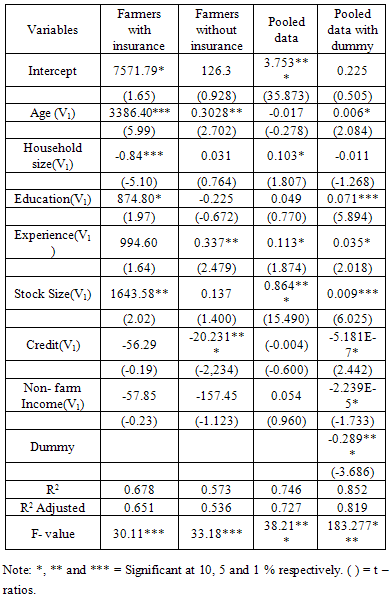
3.3. Influence of Socioeconomics factors on Risk Attitude
- Estimation using the Safety-first principle permits us to obtain consistent estimates of the risk-aversion coefficients for each producer. This enables us to ascertain the influence of farmer socio-economic characteristics on risk attitude. While our main objective is to isolate the impact of agricultural insurance on the risk attitude of farmers, it is equally important to examine the effect of other factors that the farmer is exposed to in the production process. Therefore our analysis included seven other variables considered important in ascertaining the risk attitude of the farmer. The results of the four models estimated are presented in table 4All the models had a relatively high explanatory power showing that most of the socio-economic variables that influence the risk attitude of the farmers had been captured by the models. The model for farmers without insurance had the lowest explanatory power (54 percent) while the pooled data with intercept dummy had high explanatory power of 82 percent when considering the R2 adjusted value. The models estimated were true reflection of the equations as all the models had F-values that were highly significant (99 percent). It is assumed ceteri paribus that older farmers tend to be less prone to take risks than younger ones.While some studies have found that risk aversion increases with age (e.g., ; ), others have not found a significant effect for this variable (e.g., ; ). However, this study confirmed a priori expectation that older farmers are more risk-averse as the age variable in all the models except for pooled data had positive statistical coefficients. The positive coefficient implies increasing risk-aversion as the farmer gets older.
|
3.4. Isolating the Impact of Agricultural Insurance on Risk Attitude
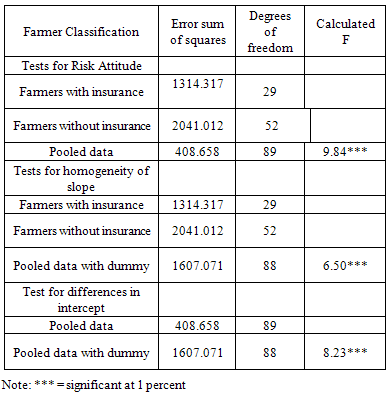
- The Chow test examines the equality of parameters between two subgroups (Hardy, 1993). The null hypothesis is that the parameters are equal, meaning that all the independent variables have uniform effects for both subgroups. Here, insurance is postulated to have no influence on risk attitude of farmers. The results of the statistical tests for structural shift in the risk attitude function and differences in structural parameters were presented in Table 5. The calculated chow’s F statistic for effect of insurance on risk attitude was significant at 1 percent. The result confirms that there is significant difference between the risk attitude of farmers with insurance and those without insurance. Hence, we reject the null hypothesis of no difference.
|
4. Conclusions
- This study investigated the the impact of agricultural insurance on risk attitude among farmers.The respondent farmers consisted of farmers participating in agricultural insurance and others without insurance. Structured questionnaires were used in data collection and data analysed using inferential statistics. First the attitude to risk of farmers were assessed using likert scale, The results show that farmers were aware of the benefits of agricultural insurance and were positively disposed to it. However, majority were against using insurance as a prerequisite for extension of credit lines. The Safety-first principle adopted in estimating the risk attitude coefficient of farmers show the overall mean to be 2.47 implying that the farmers were intermediate risk takers. However, on the basis of the analysis 20.6 percent of the respondents were classified as low risk-averse, 40.2 percent intermediate risk-takers and 39.2 percent showed high risk-aversion. The influence of socio-economic factors revealed that age, education, experience and stock size were significant and positive determinants of risk attitude. In other words these factors increased farmers’ risk-aversion. On the other hand, household size, stock size and non farm income were significant and negative, increasing farmers risk preference. Availability of insurance increased farmers’ disposition to risk. The Chow test confirmed differences in risk attitude between farmers with insurance and farmers without insurance.
References
| [1] | A.A.Ghadim and D.J. Pannell, Risk attitudes and risk perceptions of crop producers in Western Australia. In Risk management and the environment: Agriculture in perspective, ed. B.A. Babcock, R.W. Fraser, and J.N. Lekakis, 114–33. Dordrecht: Kluwer Press, 2003. |
| [2] | M, Marra, D. J. Panell and A. A. Ghadim, “The economics of risk, uncertainty and learning in the adoption of new agricultural technologies: Where are we on the learning curve?” Agricultural Systems 75: 215–34, 2003. |
| [3] | A.A. Dewan, “Farmers’ motivations, risk perceptions and risk management strategies in a developing economy: Bangladesh experience”. Journal of Risk Research, vol. 14. Issue 3, pp. 325- 349. DOI: 10.1080/13669877.2010.541558, 2011. |
| [4] | A. J. Picazo-Tadeo and A. Wall, A. “Production risk, risk aversion and the determination of risk attitudes among Spanish rice producers”. Agricultural Economics, 42: 451–464. DOI: 10.1111/j.1574-0862.2011.00537.x 2011. |
| [5] | P. Mosley and A. Verschoor, Risk Attitudes in the Vicious Circle of Poverty University of Sheffield. Pp 2-26 unpublished, 2003. |
| [6] | M. Wenner, 2005, Agricultural Insurance Revisited: New Development and Perspective in Latin America and the Caribbean, World Bank, Washington DC, 2005; 1-77 |
| [7] | S.O.I Olubiyo, G.P. Hill and J.P.G Webster “Econometric analysis of the impact of agricultural Insurance on farming systems in the middle belt, Nigeria”. African Journal of Food Agriculture Nutrition and Development. Vol. 9 No. 6, September, 2009. |
| [8] | E.H. Onuorah, Analysis of environmental Risk factors affecting rice farming in Ebonyi State Nigeria. M.Sc thesis University of Nigeria Nsukka, 2008. |
| [9] | G.C. Aye and K.O. Oji, “Effect of Poverty on Risk Attitude of farmers in Benue State, Nigeria”. Paper presented in the 12th Annual Conference on Econometric Modelling for Africa 2007, Cape Town.http://www.africametrics.org/documents/conference/07 |
| [10] | J.O Ajetomobi and S.O. Binuomote, “Risk Aversion among Poultry Egg Producer in Southwestern Nigeria”. International Journal of poultry science.Vol.5 (60): Pp 562-565, 2006. |
| [11] | P.C. Ajieh, “Poultry Farmers’ Response to Agricultural Isurance in Nigeria”. Journal of Agricultural Sciences 1(1): 43-47, 2010. |
| [12] | Abia Mirrow, “Abia State Quarterly Bulletin”. Government Press, Umuahia, Nigeria. Vol.10 (6): Pp 8-15, 2006. |
| [13] | National Population Commission (NPC) (2006). Nigeria Population Census Results, 2006. National Population Commission, Abuja. |
| [14] | S. Kataoka,” A Stochastic Programming modelEconometrica”. American Journal of Agricultural Economics Vol. 21. Pp 181-196, 1963. |
| [15] | E. Moscardi and A. de Janvry, “Attitude toward Risk among Peasants: An Econometric Application Approach”. American Journal of Agricultural Economics. Vol. 59: Pp710-721, 1977. |
| [16] | G.C. Nzenwa, “Effect of Poverty on Risk Attitudes of Farmers in Benue State, in Nigeria”. M.Sc thesis, University of Nigeria Nsukka, 2005. |
| [17] | O.A Olaniyi, O. Adesiyan and R.A. Ayoade, “Constraints to Utilization of Poultry Production Technology among Farmers in Oyo State, Nigeria”. Journal of Humanity and Ecology. Vol. 33: Pp118-127, 2008. |
| [18] | C.E. Onyenweaku, “Impact of Technological Change on Output, Income, Employment and Factor Shares in Rice Production in Southeastern Nigeria”. Issues in African Rural Development Monograph Series, Monograph #5, African Rural Social Sciences Research Networks, Winrock International, 1997. |
| [19] | J.A. Gómez-Limón, M. Arriaza and L. Riesgo, “An MCDM analysis of agricultural risk aversion”. European Journal of Operation Research. 151, 569–585, 2003. |
| [20] | A. Abdulkadri, M. Langemeier and A. Featherstone, “Estimating risk aversion coefficients for dryland wheat, irrigated corn and dairy producers in Kansas”. Applied. Economics, 35: 825–834, 2003. |
| [21] | O.E Ayinde, “Effect of Socio-Economic Factors on Risk Behaviour of Farming Household: An Empirical Evidence of Small–Scale Crop Producers in Kwara State”. Nigeria Agricultural Journal Vol. 3(6) Pp 447-453, 2008. |
| [22] | M.A. Hardy, Regression with dummy variables. Sage University Paper series on Quantitative Applications in the Social Sciences, 07-093. Newbury Park, CA: Sage, 1993, |