-
Paper Information
- Paper Submission
-
Journal Information
- About This Journal
- Editorial Board
- Current Issue
- Archive
- Author Guidelines
- Contact Us
American Journal of Economics
p-ISSN: 2166-4951 e-ISSN: 2166-496X
2012; 2(2): 8-15
doi:10.5923/j.economics.20120202.02
The Trends of Relationship Between Poverty and Economic Development in Uganda in the 21st Century
 Abstract
 Reference
 Full-Text PDF
 Full-text HTML
Kabir Haruna Danja
School of Economics and Applied Statistic Kampala International University, Uganda
Correspondence to: Kabir Haruna Danja, School of Economics and Applied Statistic Kampala International University, Uganda.
| Email: |  |
Copyright © 2012 Scientific & Academic Publishing. All Rights Reserved.
Poverty has made Uganda to attain an unenviable status such that no Government (no matter the level), Organization, Community, Clan or Family can survive effectively without introducing one kind of poverty reduction effort or the other. This problem is essentially not that of programme introduction but effectiveness of such programme and strategies so adapted in poverty reduction efforts. The paper focused on if there is a significant relationship between poverty and economic development in Uganda from 1990-2010. The paper utilized the survey approach to collect, collate, analyze and present data respectively and its findings out that; Poverty is multi-dimensional in nature and must be so treated in order to be effective, most government ministries and agencies activities are poverty reduction-based, poverty reduction programmes have not been effective and reasons for non-effectiveness were adduced. Based on the findings the paper concludes and recommends that; government, its agencies and other stakeholders should develop a multidimensional approach towards poverty reduction strategies and implement along that line, efforts should be made to effectively target the poor in all considerations and at all levels of articulation, implementation, monitoring and review; the government anti-corruption efforts should be stepped up and seriously up-held in dealing with matters concerning poverty reduction efforts.
Keywords: Trends, Relationship, Poverty and Economics Development
Cite this paper: Kabir Haruna Danja, The Trends of Relationship Between Poverty and Economic Development in Uganda in the 21st Century, American Journal of Economics, Vol. 2 No. 2, 2012, pp. 8-15. doi: 10.5923/j.economics.20120202.02.
1. Introduction
- Uganda, remains one of the World’s poorest country ranked 159th out of 175 poorest countries in the world as per the Human Development Index (1998),started its independence in 1962, poverty level of barely 69% of its population in 1998 less than $ 1 dollar a day and is today struggling to bring it down. It is current teeming population of about 33.1 million. Of the number of the poverty stricken people, the majority being in the rural areas where illiteracy prevalence is high, potable water and health facilities are rarely available, road and electricity infrastructures are either unavailable or ill-managed.Poverty is currently one of the most serious problems in the World. Recent estimates indicate that about 1.5 billion people live below the poverty line of Less than one dollar per day in the whole world. Out of the 1.5 billion people, Africa contributes about 250 million, which is about 17% of the world’s total Poor population. According to the United Nations Reports (1999), Uganda’s Human Poverty Index (HPI) was only 41.3%, which places the country among the 25 poorest Nations in the world. The HPI for some other African countries like Zimbabwe, Botswana, Kenya, Burkina Faso and Niger were 17%, 22.9%, 26.1%, 58.3% and 66.0% respectively. Additional data from the UHPI (2003) further indicate that life expectancy for Uganda was 45 years, literacy rate was 65% and 42.1% of the rural population do not have access to potable water, healthcare facilities and electricity. It has been known in Uganda that every government embarks on one form of poverty reduction strategy or the other. However, what has remained unanswered is the extent to which these programmes have impacted on the poor: the target population. It seems that the efforts of various governments are ineffective and therefore not much has been done to actualize the benefits. For poverty reduction agencies, their results do not seem to justify the huge financial allocations to them. Poor people’s perceptions of formal poverty reduction institutions are largely that of ineffectiveness and irrelevance in their lives as government poverty reduction activities contribute little in their struggles to survive and rarely help them to escape poverty.
2. Objective
- The general objective of this paper was to establish the relationship between poverty and HDI as measure of economic development in Uganda. The other specific objectives of the paper are;• To compile the poverty level figures in Uganda from 1990 to 2010.• To compile the economic development level figures from 1990 to 2010. • To establish the relationship between poverty and economic development from 1990 to 2010.Theoretical Frame workThe study was underpinned by the Kuznet's Curve theory to Simon Kuznet’s propounded in 1955. The Kuznet's theory attempt to explain that a country begins developing economically, its income inequality worsens. But after a few decades when the rich begin investing more in the economy and wealth begins to "trickle down," income equalizes and people are wealthier then they would have otherwise been.Review of Related Literature Concept of Poverty and Economic DevelopmentAccording to the World Bank(1993), poverty is hunger , lack of shelter , being sick and not being able to see a doctor ,inability to go to school ,not knowing how to read, not being able to speak properly . It is not having a job, and is fear for the future, and living one day at a time .It is losing a child to illness brought about by unclean water, and powerlessness, lack of representation and freedom. All such can help to give an introspect to the apparition – poverty.The World Bank (2000) utilized inductive approach to uncover dimension of poverty and therefore defined poverty using many indices. One of such definitions is that poverty is “the lack of what is necessary for material well-being especially food, but also housing, land, and other assets. In other words, poverty is the lack of multiple resources that leads to hunger and physical deprivation.”The government of Uganda defines poverty as having low income, limited human development and powerlessness (PEAP 2004/2004-2007/2008). Poverty trend at national level shows that in 1992, close to 56% of the population was below the poverty line compared to 51% in 1993/94, in 1994/95, and nearly 49% in 1995/96.This shows a relative decline in poverty levels in the four years(1992-1996).This consistent decline was also observed for rural Ugandans in1992 were 59.7% was below the poverty line as compared to56% in 1993/94,54.3% in1994/95,54% in 1996 49% in 1997/98,37% in 1999/2000 and 41% in 2002/3.However the proportion of people below the poverty line rose from 33.8% in 1999/2000 to 37.7 in 2002/3 which indicated an increase in poverty levels.Economic performance as well as the standard of living of the population is usually the general factors used as indicators of poverty. These factors combine measures of purchasing power or income or consumption with other social indices which show availability and access to education, healthcare delivery, basic infrastructure and other welfare facilities in order to define the incidence, intensity or severity and the distribution of poverty within a population.The World Bank's most commonly used method of measuring poverty is based on incomes or consumption levels. A person is considered poor if his or her consumption or income level falls below some minimum level necessary to meet basic needs. This minimum level is usually called the “poverty line.” This “…line” however varies across time and societies. Each country uses lines that are appropriate to its level of development, societal norms and values. The origin in the measurement is the utility function. The underlying assumption is that, an individual or house hold objective is to maximize utility given certain constraints, Welfare can be approximated using expenditure data. The expenditure variable consist of the sum of explicit expenditure on food produced and consumed by the house hold and the imputed use value of durable goods owned by the house hold (World bank 1993). The other measures of poverty are total household income, total house hold expenditure, per capita house hold expenditure, total income per adult equivalent, per capita food consumption and proportion of house hold budget spent on food.Economic DevelopmentEconomic development has been defined differently by different scholars. Schumpeter as cited by Jhingan (1998, 4), economic development is a discontinuous and a spontaneous change in the stationary state which forever alters and displaces the equilibrium state previously existing. Economic development is measured using the following four methods;Gross national product; it is measured in terms of an increase in the countries real national income over a long period of time.GDP per capita income; the second measure relates to the increases in the per capita income of the economy over a long period of time. Economists are one in defining economic development in terms of an increase per capita income or output. Meir defines economic development as “a process whereby real per capita income of a country increases over a long time period subject to stipulations that the number of people below an absolute poverty line does increase and the distribution of income does become more equal.Unfortunately Uganda’s proportion of the poor has doubled over the last two decades. Uganda’s endowment is in opposite direction with her poverty level. According to World Bank and UNDP 2001 statistics, its GNP per capita of US$280 is unenviable classified as the poorest nation in the world. Poverty is currently one of the most serious problems in the World. Recent estimates indicate that about 1.5 billion people live below the poverty line. Out of the 1.5 billion people, Africa contributes about 250 million, which is about 17% of the world’s total Poor population which places the country among the 25 poorest Nations in the whole world.Poverty and economic developmentIt is apparent that poverty is an outcome of economic, social and political processes that interact with and reinforce each other in ways that can worsen or ease the deprivation poor people face every day. While national economic development process is pivotal to effective poverty reduction, poverty is an outcome of more than economic process. Buttressing the role of economic development on poverty reduction, the World Bank in its World Development Report 2000/2001: Attacking Poverty P. 46-47 proffers that: “the stark differences in poverty outcomes between rich and poor countries point to the central role of economic development in poverty reduction.”Nations in sub-Saharan Africa, South Asia and Latin America are currently with the highest level of poverty and consequently with the lowest level of socio-economic development. They also have the highest level of social insecurity, violence, unrest and generally unacceptable low standard of living.The economic development of the nation and poverty could be viewed as two different sides of the same coin. An improvement in the economy, no doubt, will reduce the rate of poverty. On the other hand, the high incidence of poverty translates to denial of the much-required contributions to move the economy forward. Collapsing and uncompetitive industrial activities, rapid growth in unemployment, underemployment, unstable interest rate, high inflation rate, are just the features of the Ugandan environment that ought to be solved before the poverty alleviation strategies can effectively work.Related StudiesMehanna (2004), carried out a study on the relationships among various subsets of economic development, poverty, crime, and/or income inequality have been separately investigated in several theoretical and empirical studies. However, there has been very little empirical analysis on the interdependence among all these variables in one framework. This paper examines the relationship and causality between economic development and poverty. It employs a co-integration test, a 4-variable vector autoregressive (VAR) model, and a Granger test in the US over the period 1959–2001. Findings reveal a feedback loop mechanism between economic development, poverty, and crime. Interestingly, as measured by the Gini coefficient has no important impact on any of the variables.Mulira et al (2009) carried out a study on the panacea of precipitate “the entrepreneurship and poverty paradox “.The study sought to understand the entrepreneurial behaviour of categories of people that are described as poor by current World Bank standards. The study derived data from poverty and entrepreneurial surveys involving multi-stage random sampling from the central region of Uganda and from the Global Entrepreneurship Monitor (GEM) survey. Findings revealed that Men are more entrepreneurial than woman in most developing countries thus, this study was focused at the relationship between Entrepreneurship and poverty in central region of Uganda .This creates a knowledge gap and justifies the need for this study.Mulira et al (2009) carried out a study on the panacea of precipitate “the entrepreneurship categories of people that are described as poor by current World Bank standards. The study-derived data from poverty and entrepreneurial surveys involving multi-stage random sampling from the central region of Uganda and from the Global Entrepreneurship Monitor (GEM) survey. Findings revealed that Men are more entrepreneurial than woman in most developing countries thus; this study was focused at the relationship between Entrepreneurship and poverty in central region of Uganda. Francis et al (2002) carried out a study on determinants of regional poverty in Uganda. The study sought in-depth knowledge of the key factors that account for regional poverty differentials in Uganda so as to contribute to more focus targeting of programmes for the poor. Northern Uganda was found to be the poorest region; it has the largest depth of poverty and worst inequality. It is characterized by the poor having large mean household sizes, least education, least mean household income, least expenditure on health, lowest chance of child survival and highest concentration in the rural areas. This creates a knowledge gap and justifies the need for this study.Marion el al (2003) carried out a study on Livelihood Assets and Chronic Poverty in Uganda. This study also sought to understand the poverty – environment relationship in an urbanized setting. Generally, poor sanitation is a key characteristic of this community although this varies with well being. The rich own houses with inbuilt proper sanitation facilities, can afford medical expenses, don’t sell property to meet education costs of their children, contribute to funeral events and have job security while the poor are asset-less, have no sanitation facilities, mostly idlers and commit petty crimes, and sleep in bars. On the whole, poor waste management sanitation as threats to health. The study concludes that poverty is a major cause and consequence of environment degradation, poor health and low productivity.Data Presentation and AnalysisThe relationship between poverty and economic development was analysed using the following equation: Y=a+ bx +c x2+ εWhere;y = dependent variable.x = the independent variable and a, b, c are parameters to be estimated While ε is the error term. The formula was designed to suit the data after a scatter diagram.Poverty levels in UgandaPoverty trend at national level shows that in 1992, close to 56% of the population was below the poverty line compared to 51% in 1993/94, in 1994/95, and nearly 49% in 1995/96.This shows a relative decline in poverty levels in the four years(1992-1996).This consistent decline was also observed for rural Ugandans in1992 were 59.7% was below the poverty line as compared to56% in 1993/94,54.3% in1994/95,54% in 1996 49% in 1997/98,37% in 1999/2000 and 41% in 2002/3.However the proportion of people below the poverty line rose from 33.8% in 1999/2000 to 37.7 in 2002/3 which indicated an increase in poverty levels. The proportion of poor people below the poverty line declined rapidly from 56 percent of the population in 1992/93 to 44 percent in 1997. Implementation of the Government Poverty Eradication Action Plan since 1997 resulted in a further decline in national poverty to 35 percent in 2000. However, despite the remarkable achievements, it is only Northern Uganda that has experienced increasing poverty from 60 percent in 1997 to 66 percent in 2000 which raises a number of policy questions that need to be addressed.It is observed that from the early 90s the proportion of people below the poverty line was high and this has kept on falling in the subsequent years.This is explained by the numerous efforts that have been extended in the fight against poverty in Uganda in the last decades. Poverty alleviation fund (PAF) was launched in 1994 to set a precedent for special funds aimed at poverty reduction located outside the red tape constraint of normal government programmes. The main objective of the fund was to reduce poverty among the vulnerable grounds that were identified as the orphans, youth and disabled, demobilized soldiers, elderly, and retrenched civil servants.Another objective of establishing PAF was to direct funds from the Highly Indebted Poor countries (HIPC), debt relief initiative and other resources mobilized from donors to the financing of projects which have a strong impact on poverty reduction .A total of USHS 83 billion was raised by 2000 under PAF. This was an important move towards poverty reduction since high debts also contribute to the persistence of poverty in the country. The major deficiency of this program was that it failed to address the poorest of the poor. The Entandikwa credit scheme (ECS) was established in 1995 to provide a truck route for special poverty alleviation and reduction. The general aim of the scheme was to extend credit facilities to Uganda’s rural population with an aim of improving their investment capacity .However, the scheme also failed because in order to benefit from the Entandikwa fund one had to be with an investment project running proficiently, which meant that majority of the people particularly the very poor were left out.A national policy, poverty eradication action plan (PEAP) was launched in 1997 to provide a frame work to guide public action to eradicate poverty by 2017.The policy frame work consists of measure to improve the quality of life of the poor and to increase their income. Under the plan Uganda’s rural areas were to be opened up to the rest of country through an adequate and reliable road net work. The plan also entails the modernization of agriculture a sector that employs most Ugandans poor.In 2006 the government launched a new strategy in which it’s effort are geared via micro finance instititutions. This new strategy under the slogan “Bonna Bagaggaware” places higher priority on reducing income poverty by availing the rural poor starting capital at a very low interest rate. In this strategy, the government aims at ensuring that every household in the country is capable of raising enough income to meet the basic necessities of life. In the 2006/2007 national budget a total of nine billion Uganda shillings were allocated to the ministry of microfinance to commence this plan.In spite of all efforts to reduce poverty, the poorest 220% to 30% of Ugandans have benefited the least and have instead become poorer.The level of economic development in UgandaThe summary of Pearson correlation of the research hypothesis about the relationship between poverty and economic development in Uganda from the year 1990-2010 shows that the level of economic development being determined and therefore weighed under the Human Development Index in Uganda from the year 1990 to 2010. Since the magnitude of human development is greatly anchored on the level of poverty in an entity, the trend in human development has been protruding as poverty levels have been downsizing within the country.In 2003, Uganda’s HDI was 0.4888; an improvement from 0.449 in 2002. There has been improvement in people’s education. More than two thirds (68%) of the population aged 10 years and above in 2002 were literate, that is, could write or read with understanding in any language. This was an increase from the 54% observed in 1991.However, wide sex disparities still exist in the literacy rates with 76% of the males being literate compared to 61% of the females. Despite the high levels of literacy in absolute terms, more than 5 million Ugandans aged 10 years and above were illiterate. Northern Uganda’s literacy levels are lower than the rest of the country. HDI and poverty were correlated. A table of results below was obtained and under this objective a null hypothesis that there is no relationship between poverty and HDI as a measure economic development in Uganda was tested.The results in Table 7 indicate that human development index does not have a significant correlation with poverty in Uganda from 1990 to 2010 (sig. >0.05). Results also indicate that human development index is positively correlated with poverty levels in Uganda from 1990 to 2010 (r-value>0). This implies that an increase in human development index leads to an increase in poverty as per this study.
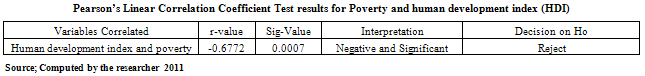
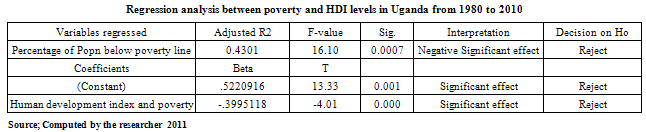 Human development index was regressed against poverty to find the effect of HDI on poverty. From table 8, the (sig) value is 0.0007 <4.38and the t value is 13.33 > 1.725 the critical value.The linear regression results in Table above indicate human development index does not have a significant effect on poverty. (F=16.10, sig. =0.0007> 0.05). The results indicate that human development account for -39.9% of the variation poverty. (Adjusted R2 =0.4301). The coefficients section of this table indicates the extent to which the explanatory variable (human development index explains the explained variable poverty) and this is indicated by Beta values. From table 8, if the explanatory variable which is human development index increased by one unit it implies that the explained variable which is poverty increases by 3.9995118.Table 8 above shows the correlation between poverty and economic development whereby the r-value was -0.68 indicating that there was negative correlation between poverty and economic development justifying that as poverty falls, economic development increases. On the other hand, when poverty hikes, economic development will be subjected to a plummet. We therefore infer by rejecting the null hypothesis and admit the supposition that poverty and economic development are significantly related in which case the relationship is inverse.
3. Findings and Conclusions
- Analysis made in the preceding section showed a tremendous decline in the percentage of people living under the poverty line and a protruding development level implied by an increment in HDI levels. What is important to note however, is the fact that such levels of development are still sluggishing.The Human Development Index (HDI) of 0.449 pertinently that was observed in the preceding sections of this paper indicate the deplorable state of Uganda’s level of poverty and low human development. World Bank report through United Nations Development Programme (UNDP, 2002) Uganda’s endowment is in opposite direction with her poverty level. According to 2001 statistics, its GNP per capita of US$280 is unenviable classified as the poorest nation in the world. Poverty is currently one of the most serious problems in the World. Recent estimates indicate that about 1.5 billion people live below the poverty line. Out of the 1.5 billion people, Africa contributes about 250 million, which is about 17% of the world’s total Poor population. In our preceding analysis, correlation between poverty levels and human development implied by the HDI were run and this came out with to be a negative co-efficient (i.e. -0.68) affirming that if development is to be witnessed, then the phantom of poverty has to be reduced. With this, it implied that there is an inverse relationship between poverty and human development.The finds out that government white paper on education stipulates that all households will bear the full cost of education at higher levels; for poor households that cannot meet the education cost, a loan scheme, payable on completion and attainment of gainful employment, is proposed (However, this has a lot of implications for the poor. For instance, the definition of gainful employment is vague. Currently, government is the main employer in Uganda and the fixed minimum wages are low. This implies that a graduate from a poor household will take several years servicing the debt, and during that time will not be able to help other members of the household. Given that this is a loan scheme, if interest is put on it, then the amounts may be compounded to unbearable levels. Such a scenario may perpetuate poverty.According to the review of the social sector recurrent expenditure transfer figures for 1997/98, Northern region, which is the poorest, was allocated 20.8%. This allocation is insufficient if the region is to come out of poverty.
4. Conclusions
- According to the World Bank (1990), the burden of poverty is spread evenly among regions of the developing world, among countries within those regions and among localities within those countries. Nearly half of the world's poor live in south Asia, a region that accounts for about 30% of the world's population. People in sub-Saharan Africa, along with those in south Asia, are among the poorest in the world, both in real incomes and in access to social services.Poverty in Uganda is attributed to the imbalance between population and resources. Population pressure, decreasing acreage of farmland holdings, deteriorating soil fertility, declining stocks of animals, and cultural attitudes and practices have all combined to create a new situation of poverty as well as entrenching a process of impoverishment. Uganda is one of the poorest countries in the world. The trends in aggregate per capita growth rates indicate not only that Ugandans are poor but that poverty has increased over the last 20 years, leaving the population increasingly vulnerable and deprived. Average per capita income levels conceal the extent and depth of this poverty since Uganda suffers from a skewed distribution of income. At the macro level, however, Uganda has registered a positive macroeconomic performance ever since the adoption of the structural adjustment programmes (SAPs).GDP has been growing at about 5% per annum and inflation has been under control and relatively stable at an average monthly rate of approximately 5% for the period March 1990–June 1994. The parallel market foreign exchange rate premium fell from over 100% in 1986 to less than 0.5% by December 1994, while the private sector investment– GDP ratio rose from about 1.02% in 1984 to 5.62% in 1994. Because of this gleaming macroeconomic performance, Uganda has become a model touted by the World Bank and IMF as one of the success stories of the SAPs. Yet despite the gleaming macro performance, the poverty situation at the micro level needs to be examined critically. World Bank (1993) estimated two relative poverty lines for Uganda, US$110 and US$55. The US$110 represents the minimum per capita income at which the poor can meet basic food needs and other non-food expenditures and the US$55 represents the minimum per capita income at which only basic food needs can be met. Furthermore, the report also stated that the north was the poorest region of Uganda and it greatly attributed this to civil war. But given that other regions, like the Luwero Triangle and Eastern Uganda, also experienced similar civil war; it became necessary to investigate other determinants of regional poverty. Authenticity of such remains at a stake since the world economy has been getting into swings which swings have had great impact on the African continents and the ramifications of such are on. All that is important to note is the fact that poverty remains a challenge to the Ugandan economy just like it is too many other parts of the developing world.Recommendations:Based on the study findings some recommendations were made below; • Generally, large households are poor and have limited access to health care services, there is need to increase provision of health care services, including family planning services, to the poor. • The study has found that the majority of poor households had low education and that the households with more education were less likely to be poor. This calls for improving access to education by the poor households. • It is also recommended that the resources allocated to the districts under decentralization arrangements should be used to give bursaries to poor children as opposed to a loan scheme. In addition, universal primary education should be extended to all children in a family instead of the current four. • There is need for government to allocate more resources from the savings made from higher education to cater for secondary education. • It is recommended that budgetary allocations be increased for poor regions to cater for social services. For effective poverty alleviation in Uganda, the planning process and the budgetary allocations should take into account the region-specific poverty lines. • Generally, poor households are more predominant in rural areas and engage mainly in agriculture with poor infrastructure. It is recommended that rural infrastructure be improved as this has potential benefits to enable poor households to come out of poverty. Improved rural infrastructure would link rural areas to the rest of the market, reduce transport costs and probably increase producer prices due to increased competition. Most poor households did not have access to credit, which has great potential to assist them out of poverty. It is recommended that a credit delivery mechanism targeting poor households be developed by government and non-government organizations.
Appendixes
- Appendix I
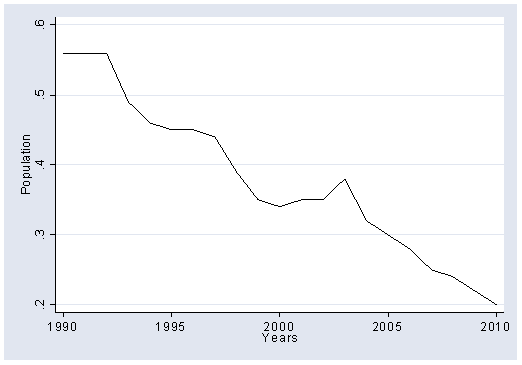 | A line graph showing percentage of people below the poverty line from 1990 to 2010 |
 | A line graph showing the level of economic development over time in Uganda from 1990 to 2010 |
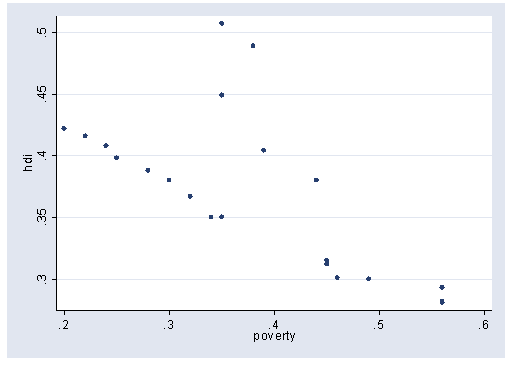 | Scatter diagram showing the relationship between povert and HDI (economic Development) |