-
Paper Information
- Next Paper
- Previous Paper
- Paper Submission
-
Journal Information
- About This Journal
- Editorial Board
- Current Issue
- Archive
- Author Guidelines
- Contact Us
American Journal of Economics
p-ISSN: 2166-4951 e-ISSN: 2166-496X
2012; 2(1): 37-46
doi:10.5923/j.economics.20120201.05
Economic Efficiency Analysis in Côte d’Ivoire
 Abstract
 Reference
 Full-Text PDF
 Full-text HTML
Wautabouna Ouattara
University of Cocody, Cote d'Ivoire
Correspondence to: Wautabouna Ouattara, University of Cocody, Cote d'Ivoire.
| Email: |  |
Copyright © 2012 Scientific & Academic Publishing. All Rights Reserved.
This study investigates the determinant factors of efficiency or inefficiency in Cote d’Ivoire. A stochastic analysis of production resulted in technical and allocative efficiency in economic efficiency levels. The findings of an investigation about 5,000 firms observed from 2000 to 2010 reveal that the Ivorian economy is not economically efficient as a consequence of the ensuing: socio-political instabilities; outside debt burden; unemployment rate; and weakness in savings on organizational productivity. Therefore, this study recommends a permanent mechanism of supervision for economic efficiency indicators; promotion of a factual and evocative employment policy for the youth; and the enforcement of granting financial aid to enterprises to assist them in having high added value to improve organizational productivity.
Keywords: Economic Efficiency, Technical Efficiency, Allocative Efficiency, Productivity
Cite this paper: Wautabouna Ouattara, Economic Efficiency Analysis in Côte d’Ivoire, American Journal of Economics, Vol. 2 No. 1, 2012, pp. 37-46. doi: 10.5923/j.economics.20120201.05.
Article Outline
1. Introduction
- In this study, we intend to think about economic efficiency in Côte d’Ivoire. The notion of efficiency can be defined by dissociating what comes from technical origin from what is due to a bad choice, in terms of inputs combination, compared to the price of the inputs. According to Farrell (1957) the technical efficiency measure the way that a firm chooses the quantity of inputs that is used in the production process when the factors’ use propositions are given. The technical efficiency which evaluates the way the firm chooses the ratio of the different inputs compared to the market price that is supposed competitive. The economic efficiency is determined by the combination of the technical efficiency with the allocative efficiency. It refers to the concepts of productivity, performance, quality and profit on the one hand, and of the reduction of the total strength employed and of the costs on the other hand. The concept of economic efficiency will be associated to the criterion of value. Thus, any change inclined to increase the value is considered as an effective change and inefficient in the contrary.The objective of this article is to identify the explanatory factors of the economic efficiency or inefficiency in Côte d’Ivoire. In a specific way, we wish to analyze the production organization, to determine the contribution of the form of organization to the productivity, to study the impact of the institutional environment on the productivity and to identify the level of sectors performance. The answer to these questions will lead to the identification of sources and determinants of Ivorian economy efficiency or inefficiency.Since some years, the socio-political instability has brought about a disorganization of the production machinery and an irrational use of the production factors. Furthermore, this instability has brought about the loss of qualified manpower which immigrated towards others countries. So, we postulate in favor of the main hypothesis according to which this situation has got negative effects on the efficiency of the Ivorian economy. This study whose results can be used by the authorities to act on the sources of the inefficiency is a contribution to the improvement of the global efficiency of the economy.To evaluate this efficiency, we use the frontier production approach. We dispose an unbalanced panel data related to 5,000 observed enterprises from 2000 to 2010 and shared out in 15 activity sectors of the Ivorian economy production. As the estimation of the efficiency depends on the nature of the frontier (deterministic or stochastic), it seems important to test it. In the stochastic frontier, the individual efficiency is estimated by the conditional mathematical expectation because the individual efficiency is not directly identifiable.In consideration of previous works of Lesueur and Plane (1995, 1998) who analyzed the Ivorian firms technical efficiency, this study is, for us, the first application of the economic efficiency in Côte d’Ivoire, in the context of likelihood frontier estimation method.This article is presented as follow: the first section shows the methodological aspects and efficiency concepts and the second one shows the frontier model and the Ivorian relative data. As for the third one, it indicates the results of the analysis.
2. Concepts and Efficiency Evaluation Methods
- In this section, an outline of efficiency concepts in connection with the economic literature is presented. Then, efficiency estimation methods are recalled and an account related to the determinants of the efficiency is done.
2.1. Concepts of Efficiency
- The measure of the efficiency appeared in Koopmans’s (1951) who was interested in the production analysis and in Debreu (1951) who introduced resources utilization coefficient. In 1957, Farrell argued that the firm’s efficiency can be calculated empirically and he proposed, for the first time, an innovation method of efficiency frontier estimation from real situations of production observations.Following N’Gbo (1991) et Atkinson et Cornwell (1994) studies, we can consider that a production unit is effective technically if, from the inputs it possesses, it produces the maximum of possible outputs or if, to produce an outputs given quantity, it uses the smallest possible quantities of outputs. Briec, Comes and Kersten (2006) keep on by explaining that the technical efficiency degree measure of a production unit permits to surround if this last one can increase its production without consuming, at the same time, more resources, or reduce the use of at least one input by conserving at the same time, the same level of production.A definition of the allocative efficiency is in the article of Rodriguez-Alves, Tovar and Trujillo (2007). They consider that the allocative efficiency puts in relation the inputs utilizations by the enterprise according to the current prices on the market. The allocative efficiency is necessary if the firm maximizes its profits or minimizes its costs at a given level of production. These two hypotheses of behavior permit to define an optimum inputs combination and the allocative efficiency measure is got by comparing the minimum cost of outputs quantity production at the cost incurred effectively by the firm.The economic efficiency is measured by the global economic performance of the firm, that is, by its ability to make its operations profitable. Farrell (1951) defined the economic efficiency by the product of technical efficiency and the allocative efficiency. According to his example, it appears that a firm cannot be 100% efficient economically if it is not 100% efficient technically and at the same time 100% efficient allocativelly. The economic efficieny can be separated into two distinct criteria and is therefore only the resultat of those two measures. As it is shown by Coelli and al (1998), Amara and Robert (2000) or again Ajibefun et Daramola (2003), this definition seems to be accepted universally.
2.2. Efficiency Estimation Methods
- The frontier estimation methods can be classified according to the frontier planned form, according to the estimation technique used to get it and according to the nature and the supposed properties of the gap between the observed production and the optimal production. The classification according to the frontier form permits to distinguish between the parametric approaches and the nonparametric approaches. The parametric approach presents a function including explicit parameters (Cobb-Douglass, CES, Translog, etc.). Nuama (2006) indicates that the parametric approach is the one which presents a function including explicit parameters. In the case of a parametric function, many econometrical techniques and non econometrical ones permit to estimate the production or the cost frontiers parameters: the least squares method or the maximum likelihood method. The nonparametric frontiers have the particularity not to impose any pre-established form to the frontier (Murillo-Zamorano, 2004). The nonparametric approach is then used when the production process cannot be identified by a functional form. The convexity of the production is the only differentiation element of the non parametric approaches. It makes it possible to distinguish the convex nonparametric approach from that non convex. The former was used by Farrell in 1957 for the first time. The production frontier proposed by Farrell is linear and it imposes some constant outputs at the scale. Two methods (Data Envelopment Analysis and Free Disposal Hull) help to estimate the parametric approach of the production frontier. The first method consists in estimating a convex envelop while the second one permits to arrange the firms in a growing order, so as to estimate a frontier in the form of stairs. An application of the first method with some data related to the Ivoirian written press can be observed in Nuama (2002) study. The mathematical program planning helps to estimate the nonparametric approach frontiers. It is about some descriptive methods which use as support the linear program planning or the quadratic program planning (Leleu, 2006). The nature of the gaps between the observed production and the maximum production distinguishes the stochastic frontiers from the deterministic frontiers. In fact, if we suppose that the gaps are only explained by the inefficiency of the producer, we qualify the frontier of having a deterministic nature. If, on the contrary, we estimate that the gaps are explained at the same time by the inefficiency of the producer and by some random elements which do not depend on the producer, we say that the frontier has a stochastic nature (Kumbakar et Lovell, 2000).In short, a firm or sector efficiency can be measured through some parametric and nonparametric approaches which differ primarily by the assumptions concerning the residues. A production or a cost frontier will be parametric if we impose a deterministic functional form (Cobb-Douglass, Translog, etc.) of we suppose that any gap between the estimated function and the observations is considered as coming from the producer’s inefficiency, and stochastic if, the gaps are explained by both the producer’s inefficiency and some random elements which are not under the owner’s control. The parametric approaches impose a functional form that presuppose the frontier form, whereas the nonparametric approaches impose less structure to the frontier but they suppose the absence of random errors.
2.3. Efficiency Determinants
- The economic efficiency measure permits to identify the potential gains of profit in the studied sector. The resulting inefficiency can be explained by some factors such as the size of the exploitation, the age and the instruction level of the head of the exploitation, etc. From a political point of view, it is interesting to search the sources of the inefficiency and to identify the determinants. The authorities can act on the determinants thus identified to improve the global efficiency. The first habitual question asked is how to explain the differential of efficiency observed between the exploitations and/or between the sectors? For this purpose, many methods are used. There is the method in only one stage called production frontier with composed errors and with incorporated effects of inefficiency proposed by Battese and Coelli (1992). Another method also used to explain the inefficiencies has got two stages: first of all the inefficiencies are estimated from a parametric or nonparametric frontier then a regression of the scores of efficiency is done on the variable determinants. In general, this supposes that the variables explaining the efficiency are the ones related to the characteristics of the owners and the exploitations; they are different from the production factors. This hypothesis is introduced to avoid the bias included in the first stage, according to which the efficiency level is independent of those variables while in the second stage, they are considered as dependent. According to Murillo-Zamorano (2004), the methods give equivalent results. The advantage of this method is that in case of specification error in the second stage, the bias affects only the determinants estimated coefficients and not the frontiers coefficients. As Lovell (2000) asserts, this method can be used for the non parametric approach and for the parametric approach as well. The regression done in the second stage is possible thanks to the OLS method or a Tobit model to take into account the truncated characteristic (between 0 and 1) of the dependent variable (efficiency).
3. Frontier Model and Ivorian Firms Data
- This section concerns the presentation of the kept frontier model and the analysis of the scores of the economic efficiency. It ends with an analysis of the Ivorian firms data and some variables.
3.1. The Frontier Model
- We keep, in this study, the parametric approach of the stochastic production frontier. Actually, we suppose that the gaps are not only explained by the producer inefficiency. They are the result of both producer’s inefficiency and random elements which do not dependent on the producer.Following Meeusen and Van den Broeck (1977) and Lovell and Schmidt (1977) who proposed independently stochastic production frontier models, and N’Gbo (1994) who worked from data of unbalanced panel, we consider the following production frontier:
 | (1) |
 : est a vector (kxl) of the unknown technological parameters of the frontier; Ti: represents the number of observations of the ith firm; N: represents the numbers of firms;
  : is the habitual symmetrical error term. It represents the gap due to the risks which influence the production and which are not directly under the control of the manager and
  : is a term of non negative error representing the inefficiency and supposed unvarying within the time. The frontier (1) is stochastic in the sense where it combines the two terms of error
  et
et  . In the deterministic frontier, the term
  does not appear explicitly. This type of frontier doesn’t take into account the classical error term and ay gap compared to the production frontier is considered as due to the inefficiency.
 | (2) |
 | (3) |
 et
et  .If we consider the maximum likelihood method, following Aigner, Lovell et Schmidt (1977) and Balk (2003), we take a normal distribution for
  , that is to say that
  and a truncated central normal distribution on the left in zero for
  , that is to say
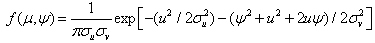
  . The joined density for v and u knowing that the two distributions are independent is the written like this:
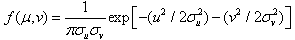 | (4) |
 | (5) |
 by integrating equation (5) compared to u. We have :
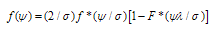 | (6) |
 is interesting; this parameter is considered as a measure of the relative variability of two sources of inefficiency.
  implies that
  and/or that
  , which means that the random shocks dominate in the explanation of the inefficiency. In the same way, when
  then the gaps to the frontier are essentially due to the technical inefficiency.If we consider the least squares method, model (2) can be written:
 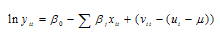 | (7) |
 | (8) |
 ;
;  . The estimation procedure of (8) can be done in two stages. On the one hand, as distribution of
  is symmetrical, we estimate (8) by ordinary least squares; all the
  will be unbiased. On the other hand, we completely identify the frontier by estimating
  and so
  . To do so, a particular distribution for each the terms of error must be specified. Thus, we can estimate
  by the moments method and then
 .We determine the economic efficiency from the estimation of a system of equations composed of a production function and of the first order conditions of the production cost minimization. This method developed by Schmidt et Lovell (1979) is applied by Ferriera et Steel (2007).
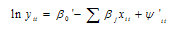
3.2. The Economic Efficiency Scores
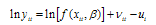
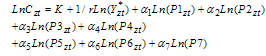
- The economic efficiency scores are not obtained by the product between the technical efficiency scores and those of allocative efficiency.In terms of profit, a firm efficiency can be estimated from the models of frontier used to measure the technical efficiency of the firms (Ali et Flinn, 1989). For a model in the logarithm form, the technical efficiency (ET) of the firm i is given by:
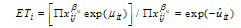 | (9) |
 | (10) |
 ) which is BLUP (Best linear unbiased predictor). After the estimation of the frontier (3), we obtain:
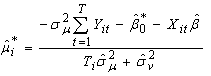 | (11) |
 | (12) |
 | (13) |
 | (14) |
 , with j varying from 2 to 7. After the resolution of these ratios, we can deduce the equations X2,…,X7 and substitute them in the frontier. Thus we obtain X1 as the level of production function Y, Cobb-Douglas production frontier and prices parameters. So we come to a dual cost function that equals to:
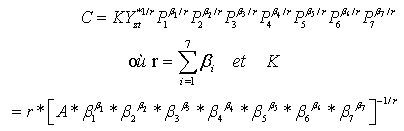 | (15) |
 | (16) |
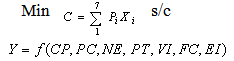
 The different Pi are characteristics of the production factors prices. The coefficients of K,
  are parameters obtained analytically and minimizing the function of cost under the constraint of the reached production level. For a given level of production, the economic efficiency is by definition the relation between the minimum cost and the observed cost. Following Albouchi, Bachta et Jacquet (2005), we note that the economic efficiency is :
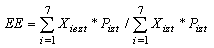 | (17) |
3.3. Analysis of Ivoirian Firms Data and the Variables
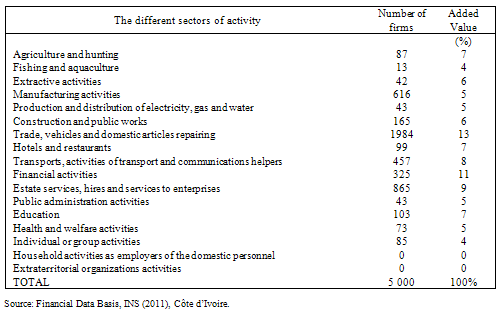
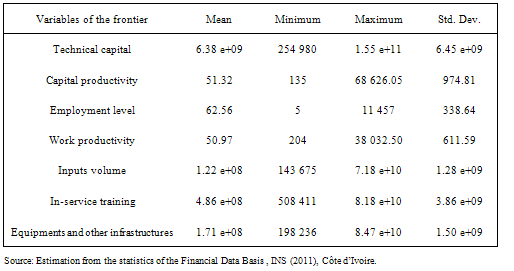
- We have at our disposal a data basis provided by Banque des Données Financières (BDF), an agency of Institut National de la Statistique (INS). The sample o the study concerns a total of 5,000 firms shared out in the 15 sectors of activity in the Ivorian economy in accordance with the Nomenclature of activities of states members of AFRISAT. These firms represent themselves alone about 63% of the national added value and 72% of the employment. The collected data concern the technical capital, the productivity of the capital, the level of employment, the productivity of work, the volume of inputs, the investments in the in-service training and the equipments and other infrastructures. They are observed on the period going from 2000 to 2010. It was difficult for us to get the recent data because they are not purged yet by the competent structure of INS.The table below indicates the covered sector representation of the variables of the frontier panel. The added value is implicitly taken into account in the calculation of the capital productivity and the work productivity.The total size of the used panel is 55,000 observations because 5,000 enterprises are observed over four years from 2000 to 2010. With regard to table n°1, a good representatively of sector « trade, vehicles and domestic articles repairing » is remarkable. It is the sector of activity that includes the greater number of firms. Then come, by order of representively, the sectors like « estate services, hires and services to enterprises » and « manufacturing activities ». The activity sectors where we can find fewer firms are the sector « household activities as employers of the domestic personnel » and the sector « extraterritorial organizations activities ». These sectors remain under-represented because of the non availability of the data. Yet, this example of sample has no incidence on the empirical results insofar as the estimations of the stochastic production frontier are carried out by sector. With the study of contributions percentages in terms of added values, we can observe that the most represented sectors are « trade, vehicles and domestic articles repairing », « financial activities », « estate services, hires and services to enterprises » and « manufacturing activities ». It seems that there is a high correlation between the number of firms in a given sector and its contribution in terms of added value.Seven (7) variables have been identified in the production frontier. The availability of the variables such as the employment level (which include senior executives, senior experts and junior executives, technicians, skilled workers, employees, unskilled workers and apprentice), inputs volume, the amount of the investments in the in-service training and the equipments and other infrastructures volume has relatively been easy. The availability of the variables related to the capital productivity and the work productivity was not obvious.The different productivities of capital and works have been calculated from the rough added value deflated by the general consumption price index. The work productivity takes account of the salary. The relative salary of the personnel has been measured by bringing near the average salary of each enterprise to the average salary of their activity branch to which they belong respectively. In order to take account of the effect of the structure of qualification, the average salary has been, on the one hand, regressed on the counseling rate (report of the executives to the global employment). The residue of the relative salary originated from that regression has been kept as a measure to incite the salary of the personnel. As Lesueur et Plane (1998) indicated it, we maintain that the evaluation of the capital stock from the BDF data is delicate. The book-keeping rule generally forces the enterprises to record their investments at the active for the acquisition value of the goods. Then, the equipments are amortized taking account of their probable length of life according to a digressive or linear mode. The rough value of the immobilization, closer to the active of the balance sheet so much as the goods is not relegated to a lower position, whereas the net accountable value decreases on account of the supposed law of mortality. To evaluate the rough capital stock of each period correctly, complementary information (not available in the basis of data) such as the delivery age of the equipments and their replacement value are necessary; Moreover, the data do not allow us to take account of possible operations of legal re-evaluation of the balance sheets which were able to appear concerning some enterprises. For all these reasons, we preferred to evaluate the stock of the fixed capital from the net investments put together. In order words, we suppose that the value of the available capital is better evaluated when we take account of the legal modalities of amortization rather than when we disregard its usury. A price index for the rough formation of the fixed capital of the Ivoirian productive sector basis 100 in 1995, has been kept as a deflator of the net investments put together. We give an idea of the statistics concerning the used different variables in the production frontier.As it is possible to observe it through the last column of the table n°2, the gaps between the sectors of activity for a common variable are very important. They can possibly introduce some bias in the estimations. That’s why the resort to the logarithm is recommended. This mathematical procedure of variables transformation in time series has the advantages to standardize them and to stabilize them (Greene, 2005).
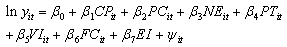
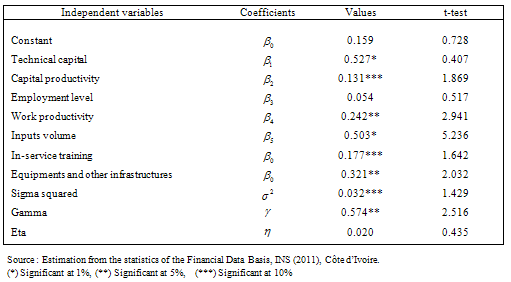
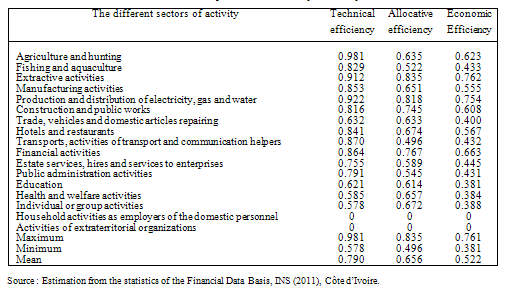
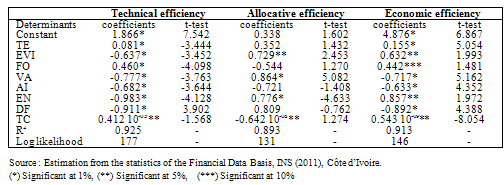
4. Results Presentation
- The results will be presented in three phases. First, it will be about to indicate the production frontier estimation results, then to present the technical, allocative and economic efficiency scores and finally to bring out the determinants of Ivoirian enterprises efficiency. To obtain the estimation results of the production frontier, we resorted to the maximum likelihood method applied by the program Frontier 4.1. The production frontier estimation results specified in equation (3) are presented in table 3.
|
|
|
|
|
 | (18) |
5. Conclusions and Recommendations
- Our analysis tried to understand and explain the determinants of the economic efficiency or economic inefficiency in Côte d’Ivoire. This study has its justification in the presence of sociopolitical crisis which established a sociopolitical instability and disorganized the production system. The additional effect of the use of the production factors which are not really rational and of the qualified manpower which immigrated towards other countries have probably had an influence on the economic efficiency. Therefore, some questions are to be put: is it possible to argue that the Ivorian enterprises are efficient economically? These are the questionable points.To answer them, we have used the data from the bank of financial data of INS. These data are related to 5,000 firms observe over the period from 2000 to 2010. The estimation of stochastic production frontier and the analysis of scores of efficiency have permitted to show that the production system is not efficient economically. Thus, the economic analysis has permitted to confirm the main research hypothesis. The results indicate that the gap between the observed production and the potential production is 20%. This important gap between the degrees of efficiency of the 15 sectors of activity shows that there are enormous possibilities to increase their efficiency. The estimation of a Tobit model has then permitted to identify the explanatory factors of the economic inefficiency. They are the size of enterprises, the institutional environment, the form of the organization, the national saving, the financial debts and the level of employment.On the bias of these results, some recommendations in terms of economic policies can be made. The lack of information about the movements of the populations linked to the sociopolitical instability does not permit us to argue that the qualified manpower which immigrated towards other countries has disorganized the productive system. Nevertheless, as the size of the enterprises is an explanatory factor of the economic inefficiency, we suggest that people who decide and managers give proof of a better mastery of the size of their personnel. That leads to a deep analysis of the recruitment policy and more adapted ergonomics. The results also indicate that the institutional environment has got some negative effects on the economic efficiency in Côte d’Ivoire. So the sociopolitical crisis has made the foundations of the economy fragile and has led to a non optimal combination of available inputs. At this stage, it seems appropriate to invite the political actors to keep on instauring a peaceful and stable climate in order to improve the efficiency of the enterprises settled down in Côte d’Ivoire. According to the results obtained, the national saving is a factor of economic inefficiency. So, we estimate that the government should continue to sensitise the populations about the validity of the mobilization of saving for a greater assistance to the enterprises. The efforts to grant financial aid are necessary in order to help the firms which hav a strong added value and which are job suppliers so as to improve the organization of their productive system. We remain convinced that the application of all these proposals will contribute to a better use of the resources.
Notes
- 1. The computer program, Frontier 4.1, can be used to obtain the maximum likelihood estimations of a subassembly of functions of the stochastic production frontier or the costs frontier. This program is compatible with the panel data, the time series, the cost and production functions, the truncated normal distribution or not etc. It is not compatible with the gamma and exponential distributions. The application of Frontier 4.1 is done with the five following files: Frontier 4.1 Exe (executive file), Front 41,000 (stating file), Fata file (file of data basis), Instruction file (command file) and output file (results display file). It’s important to specify that the data are listed through observations in a test file. 2. In the previous works of Lesueur et Plane (1998), the different sectors of activity are grouped into four. These are the sector of the agro-food industry, the sector of consumer goods, the sector of equipment goods and the sector of intermediary goods. This new classification that we adopt is in conformity with international standards of the nomenclature of the activities of the states members of AFRISAT settled down since the year 2000.