-
Paper Information
- Next Paper
- Previous Paper
- Paper Submission
-
Journal Information
- About This Journal
- Editorial Board
- Current Issue
- Archive
- Author Guidelines
- Contact Us
American Journal of Economics
p-ISSN: 2166-4951 e-ISSN: 2166-496X
2012; 2(1): 25-36
doi: 10.5923/j.economics.20120201.04
Concept, Measurement and Causes of Poverty: Nigeria in Perspective
 Abstract
 Reference
 Full-Text PDF
 Full-Text HTML
Olatomide Waheed Olowa
Department of Agricultural Education, Federal College of Education (Technical), Akoka
Correspondence to: Olatomide Waheed Olowa , Department of Agricultural Education, Federal College of Education (Technical), Akoka.
| Email: |  |
Copyright © 2012 Scientific & Academic Publishing. All Rights Reserved.
The paper discusses the concept of poverty and elucidates the various methods of measurement used in evaluating poverty. Causes of poverty in Nigeria were also brought into perspective. It was concluded that inadequate economic growth is the main cause of poverty in Nigeria.
Keywords: Nigeria, Poverty, Perspective, Alleviation
Cite this paper: Olatomide Waheed Olowa , "Concept, Measurement and Causes of Poverty: Nigeria in Perspective", American Journal of Economics, Vol. 2 No. 1, 2012, pp. 25-36. doi: 10.5923/j.economics.20120201.04.
Article Outline
1. Introduction
- A concise and universally accepted definition of poverty is elusive largely because it affects many aspects of the human conditions, including physical, moral and psychological. Different criteria have, therefore, been used to conceptualize poverty. Most analyses follow the conventional view of poverty as a result of insufficient income for securing basic goods and services. Others view poverty, in part, as a function of education, health, life expectancy, child mortality etc. Blackwood and Lynch (1994), identify the poor, using the criteria of the levels of consumption and expenditure. Further, Sen (1983), relates poverty to entitlements which are taken to be the various bundles of goods and services over which one has command, taking into cognizance the means by which such goods are acquired (for example, Money and Coupons etc) and the availability of the needed goods. Yet, other experts see poverty in very broad terms, such as being unable to meet “basic needs” – (physical; (food, health care, education, shelter etc. and non – physical; participation, identity, etc) requirements for a meaningful life (World Bank, 1996). Poverty may arise from changes in average income or changes in the distribution of income. Let us for instance, assume a relationship between the poverty line (L) below which an individual is poor and the average incomes of the population (Y). The poverty index will decrease (increase) as L (Y) increases (decreases). Since higher average incomes are above the poverty line, other things being equal there will be less poverty. Among the “other things” that are equal is the distribution of income. Compare for instance, two countries with identical mean incomes (and poverty line), but with one having a wider area ofdistribution of incomes (that is one with greater incomeinequality); poverty will generally be greater in the country with higher inequality, since there will be relatively more people with incomes lower than the poverty line (L). Thus, the distribution of income has an important influence on poverty.Social science literature is replete with attempts by economists and social scientists to conceptualize the phenomenon of poverty. Broadly, poverty can be conceptualized in four ways; these are lack of access to basic needs/goods; a result of lack of or impaired access to productive resources; outcome of inefficient use of common resources; and result of “exclusive mechanisms”. Poverty as lack of access to basic needs/goods is essentially economic or consumption oriented. It explains poverty in material terms and specifically employs consumption -based categories to explain the extent and depth of poverty, and establish who is and who is not poor. Thus, the poor are conceived as those individuals or households in a particular society, incapable of purchasing a specified basket of basic goods and services. Basic goods are nutrition, shelter/housing, water, healthcare, access to productive resources including education, working skills and tools and political and civil rights to participate in decisions concerning socio-economic conditions (Streeten and Burki, 1978). The first three are the basic needs/goods necessary for survival. Impaired access to productive resources (agricultural land, physical capital and financial assets) leads to absolute low income, unemployment, undernourishment etc. Inadequate endowment of human capital is also a major cause of poverty. Generally, impaired access to resources shifts the focus on poverty and it curtails the capability of individual to convert available productive resources to a higher quality of life (Sen, 1977;Adeyeye,1987;Ogwumike,2002).Poverty can also be the outcome of inefficient use of common resources. This may result from weak policy environment, inadequate infrastructure, weak access to technology, credit etc. Also, it can be due to certain groups using certain mechanisms in the system to exclude “problem groups” from participating in economic development, including the democratic process. In Sub-Sahara Africa (SSA), the agricultural sector was exploited through direct and indirect taxation throughout the colonial and post-colonial decades leading to poor growth performance of the sector, heightened rural -urban migration and employment crisis. In urban SSA, Silver (1994) suggests three paradigms of exclusion: the individual’s specialization that cannot be accommodated in the factor market (specialization paradigms); the various interest groups that establish control over the input of available resources, for example, on goods and labour markets and simultaneously foster solidarity within the respective interest groups (monopoly paradigms); and the individual which has a troubled relationship with the community (solidarity paradigm).Poverty can be structural (chronic) or transient. The former is defined as persistent or permanent socio-economic deprivations and is linked to a host of factors such as limited productive resources, lack of skills for gainful employment, endemic socio-political and cultural factors and gender. The latter, on the other hand, is defined as transitory/temporary and is linked to natural and man -made disasters. Transient poverty is more reversible but can become structural if it persists. It is generally agreed that in conceptualizing poverty, low income or low consumption is its symptom. This has been used for the construction of poverty lines. Various theories have been advanced in order to put in proper perspective the mechanics of poverty. The orthodox Western views of poverty, reflected in the “Vicious circle” hypothesis stating that a poor person is poor because he is poor, and may remain poor, unless the person’s income level increases significantly enough to pull the person in question out of the poverty trap. To the classical school of thought, such improvement can only be real and sustained, if and only if, the population growth is checked and the “limits of growth” are eliminated. Further, the early classical theorists in the attempt to illuminate on the concept of poverty based their analytical framework on the laws of diminishing returns which was believed to be universal in content although this was later upgraded at the time of Alfred Marshall and his contemporaries when the law of increasing returns in industry was more clearly articulated. Understanding the nature of poverty perhaps received a boost following Marxian theoretical formulation largely based on the principle of exploitation of labour. Marxian theoretical formulations presents the economy as ultimately polarized into a few rich capitalists and the masses made up of the poor miserable workers. Technological progress, it was argued, would be labour saving, resulting in displacement of workers to join the reserved army of the unemployed, whose presence depresses the wage level. Joseph Bocke developed a model of dualistic economies which was later popularized by Arthur Lewis. In accordance with this model, the national economy was divided with two parallel institutional production sectors, namely, the traditional sector and the modern sector. The latter is dominated by foreign trade, technology investment and foreign management and is characterized by the beneficial values of discipline, hard work and productive creativity. On the other hand, in the traditional sector, the static low- level equilibrium conditions advanced by the vicious circle of poverty theory are said to hold. According to this school of thought, the subsistence life style and a cultural value that are antitheses to economic growth and modernization dominate. Local ineptitude and the people’s apparent lack of response to normal monetary incentives to hard work therefore provide explanation for poverty. This intuitively implies that the poor person is the cause of his/her poverty. Understanding the nature of poverty became upgraded with the modern theoretical approach that considers the income dimension as the core of most poverty -related problems. Poverty may arise from changes in average income, or changes in the distributed income. Equitably distributed income increases the chance of the poor to have access to basic services (food consumption, housing etc). Indeed, it is now generally agreed that although there is close positive relationship between per capita income (PCI) and the measures of well-being, it is not so much the level of PCI which determines capabilities but how it is distributed. The argument for growth as a precondition for poverty reduction is because it increases, mean incomes and the narrowing of income distribution. Again, a major lesson that can be drawn from the conceptualization of poverty above is that any attempt to design pragmatic approach to poverty alleviation has to adopt mixture of strategies since poverty is multifaceted in scope and dimension.
2. Measurement of Poverty
- But how do we measure poverty without losing sight of its various dimensions? Ajakaiye and Adeyeye (1999) stressed that Poverty measurement is undertaken to:● Determine a yardstick for measuring standard of living. ● Choose a cut-off poverty line, which separates the poor from the non -poor(indication of how many people are poor). ● Take account of the distribution of standard of living among the poor. ● Comparison of poverty overt time, among individuals, group or nations. ● Guide policy on poverty alleviation. ● There are certain desirable properties of the measure of poverty. They are: ● Monotonicity axiom (i.e measure of poverty should increase when the income of the poor household decreases). ● The transfer axiom i.e poverty of household should increase when income is transferred from a poor to a less poor household. ● Demonstrate the distribution of living standard among the poor. ● The measure should be additively decomposable by population sub groups. Measurement of poverty is complex and varied. Discussion of poverty measure has, therefore, commenced with the simple living standard measure, poverty line determination and array of measures involved in absolute and relative poverty measures. Measure of poverty that enables us show its decomposability by population, capture issue of social capital and how the poor themselves measure poverty have been highlighted.Living standards: This is generally measured using current consumer spending or income. A measure of current consumer spending is generally preferred to income as a measure of current living standards for two reasons. First, current consumption is often taken to be a better indicator than current income because instantaneous utility depends directly on consumption, not on income per se. Second, current consumption may also be a good indicator of Long-term average well-being, as it will reveal information about incomes at other dates, in the past and future. This is because incomes (including those of the poor) often vary over time in fairly predictable ways-particularly in agrarian economies such as Nigeria. Alderman and Paxson (1992), Deaton (1992). Further, income as a measure of living standards is often questioned on the ground of incorrect rendition by the respondents. On balance, consumption expenditure is preferred to income as a measure of living standard.Poverty lines in Theory: A poverty line can be defined as the monetary cost to a given person, at a given place and time, of a reference level of welfare. People who do not attain that level of welfare are deemed poor; and those who do are not. A distinction is sometimes made between “absolute poverty line” and “relative poverty line”, whereby the former has fixed “real value” over time and space, while a relative poverty line rises with average expenditure. Arguably, for the purposes of informing anti -poverty policies, a poverty line should always be absolute i n the space of welfare. Such a poverty line guarantees that the poverty comparisons made are consistent in the sense that two individuals with the same level of welfare are treated the same way. Objective Poverty Lines: Objective poverty line approaches can be interpreted as attempts to anchor the reference utility level to attain basic capabilities, of which the most commonly identified relate to the adequacy of consumption for living a healthy and active life, including participating fully in the society. Sen.(1985, 1987). Two methods of measuring objective poverty line are food energy intake and cost of basic needs. The food-energy intake method: A popular practical method of setting poverty lines involves finding the consumption expenditure or income level at which food energy intake is just sufficient to meet pre-determined food energy requirements. Setting food-energy requirements can be a difficult step. For instance, requirements vary across individuals and over time for a given individual. Food energy intake will naturally vary at a given expenditure level, y. Recognizing this fact, the method typically calculates an expected value of intake. Let k denote food-energy intake, which is a random variable. The requirement level is k which is taken to be fixed (this can be readily relaxed). As long as the expected value of food-energy intake conditional on total consumption expenditure, E (k/y), is strictly increasing in y over an interval which includes k then there will exist a poverty line z such that E (k/z) = k This can be termed the “food-energy- intake” (FEI) method (Ravallion, 1994; (Ravallion and Bidani, 1994). The method has been used in numerous countries; for example see Dandekar and Rath (1971), Osmani (1982), Greer and Thorbecke (1986), and Paul (1989).Figure 1 illustrates the method. The vertical axis is food-energy intake, plotted against total income or expenditure on the horizontal axis. A line of “best fit” is indicated; this is the expected value of caloric intake at a given value of total consumption. By simply inverting this line, one then finds the expenditure z at which a person typically attains the stipulated food-energy requirement. Food-energy intake (calories per day)
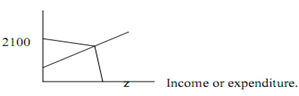 | Figure 1. The Food-Energy Intake Method |
 The Sen index has a major drawback. It is more responsive to improvements in the headcount than it is to reduction in the income gap or to improvements in the distribution of income among the poor. This index indicates that the efficient way to reduce poverty is to help the least needy first and the neediest last. The physical quality of life index (PQLI): The PQLI is attributed to Morris (1979). It measures how well societies satisfy certain specific ‘life-serving social characteristics’ or ‘achieved well-being’ (Doessel and Gounder, 1994). Thus its focus is on social development. The PQL is based on three indicators: infant mortality, life expectancy and basic literacy. Computationally, PQL is given by:PQL = f (IM, e, It) Where IM = infant mortalitye = life expectancyLit = literacyThe indices formed from these three indicators are summed up and the average give the PQLI (physical quality of life index).
 Where, IMI = infant mortality indexel = life expectancy indexLit = Literacy indexThe human development index (HDI): The HDI is the most recent composite index devised by the United Nations Development Programme (UNDP, 1990). This index focuses on human development. It incorporates income and non -income factors. Three factors- longevity, knowledge and income are the variables of the index. Longevity is measured by life expectancy at birth (e0), knowledge is measured in terms of literacy. The third variable is per capita income. Generally, therefore, UNDP’s human development HD is specified as:
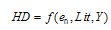 Where,e0 = life expectancy at birth Lit = literacy rate Y = per capita income These three indicators-life expectancy, literacy, and the logarithm of real GDP per capita are specified at the national level as components of the index. By looking across a range of countries, the maximum and minimum values for each indicator are established (Ajakaiye and Adeyeye, 1999).Relative poverty measures: Relative poverty measures define the segment of the population that is poor in relation to the set income of the general population. Such a poverty line is set at one-half of the mean income, or at the 40th percentile of the distribution. There are two main kinds of relative measures. Average income, this is the average income of the poorest 40 percent of the population and/or the average income of the poorest 10 or 20 percent of the population. The second is the number or population of people whose incomes are less than or equal to predetermined percentage of the mean income say 50% or less of the mean income.Composite measure of poverty proposed by Foster, Greer and Thorbecke (FGT) (1984): Foster et al (1984) proposed a family of poverty indices, based on a single formula, capable of incorporating any degree of concern about poverty through the “poverty aversion” parameter, . This is the so-called P-alpha measures of poverty or the poverty gap index:
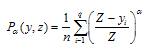 Zi s the poverty line, q is the number of households/persons below the poverty line, N is total sample population, Yi is the income of the household, and
  is the FGT parameter, which takes the values 0, 1 and 2, depending on the degree of concern about poverty. The quantity in parentheses is the proportionate shortfall of income below the poverty line. By increasing the value of
  the “aversion” to poverty as measured by the index is increased. For example, where there is no aversion to poverty,
  = 0, the index is simply
 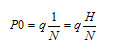 This is equal to the head-count ratio. This index measures the incidence of poverty. If the degree of aversion to poverty is increased such that when
  = 1, the index becomes
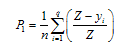 Here the head-count ratio is multiplied by the income gap between the average poor person and the poverty line. This index measures the depth of poverty and it is also referred to as income gap’ or ‘poverty gap’ measure. Although superior to P0, PI still implies uniform concern about the depth of poverty, in that it weights the various income gaps of the poor equally. P2 or FGT index allows for concern about the poorest of the poor through attaching greater weight to the poverty of the poorest than those just below the poverty line. This is done by squaring the income gap to capture the severity of poverty:
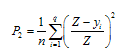 This index satisfies the Sen-Transfer axiom which requires that when income is transferred from a poor to a poorer person, measured poverty decreases. Another advantage of the P-alpha measures is their decomposability. The overall poverty can be expressed as the sum of groups; poverty weighted by the population share of each group.Thus,
 Where j= 1,2,3 … m groups, Kj is population share of each group, and P j is poverty measure for each group. The contribution of each group, Cj, to overall poverty can then be calculated. The contribution to overall poverty, like in the case of inequality, well provides a guide as to where poverty is concentrated and where policy interventions should be targeted.
3. Nigeria Poverty Profile and Causes of Poverty
3.1. The Poverty Profile
- Nigeria's economy relies heavily on oil, which constitutes almost all its exports and budgetary revenues. In 1973, the first oil shock brought a dramatic positive impact on most economic indicators; real per capita income, private consumption and real wages rose sharply. At the same time, according to Anusionwu and Diejomoah (1981), income inequalities increased sharply, particularly between urban and rural areas, and primarily as a result of oil booms and their spin-offs. Between 1980 and 1985, economic conditions worsened, mainly because of the decrease in the international price of oil. The oil boom contributed to a large appreciation of the naira (with a negative impact on non-oil tradeables, especially agriculture, and harming employment and income for the immobile). In 1986, the government adopted a structural adjustment programme. The depreciation of the naira combined with the rising oil prices in 1990 boosted the economy; between 1986 and 1992, real GDP grew by an average of 5% per year, but economic growth slowed again during 1993-1995. According to the World Bank (1996b), by 1994 real per capita income and consumption were hardly above levels in 1971.•severity of poverty as well as the incidence of extreme poverty increased between 1985 and 1992. While the absolute number of poor decreased from 36 million to 34.7 million between 1985 and 1992, the number of extreme poor increased from 10 million to 13.9 million. Income inequalities among the whole population increased from 0.387 in 1985 to 0.449 in 1992, and the Gini among the poor from 0.188 to 0.251. The poor have the following characteristics (World Bank, 1996b):•In 1992, 62% of the population was rural. Among these 63 million people, 22.8 million were poor (36%), while 9.6 million were extremely poor (15%). In urban areas, the incidence of poverty was 30% and the incidence of extreme poverty 11%. Poverty intensity was 16% for the rural poor and 12% for the urban poor. The overall decline in national poverty between 1985 and 1992 masks different trends for the urban and rural sectors. Urban poverty incidence increased and rural poverty declined. The number of poor in rural areas fell from 26.3 to 22.8 million, while in urban areas it rose from 9.7 to 11.9 million For the extreme poor, there was a similar trend of urban immizeration, with a huge increase of extreme poverty in urban areas from 1.5 million to 4.3 million and a small increase in rural extreme poverty from 8.6 to 9.6 million.•The incidence of poverty was greater among male-headed households than female-headed households: for male-headed households it was 44% at the national level in 1985 and 36% in 1992, against 37% and 21%, respectively, for female-headed households. In 1992, male-headed households formed 90% of all households and contributed to 92% of rural poverty and to 87% of urban poverty. Despite being the largest economy in sub-Saharan Africa, with some 20% of the region’s population, little information on poverty and inequality in Nigeria is available. The World Bank's poverty assessment on Nigeria (1996b) provides one of the few good overviews of poverty and its correlates over the 1980s. It relies mainly on two national consumer surveys, of 1985 and 1992. With a relative upper poverty line of two-thirds of 1985 mean per capita household expenditure, poverty incidence decreased from 43% to 34% between 1985 and 1992. Using an extreme poverty line of one-thirds of mean expenditure, the proportion of the population in extreme poverty rose from 12% in 1985 to 14% in 1992. Intensity and Unusually (cf. Lipton, 1995), poverty incidence was the lowest among households whose head was between 16 and 25 years old (in this category 20% were poor in 1985 and 22% in 1992). The older the household head, the more likely the household to be in poverty; in 1985, among households with heads between 36 and 55 years, 46% were poor (36% in 1992); in households with heads over 66 years, 52% were poor in 1985 (35% in 1992).•Employment status of the household head was closely related to poverty in both 1985 and 1992, though rural and national poverty incidences fell for all status groups. In 1985 and 1992, at the national, rural and urban levels, the highest incidence of poverty was found among the self-employed: at the national level, in 1985, their poverty incidence was 53% against 46% for wage earners (in 1992 it was 35% against 28%). Agricultural workers formed the largest component of the extremely poor in 1992 (though falling from 87% in 1985 to 67% in 1992), followed by sales workers (rising from 4% of the extremely poor to 10%, respectively). •In 1985, the incidence of poverty was 48% among the population with no education, 36% among the population with primary education, 28% among the population with secondary education and a surprisingly high 24% among the population with post-secondary education. In 1992, these figures were 40%, 29%, 23% and 23%.The NBS (2005) conducted five surveys which revealed that national poverty rates was 28.1percent (1980), 46.3 per cent (1985), 42.76 per cent (1992), 65.6 per cent (1996) and 54.4 per cent for 2004. Poverty incidence in the country recorded increases between the period 1980 and 1985 and between 1992 and 1996. The results also show appreciable decrease in poverty rates between 1985 and 1992 and between 1996 and 2004. Even with the drop in poverty rates, the population in poverty has maintained a steady increase from 17.7 million in 1980 to 68.7 million in 2004 (NBS, 2005).Considering the period, 1980-2004, the proportion of the core poor increased from 6.2 per cent in 1980 to 29.3 per cent in 1996 and then came down to 21.8 per cent in 2004. For the moderately poor the picture is quite different as the proportion recorded increased between 1980 and 1985 from 21.0 per cent, 34.2 per cent, and 1992 and 1996 28.9 per cent to 36.5 per cent but decreased during the periods 1985 and 1992 from 34.2 per cent to 28.9 per cent and 1996-2004 from 36.3 per cent to 32.4 per cent.
3.2. Nature and Dimension of Poverty in Nigeria
The findings of National Bureau of Statistic (2005) using Nigeria Living Standard Survey 2004 revealed the various nature, dimensions and characteristics of the poor. The report provided avalanche evidence on some of the poverty measurement techniques and dimensions earlier discussed in preceding paragraphs.
- Poverty Trends Relative Poverty Measure The national incidence of relative poverty increased sharply both between1980-1985 and between 1992 and 1996. The national incidence of relative poverty dropped from 65.6 per cent in 1966 to 54.4 per cent in 2004 representing 11.2 per cent decline over the period. The disaggregation by sector showed a sharper decline in the urban areas between 1996 and 2004. In the urban areas it declined from 58.2 per cent in 1996 to 43.2 per cent in 2004, which represented a decline of 15.0 per cent. In the rural areas, it declined from 69.8 per cent in 1996 to 63.3 per cent, representing 6.5 per cent decline. Objective Poverty Measure (Food Energy In-take) The result of the 2003/2004 survey revealed that the national incidence of poverty using food consumption of 2900 calories limit was 36.6 per cent but when disaggregated by sector gave 26.5 per cent and 44.1 per cent for urban and rural areas respectively. However, the national incidence of poverty combining food consumption of 2900 calories with a component of non-food was 54.7 per cent. Further sectoral disaggregation showed urban poverty rate of 43.1 per cent and rural poverty rate of 63.8 per cent.Usage of Adjusted Dollar per day The dollar per day gave a national poverty incidence of 51.6 per cent. The urban poverty incidence was 40.1 per cent compared with rural poverty incidence of 60.6 per cent. Subjective Poverty Measure The subjective measure of poverty, which was a self-assessment, indicated a national incidence of poverty of 75.5 per cent, which disaggregated into 70.7 per cent for urban areas, and 79.2 per cent for rural areas. This measure generally increased poverty results because it is based on perception of the people. Human Development Dimensions of Poverty Health The status of health is a strong indication of human development and can also serve as an indicator for poverty. The survey result revealed that about 8.0 per cent of the population consulted health care providers because of low level of awareness, poor facilities and high cost. The quintile analysis showed that about a quarter (25.56 per cent) of population in the first quintile (the poorest) and more than half of the population (56.0 per cent) in the fifth quintile (least poor) consulted medical doctors. The same survey indicated reasonable consultation of traditional healers by all levels of quintiles. About 12.0 per cent of the population of the first quintile and 8.0 per cent of the population of the fifth quintile consulted traditional healers.HIV/AIDS Nine in ten households surveyed were aware of HIV/AIDS among the population. The awareness increased with the level of quintiles from 90.2 per cent in the poorest households to 96.0 per cent in the least poor households. The main source of information on HIV/AIDS was radio, which was 82.0 per cent. Radio, Television and friends accounted for about 90.0 per cent of the source of information from the survey findings. In all the levels of quintiles four in five household members had information from radio. In the same vein, more than forth-fifth (83.5 per cent) of the households protected themselves from HIV/AIDS and other STDs. About 5.0 per cent of the households had undergone tests for HIV/AIDS. The overall rate for knowledge of HIV/AIDS centres was 56.0 per cent. About eight in ten of the members of the households used condom for protection. Education Education is a good measure of human development. The correlation of levels of education with levels of poverty serves as a good measure for manifestations of poverty across the quintiles. The findings showed increasing trend of ever attending school with increasing level of quintile. About 70.0 per cent of the surveyed households had ever attended school. The ability to read and write in English language could determine the ‘voicelessness’ and powerlessness of the population. The results showed that about half (52.1 per cent) of the households could read and write in English language. The quintile results showed an increasing figure with increasing levels of quintile. The poorest quintile had 40.1 per cent compared with 66.1 per cent of the least quintile. On the highest level of education attended, about half (48.0 per cent) of the households in the first quintile had no education compared with about 25.0 per cent of the households in the fifth quintile. Housing Conditions The housing conditions of households can also serve as proxy for welfare measurement. About two-thirds (66.0 per cent) of the households lived in single rooms, while about one-quarter (24.1 per cent) of the households lived in whole buildings. Seventy per cent of the households used firewood as the main source of fuel for cooking, more than a quarter (26.6 per cent) used kerosene, while only 1.1 per cent used gas. The use of mud for wall construction was highest (58.5 per cent) for the poorest households, while the use of cement or concrete was highest (66.0 per cent) for the least poor households. The overall access to safe water in the households was 60.0 per cent. The usage of unprotected well or rainwater was highest (23.0 per cent) in the poorest quintile while the usage of pipe-borne water was highest (28.0 per cent) in the least poor quintile, the fifth quintile. Poverty and Agriculture Poverty in Nigeria is a rural phenomenon where agricultural activities are most predominant. More than four-fifths (86.5 per cent) of the households participated in agriculture in the rural areas compared with only 14.0 per cent in the urban areas. Gender-wise, more males participated in agriculture. Twenty-eight per cent and 15.3 per cent of males and females respectively participated in agriculture. The poor participated more in agriculture than non-agriculture. Twenty-five per cent of the core poor households were in agriculture, while 20.0 per cent were in non-agricultural activities. A similar pattern was revealed among the moderately poor households. The non-poor households participated less in agriculture (about 37.0 per cent), with 46.1 per cent in non-agriculture. More than four-fifth (81.0 per cent) of the livestock were owned by rural households, while 91.1 per cent of the ownership were the male-headed households. This is an indication of ‘feminisation’ of poverty. Gender and Poverty Male-headed households were more likely to be in poverty. The trend results showed for male-headed households that relative incidence of poverty varied increasingly from 29.2 per cent to 58.2 per cent from 1996 to 2004. The results for the female-headed households also varied increasingly from 26.9 per cent to 43.5 per cent from 1998 to 2004. The literacy rate was highest for the males who could read and write in English. The rates were 59.8 per cent and 44.6 per cent for male-headed and female-headed households respectively. The overall average of school attendance was 54.00 per cent for males and 46.0 per cent for females. On time-use on household activities, the females devoted more of their time in this order: child care (17.2 per cent), cooking (10.1 per cent), care of the elderly (9.8 per cent) and recreation (8.3 per cent). The males used more of their time too on childcare (9.9 per cent), recreation (8.2 per cent), care of the elderly (8.2 per cent), going to market (6.67 per cent) and cooking (6.62 per cent). Household Expenditure The quintile analysis showed a high degree of disparity on expenditure pattern. The poorest per capita expenditures were 4,291.00 on food and 3,520.00 on non-food, while the least poor per capita expenditures were 29,489.00 on food and 39,543.00 on non-food. The urban households expended more on food and non-food compared with rural households. The urban households’ per capita household expenditure on non-food almost doubled that of the rural households. The figures were 25,101.00 and 13,058.00 respectively. The per capita household expenditures on food were 18,099.00 and 16,568.00 in urban and rural areas respectively which still showed higher expenditure in urban areas. The rural households expended more of their income on food.
3.3. Causes of Poverty in Nigeria
- There is no one cause or determinant of poverty. On the contrary, combination of several complex factors contributes to poverty. They include low or negative economic growth, inappropriate macroeconomic policies, deficiencies in the labour market resulting in limited job growth, low productivity and low wages in the informal sector, and a lag in human resource development. Other factors which have contributed to a decline in living standards and are structural causes or determinants of poverty include increase in crime and violence, environmental degradation, retrenchment of workers, a fall in the real value of safety nets, and changes in family structures (Ajakaiye and Adeyeye, 1999; Ogwumike, 2002 and NPC, 2004). These are examined below: •Low economic growth performance: Growth of the economy is a must for poverty reduction. In developing countries such as Nigeria growth that is employment generating and with export base is desirable in order to achieve growth that is poverty reducing with equity. Although the economic performance of countries in the World has generally been highly volatile since the early 1980s, on the whole, growth rates have been low or negative, with overall declines in several countries. This is due in part to external shocks such as adverse changes in several countries’ terms of trade, changes in global demand for exports and changes in global interest rates on developing countries external debt. All these are probably responsible for the increase in poverty level in various countries of the world. Extensive evidence links the importance of economic growth to poverty reduction (see World Bank 1990). For example, in Indonesia and Thailand poverty was reduced by between 30 and 40 percent during a twenty -year period in which annual growth rates were approximately 3 percent (investments in the social sectors also contributed). Accordingly, of a sample of countries, those that reduced poverty the least (for example, India and Sri Lanka) had growth rates of less than 1 percent. Growth can reduce poverty through rising employment, increased labour productivity and higher real wages it generates. •Macroeconomic shocks and policy failure: This has been a major cause of poverty in several countries of the world. As many economies in the world faced macroeconomic disequilibrium, mostly in the balance of payments due to expansive aggregate demand policies, terms-of-trade shocks, and natural disasters, it become necessary to undertake major policy reforms. In the process such economies became vulnerable to poverty. Macro-economic shocks and policy failure account for poverty largely because they constrain the poor from using their greatest asset “labour”. Also, monetary policies that adversely affect cost and access to credit by the poor, fiscal policy which results in retrenchment, lay-off and factor Substitution; exchange rate policy which raises the domestic cost of production in an import dependent production system will affect the poor negatively. However, an exchange rate policy which boosts exports particularly those in which the poor are predominantly engaged (for example agriculture) will help reduce poverty. The urban poor, as a result of policy failure, are vulnerable to job losses resulting from job-cut-backs in the public sectors or from the decline of industries adversely affected by shifts in relative prices. They also lose from the removal of food subsidies and other welfare packages. Further, devaluation produced both negative and positive effects on equity and poverty incidence. On the negative side higher production costs of import, especially in import dependent economy usually result in declining capacity utilization rate in manufacturing and lay –off and retrenchment in the private sector all worsening poverty. •Labour markets deficiencies: The poor’s most abundant resource is their labour, a virile labour market is important to reducing poverty and income inequality. In most countries of the world the majority of poor households participate in the labour market in one way or another, and thus poverty is a problem of low wages (in the informal sector), low labour returns to rural self-employment activities, underemployment, and in some cases, protracted unemployment. These problems are affected in different ways by deficiencies in labour market. The majority of the labour force work as paid employees in the private informal sector, followed by employees in the public sector. When there are deficiencies in labour market, the poor are affected by limited job growth and absorption capacity in the formal sector. Also, relatively high labour costs in the formal sector that lead to over expansion of a low-productivity informal sector, thus putting downward pressure on wages in the informal sector (where many of the poor work), and limited opportunities for unskilled youth to acquire job training and skills can perpetuate a cycle of poverty. •Migration: Migration rates do reduce poverty especially when the majority of individuals who migrate are skilled workers. On the other hand, individuals who emigrate vacate jobs in labour markets. Thus, migration drains on skills. It reduces the pace of economic growth and thus slows the process of overall job creation and affects the long-run development potential in a country. Unemployment and underemployment: Employment is a key determinant of poverty. Gainful employment is important for individual to earn income and escape from “income” poverty. While generally in countries of the world the non poor suffer from transitional or involuntary unemployment, the poor are faced with problems of structural unemployment due to lack of skills or extremely low educational levels, medical problems, geographical isolation (which affects some of the rural poor in general and the urban poor due to marginalisation of persons living in high- crime neighbourhood) and in some countries, discrimination based on race or other attributes. Further, underemployment occurs largely in the informal sectors and results in low incomes for an important segment of the labour force, particularly in rural areas. Unemployment is due more to slow economic growth than to the direct effects of imperfections in the labour market, although regulations affecting the formal sector are likely to induce more underemployment in the informal sector. In poorer, rural areas, this mainly takes the form of seasonal unemployment and in urban areas those who have given up searching for work. High unemployment particularly affects youths, women urban dwellers, and those “queuing” for good jobs in the formal sector. •Human resource development: This is germane to human capital development and capability to escape from poverty. Continued investment in human capital with improvements in efficiency is necessary to sustain reduction in poverty changes in the labour market. Investment in people can boost the living standards of households by expanding opportunities, raising productivity, attracting capital investment, and increasing earning power: In addition, providing additional educational opportunities for adolescents may prevent some youths from becoming involved with gangs, drugs and violence, given the evidence linking the perpetrators of crime with school dropouts. •III-Health/Diseases: Good health is basic to human welfare and a fundamental objective of social and economic development. Poor health shackles human capital, reduces returns to learning, impedes entrepreneurial activities and holds back growth and economic development. Diseases cause poverty and vice versa. In most countries of the World major diseases causing poverty are Malaria, HIV/AIDS and other infections/diseases. In Nigeria for instance, AIDS prevalence is about 5.4% with an infected adult population of 2.6 million (Ajakaiye and Adeyeye, 1999). This will constrain availability and participation of this segment of the population in the labour market to earn income.•Debt burden: In several developing countries of the world, debt burden is assuming increasing importance as a cause of poverty. In such countries servicing of the debt has encroached on the volume of resources needed for socio-economic development. The productive sector such as agriculture, manufacturing etc are equally constrained leading to low productivity, low capacity utilization, under employment and low purchasing power thereby subjecting the masses of the people to abject poverty. In Nigeria, at the end of December 2000 external debt stood at US$28.5 (about 80% of GDP),though , a debt pardon deal was brokered between Nigeria and her creditors (Paris Club) during the Obasanjo’s regime, by 2011 debt portfolio was projected to represent 12% of GDP. Amount required to service this debt annually is enough to hamper government expenditure for the provision of social and physical infrastructure for the poor. •Governance: The persistence and pervasiveness of poverty in several countries has been linked to the lack of popular participation in governance and decision -marking as well as weak institutional base. This has led among other things to poor accountability, transparency in resource allocation, weak programme implementation and monitoring. Ultimately, development programmes are rendered ineffective poverty reduction initiatives are therefore ineffective and resources wasted. •Environmental Degradation: Environmental degradation is a cause of accentuated poverty. At the same time, poverty itself can be a cause of environmental degradation. This reverse causality stems from the fact that for poor people in poor countries such as Nigeria, a number of environmental resources are complementary in production and consumption to other goods and services while a number of environmental resources supplement income most especially in time of acute economic stress (Falconer and Arnold, 1989). This can be a source of cumulative causations, where poverty, high fertility rates and environmental degradation feed upon one another. In fact, an erosion of the environmental resource base can make certain categories of people destitute even when the economy on the average grows (Dasgupta, 1993) In several countries of the world inaccessibility of the poor to credit and resource inputs leave them with no choice order than to employ natural resources such as forests, woodlands and rivers in order to survive. Quite often, their continuous exploitation of these resources have led to stress/depletion and environmental degradation thereby making poor both agents and victims of unsatisfactory ecological practices. In most rural areas, developing countries fallow duration has declined to four to five years and in several instances as low as two years. Short fallow period is usually not adequate for regeneration of vegetation and the restoration of host nutrients; soil and water quality are therefore quickly depleted. Among the poor; frequent cutting of forest trees with low replanting rate has resulted in scarcity of fuel wood. Immediate effect of this is that poor households turn to alternative fuels such as crop residues, coconut husks, and rice hulls or elephant grass. The smoke from these inferior fuels according to Cece Laki (1985), is often more poisonous than that of fuel wood, while emissions from all biomass fuels are known to be dangerous sources of air pollution in the house. Also, scarcity of fuel woods forces women to make what is available burn slowly. WHO (1984), reckons that under slow burning conditions wood fuels are capable of producing pollution concentrates higher than fossil fuels and subject the households to more smoke pollutants. The incessant cutting down of trees for firewood and charcoal have hindered prospect for increased yield and hasten the prospect of the creeping desert while profligate use of the country’s resources by industries and industrial pollution from improper waste disposal has further exacerbated the plight of the poor. Other consequences of over exploitation of environment due to poverty are depletion of fish in the local rivers and streams. •Crime and Violence: A steady increase in crime and violence has degraded the quality of life to a varying extent in many counties of the world. Although individuals of all socioeconomic groups are affected, the urban poor are particularly vulnerable to these social problems. There are instances of shootings, gang killings; etc Crime and Violence have serious economic costs. For instance, an increasing proportion of public resources, which are already limited, is required to strengthen police enforcement, support the growing prison population, finance the demands place on the judicial system, and provide health care for persons injured by violence. Other costs include the expensive security systems and guards now required by businesses and homes, the loss in potential revenues from foreign investor and tourists who have sought other destination as a result of the threat of crime, and the migration of the urban middle class. Because of the heterogeneous nature of the poor, it is difficult to link poverty, crime and violence directly. However the adverse social consequences of crime have been closely associated with poverty for example, loss of lives at productive age and quantum loss of properties.Household Determinants of poverty according to Ajakaiye and Adeyeye, (1999) and NBS (2005) include: Age and education of different household members (head), Number of income earners, Household composition and size, Assets owned by household, Access to basic social services, Sex, ethnicity of head, Location variable (rural or urban), Sector of employment, and Remittances to households.
4. Conclusions
- Inadequate economic growth is the main cause of poverty in Nigeria. Nigeria economy has a very narrow and weak base, depending mostly or exportation of petroleum crude oil as a major source of income; the agricultural base of the economy had been frustrated and marginalized (Oyeduntan, 2003). High and growing unemployment has also exacerbated the level of poverty in Nigeria. Other factors that have contributed to the level and evolution of poverty in Nigeria include problems in the productive sector, widening income inequality, weak governance, social conflict and gender, intersectoral and environmental issues. Poverty in especially in the urban area has been made severe by low labour absorption capacity of the nonagricultural sector, especially manufacturing, which is as a result of limited growth of investment and technological innovation. Weak governance which is manifested in corruption, rent seeking, inappropriate planning and neglect of the private sector have contributed immensely to corruption in Nigeria. Furthermore, empirical evidence shows that poverty and environmental degradation are inextricably linked in Nigeria, because 75 percent of rural people depend on natural resources for their livelihood, hence environmental degradation reduces opportunities for poor people to earn sustainable income. Globalization equally worsens the situation of poverty as the basis of challenge and competitions are lacking thus this has manifested in several ways. For instance, the debt burden increased from $14.28 billion in 1980 to about $32 billion in 2000 (Oyeduntan, 2003).